Label and curate video data
6x faster with Encord
Accelerate precise video data annotations without frame rate errors to build production-ready models faster using high-quality labeled videos.
Announcing our Series C with $110M in total funding. Read more →.
VIDEO
Label and curate video data
6x faster with Encord
Accelerate precise video data annotations without frame rate errors to build production-ready models faster using high-quality labeled videos.
Trusted by pioneering AI Teams


Achieve high quality video annotation with granular tooling
Boost annotation efficiency and accuracy with native video rendering
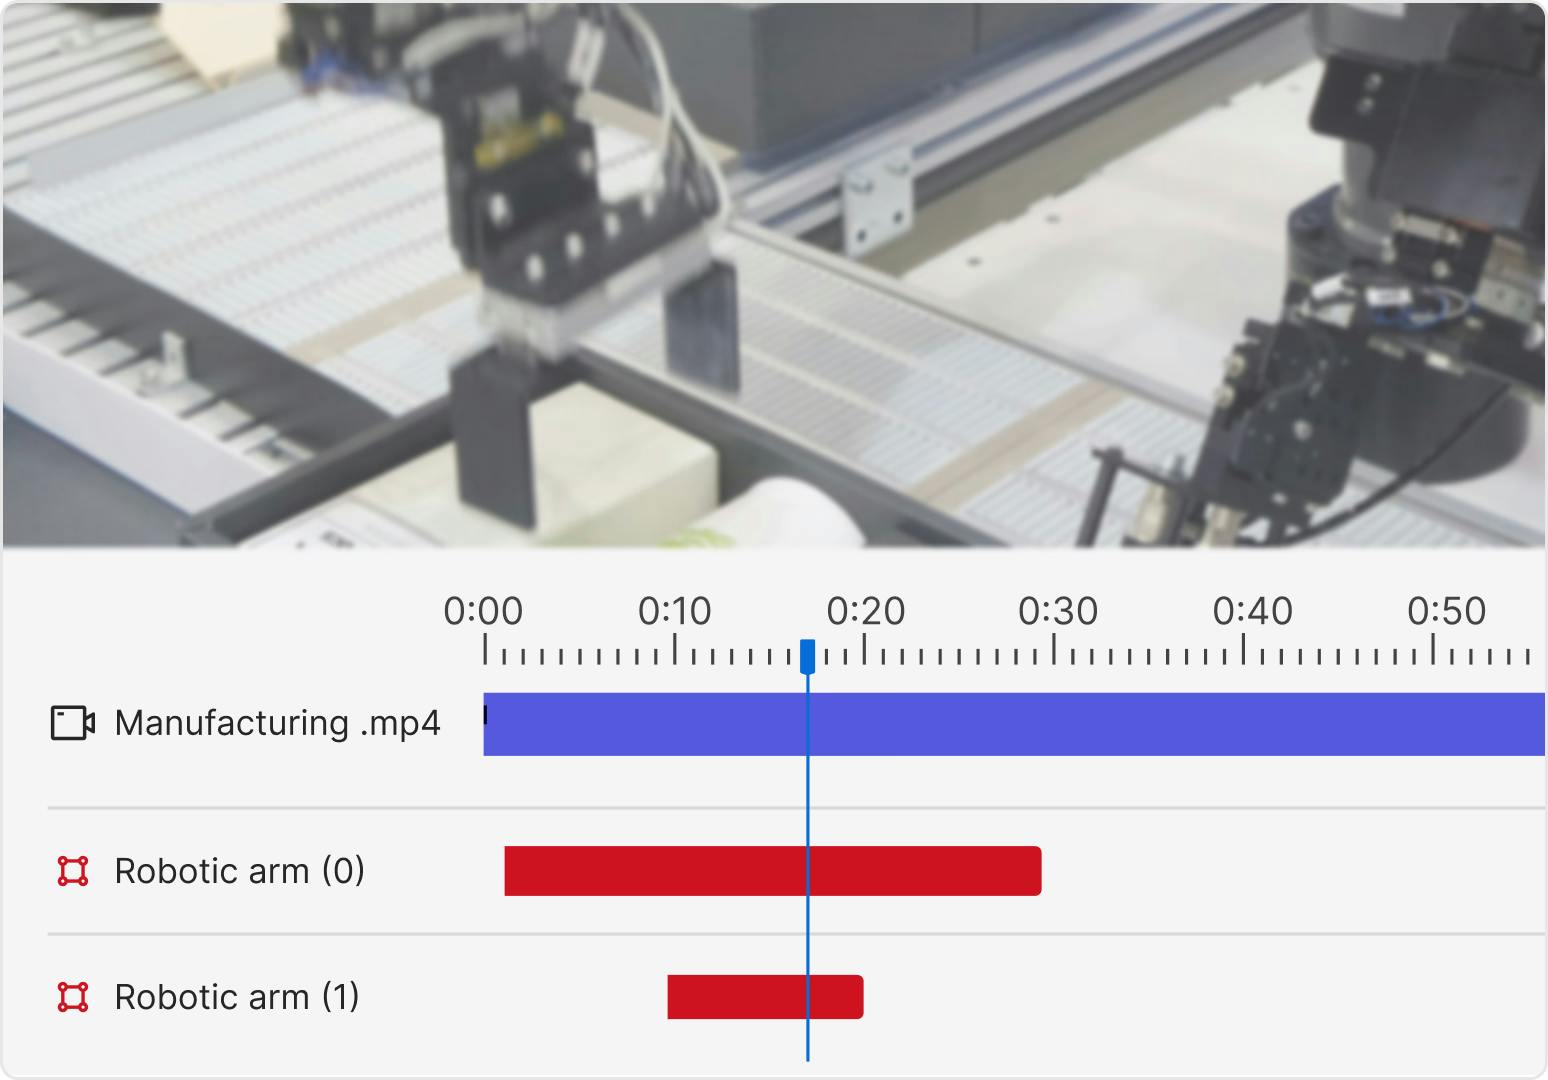
Native rendering for seamless frame synchronization
Preserve temporal context to improve annotation quality and speed. Native video rendering uses 80% less storage boosting data pipeline efficiency.
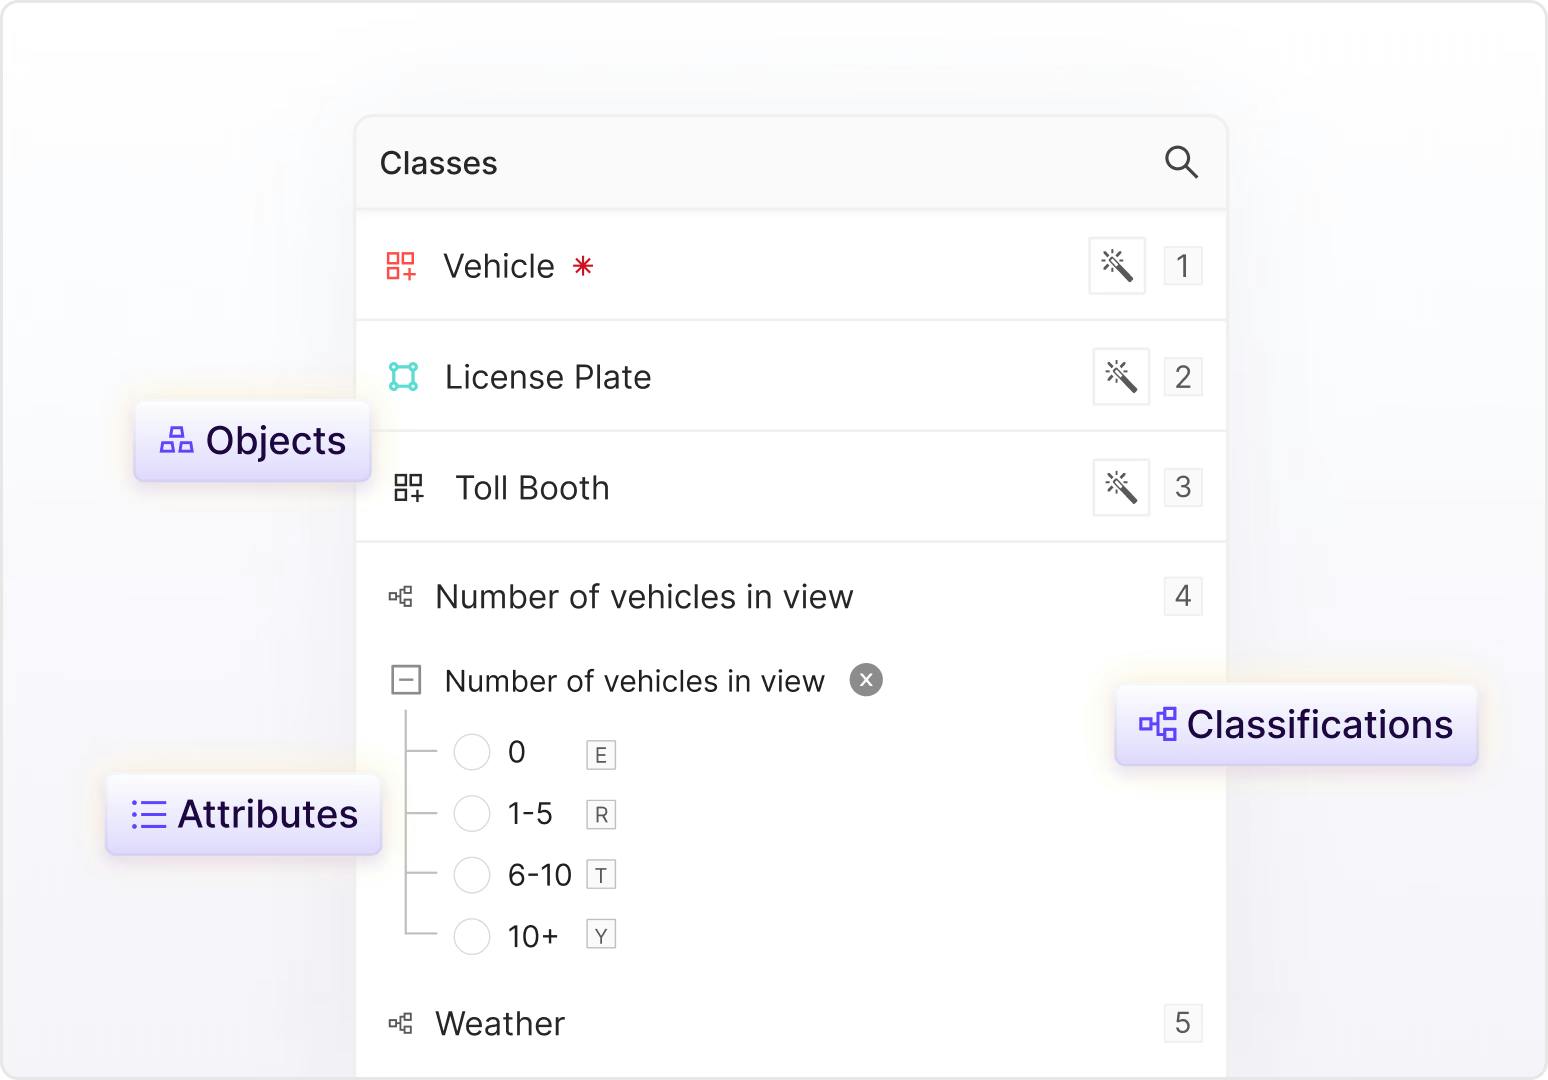
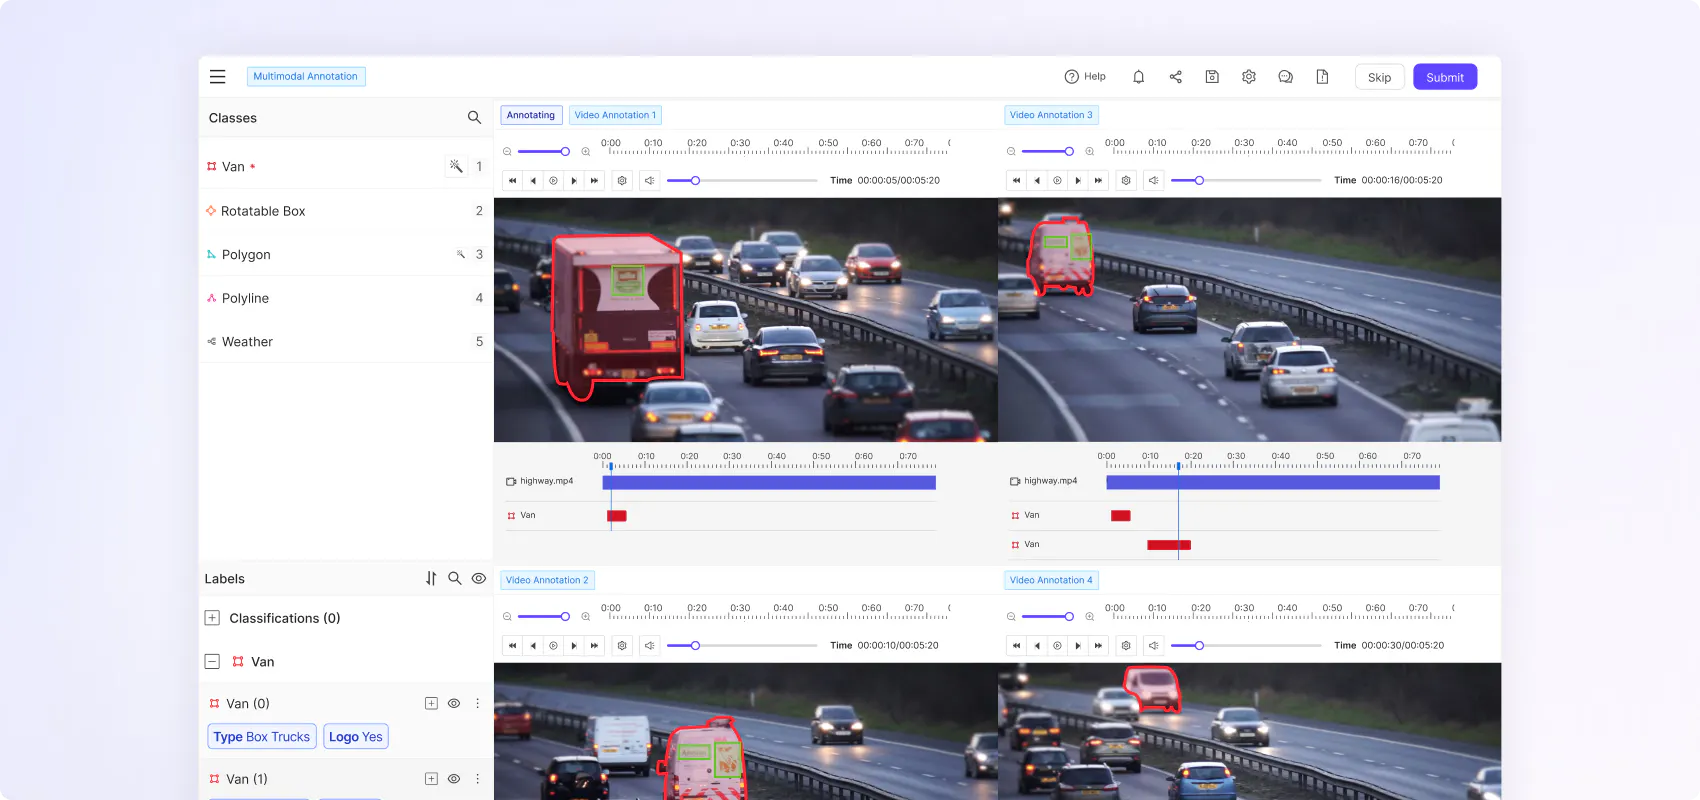
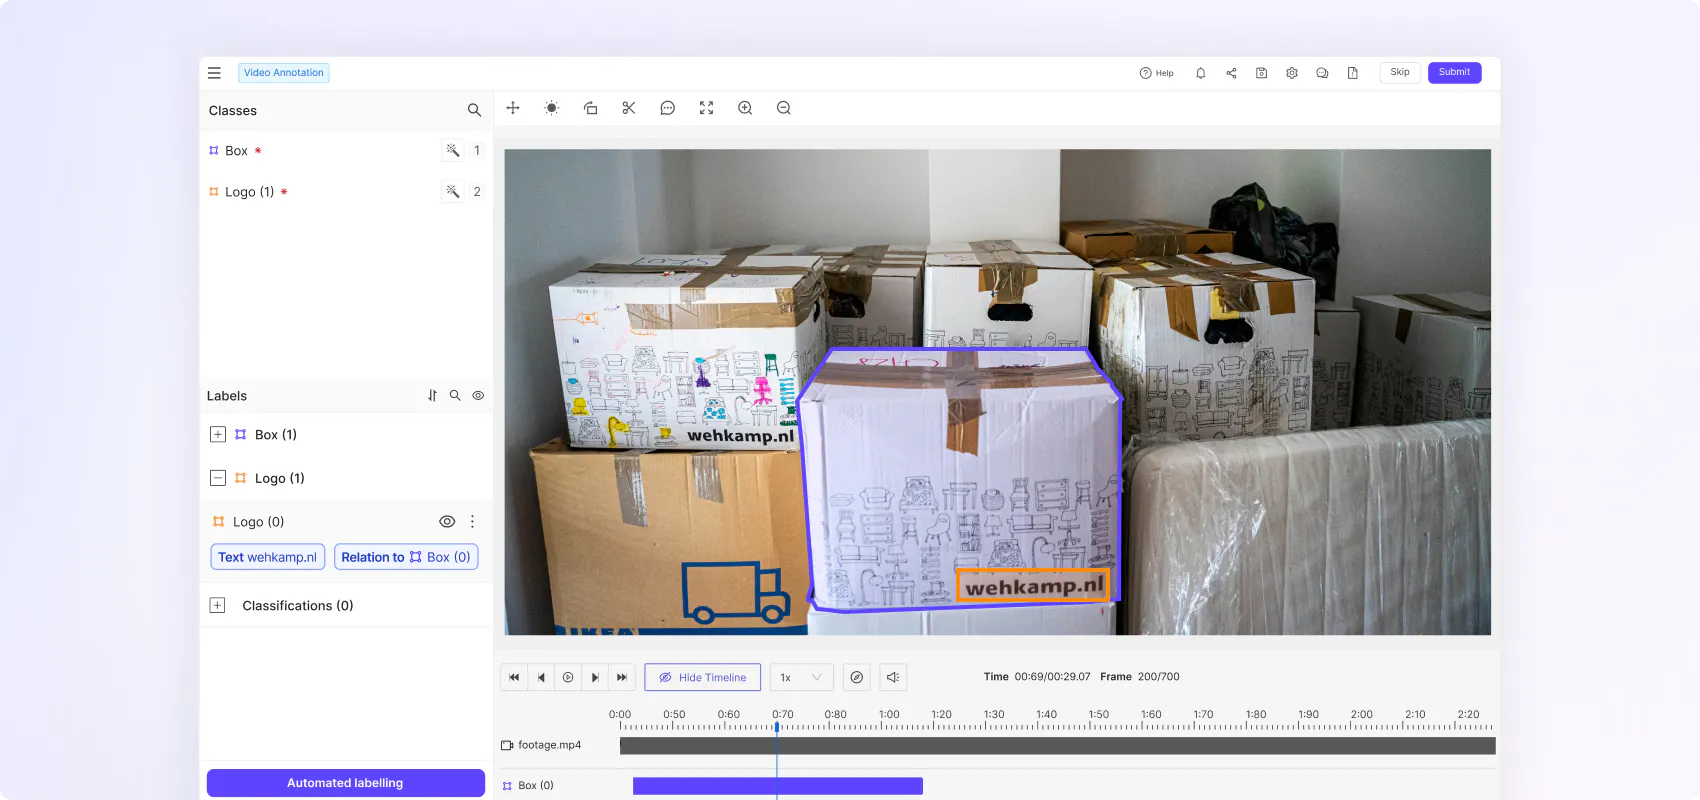
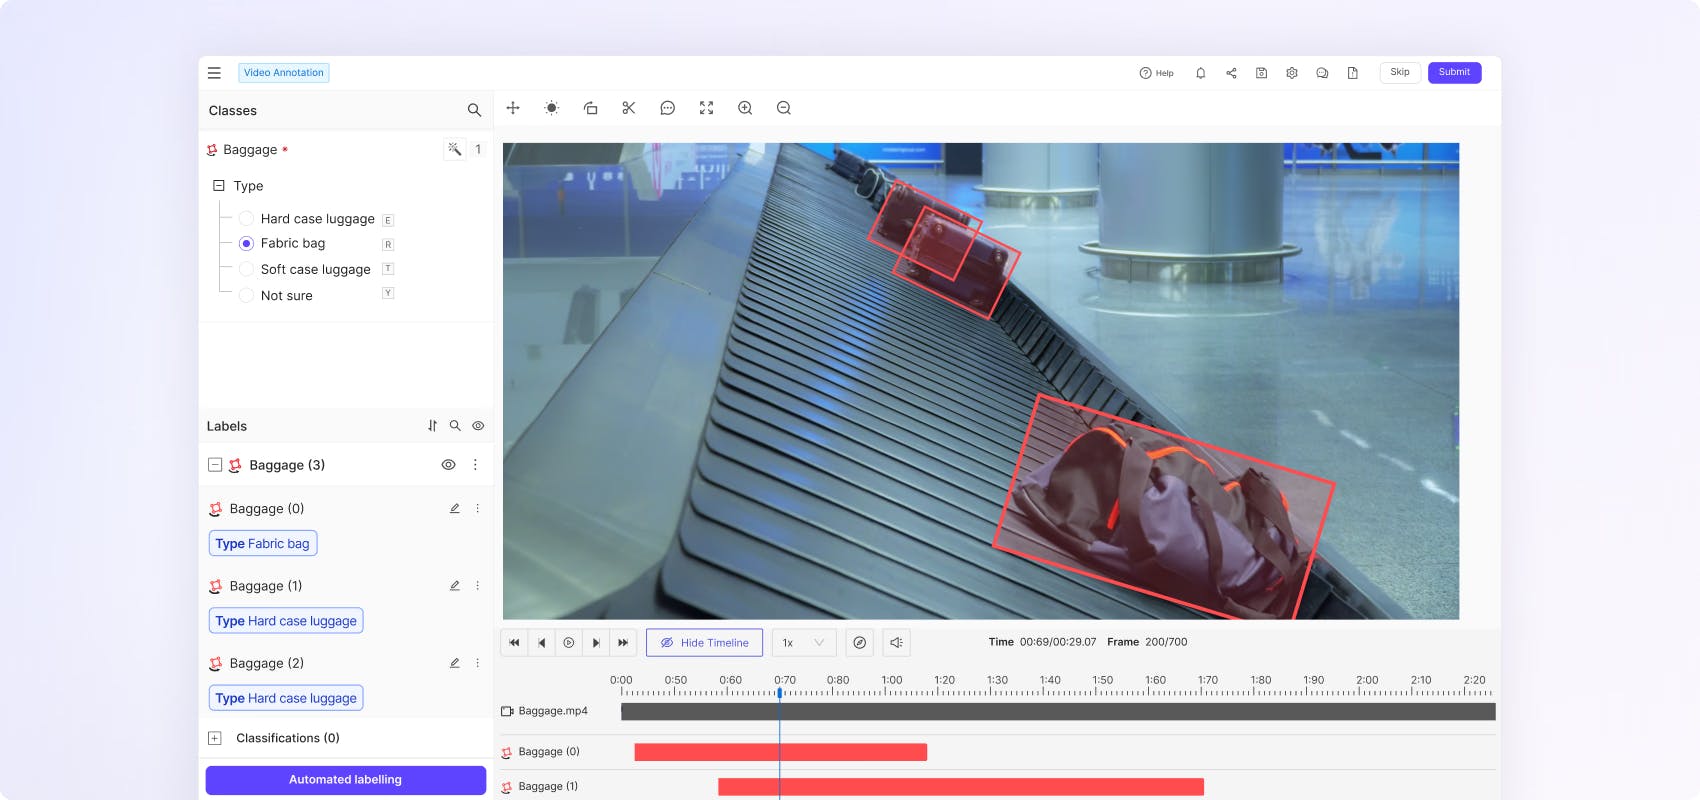
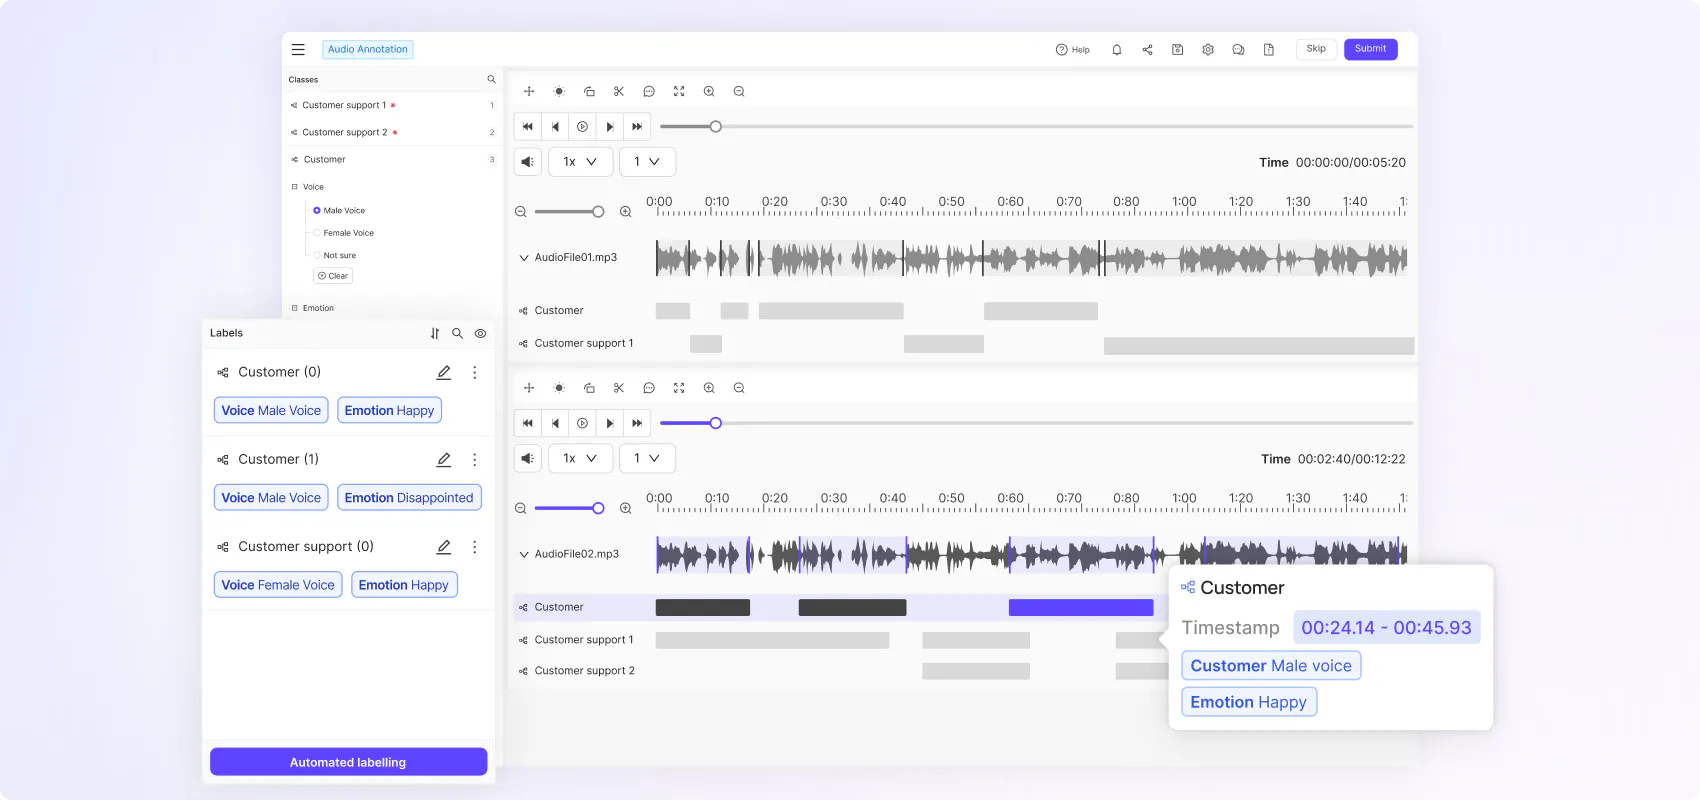
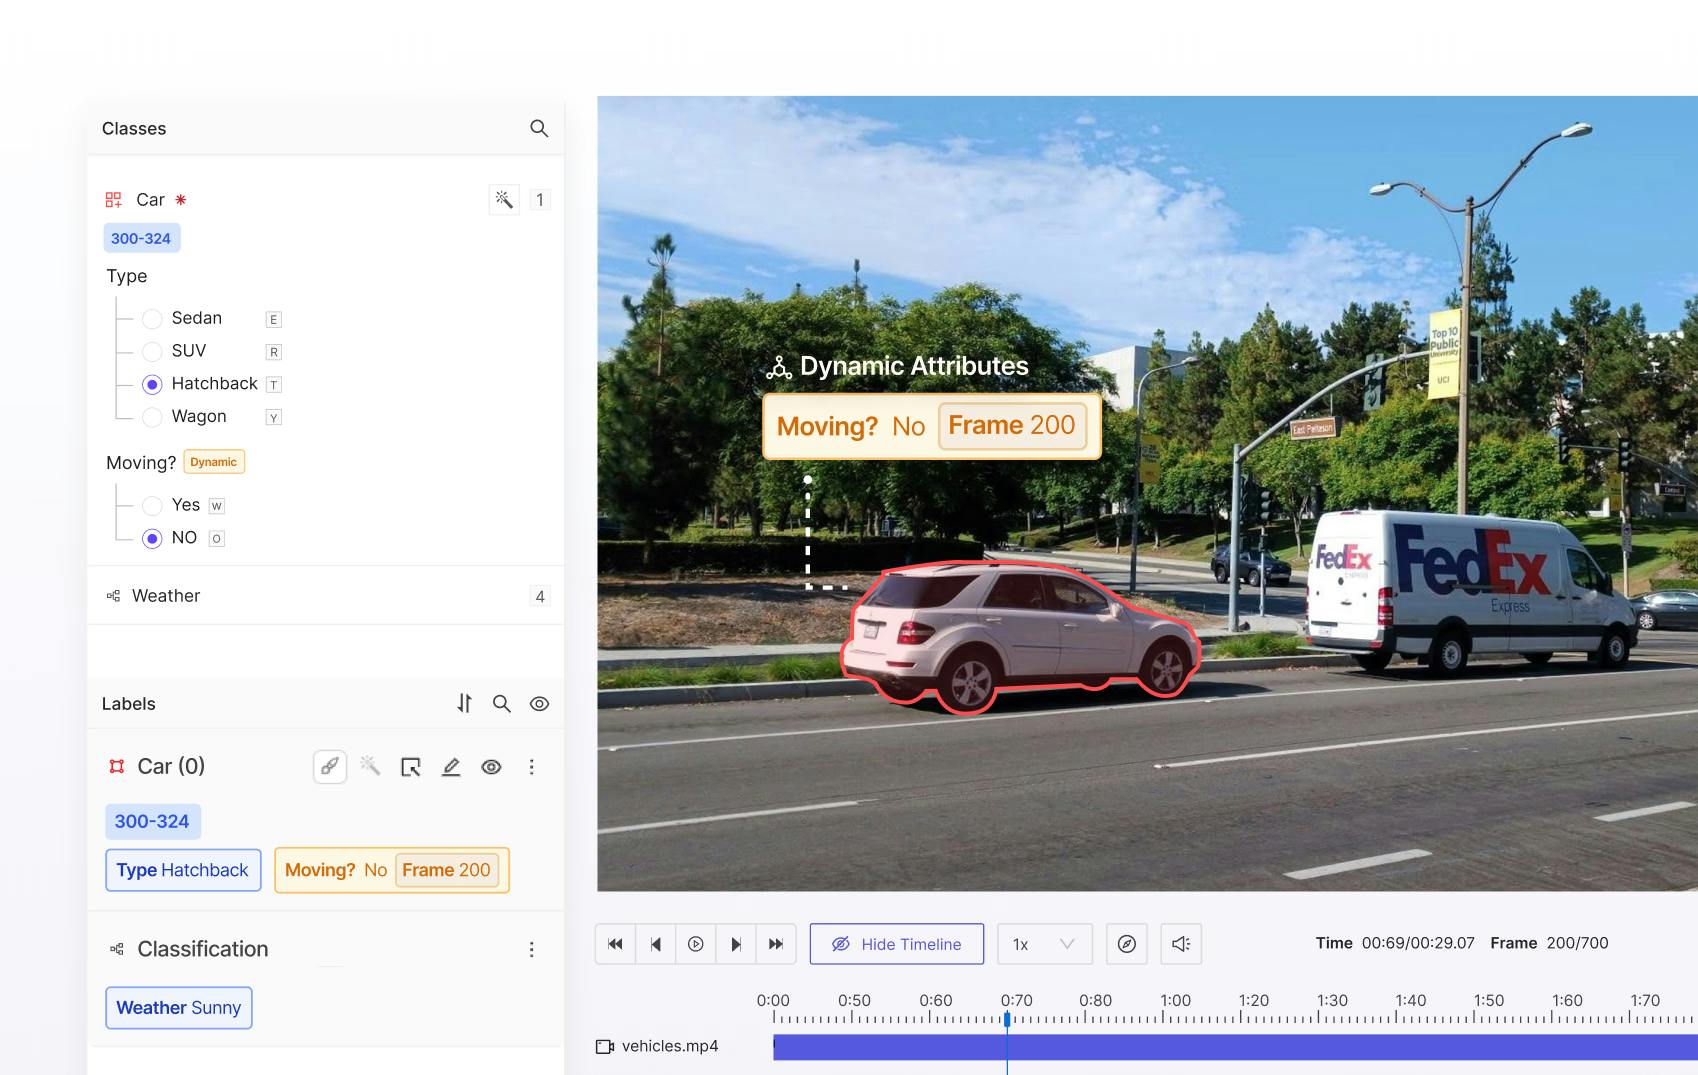
Flexible ontologies for every use case
Create nested classifications with static, dynamic and relation attributes to capture real world scenarios in the granular detail and temporally evolving object behaviour.
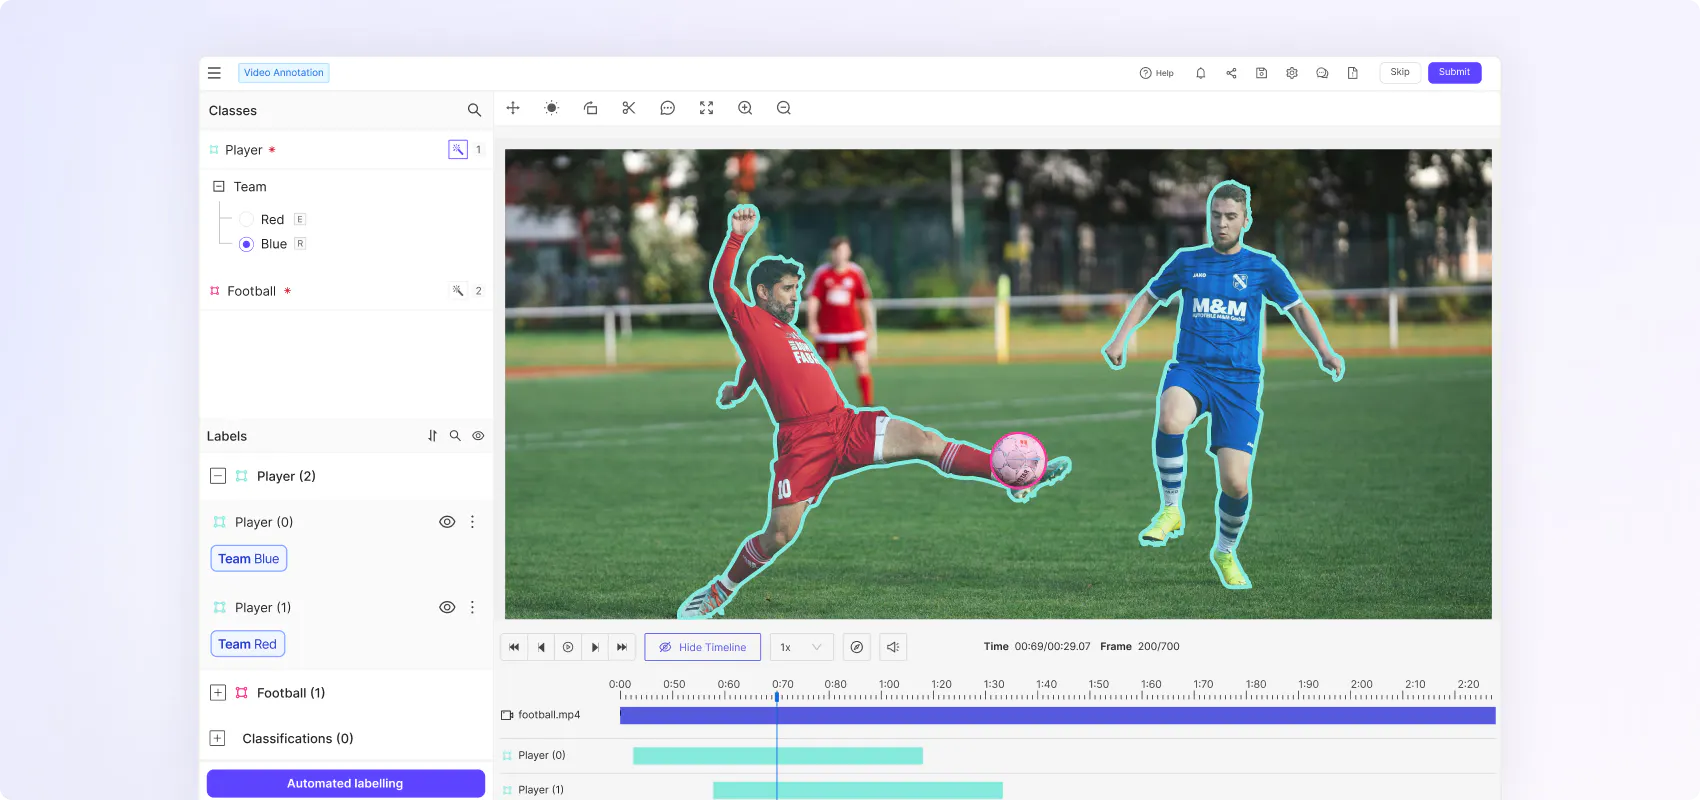
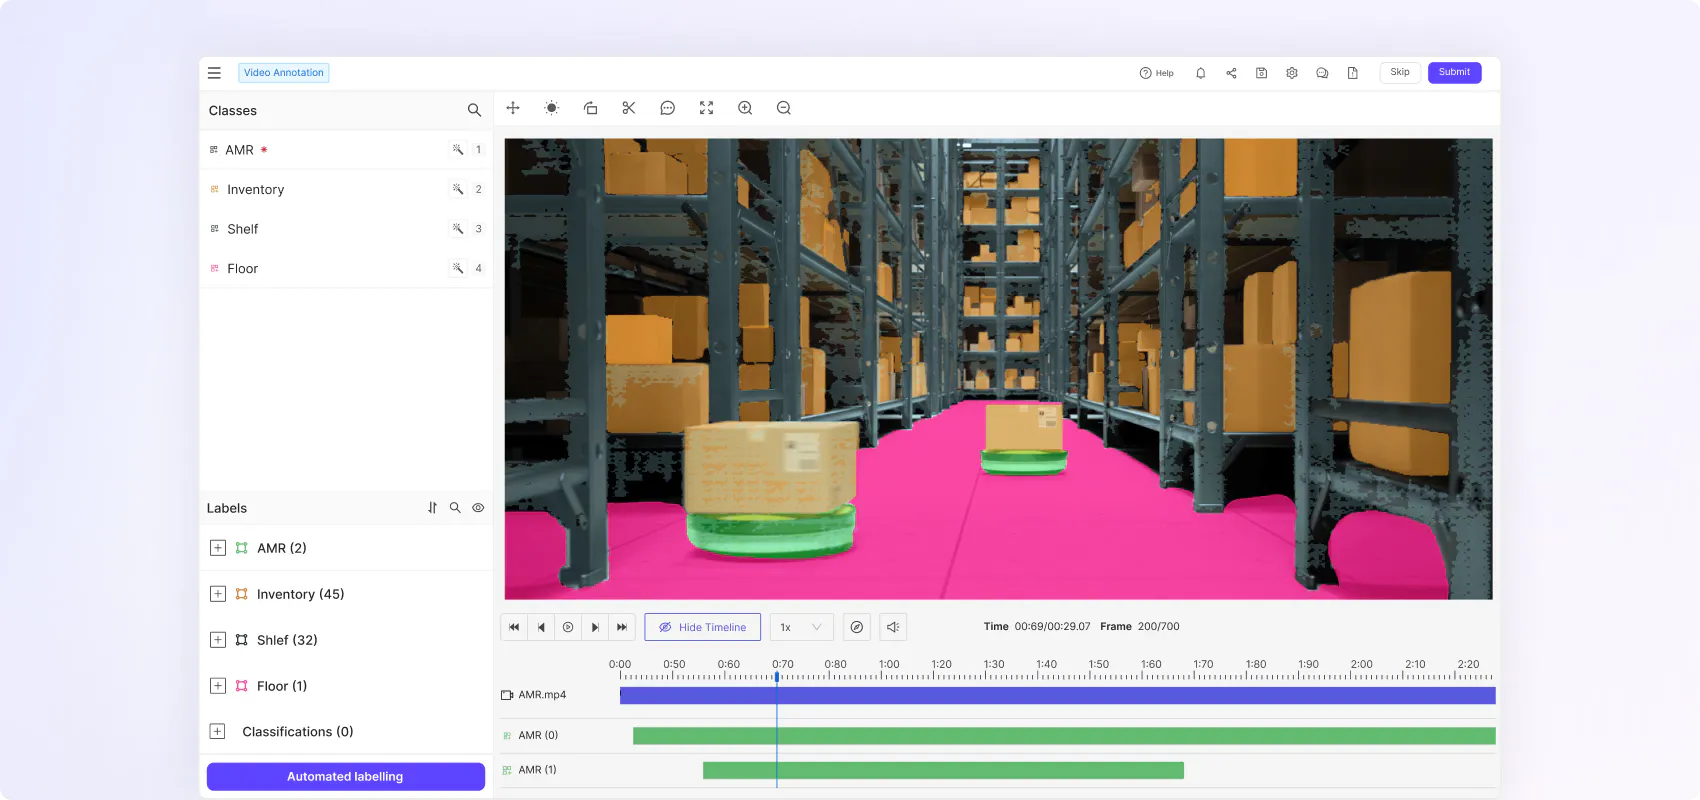
Improve label quality and speed with AI-assisted video labeling
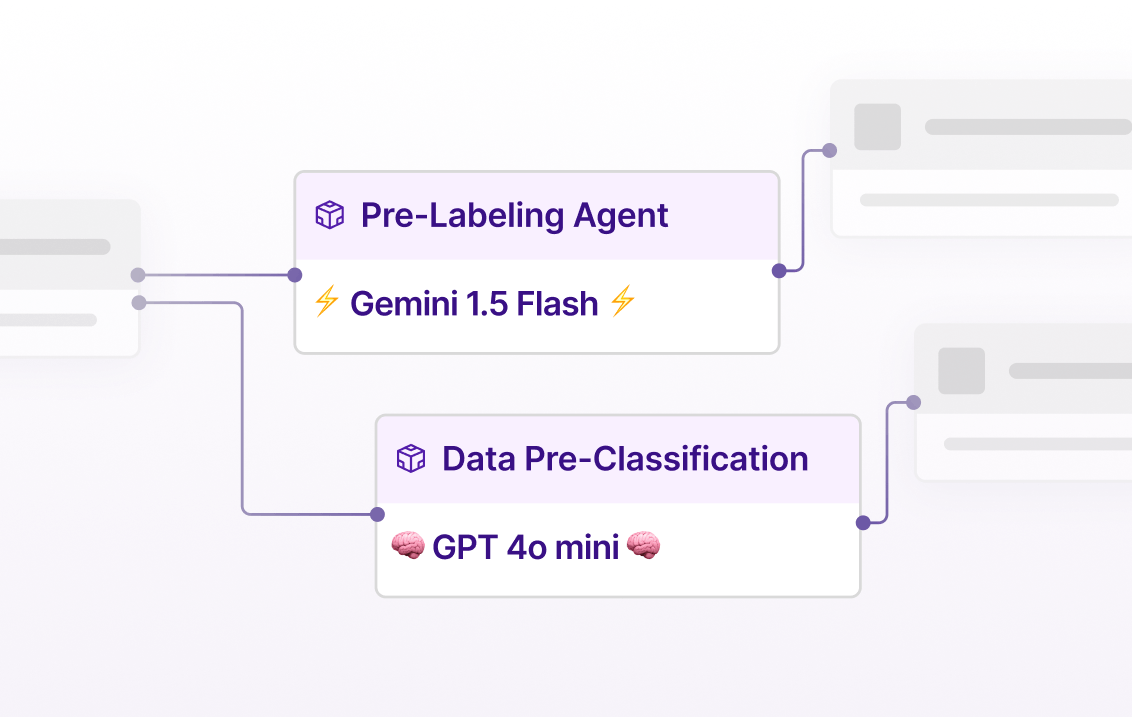
Customizable workflows for AI-assisted labeling
Integrate SOTA models or your own models directly into your data workflows to automate any data action such as reviews, pre-labeling, data classification, filtering and more.
Video native AI-assisted labeling with SAM 3
Access SAM 3 natively within Encord for model-assisted labeling to achieve faster and more accurate mask prediction and object tracking.
Instantly manage and curate millions of video files and frames
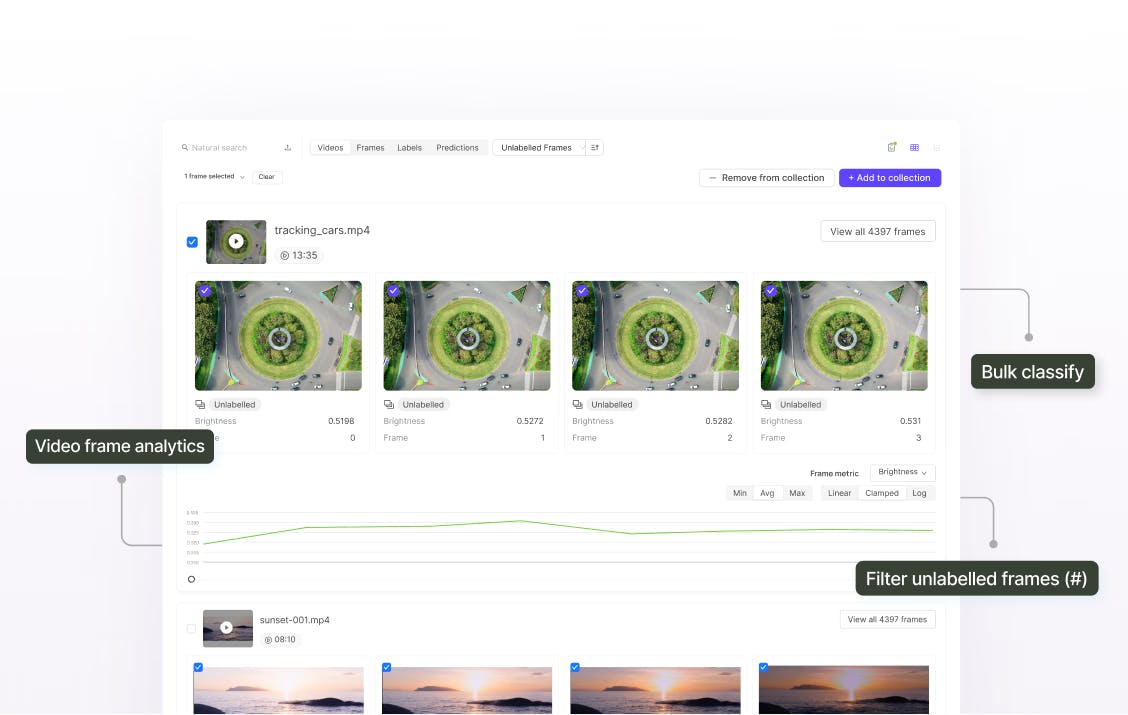
Manage millions of video files with ease
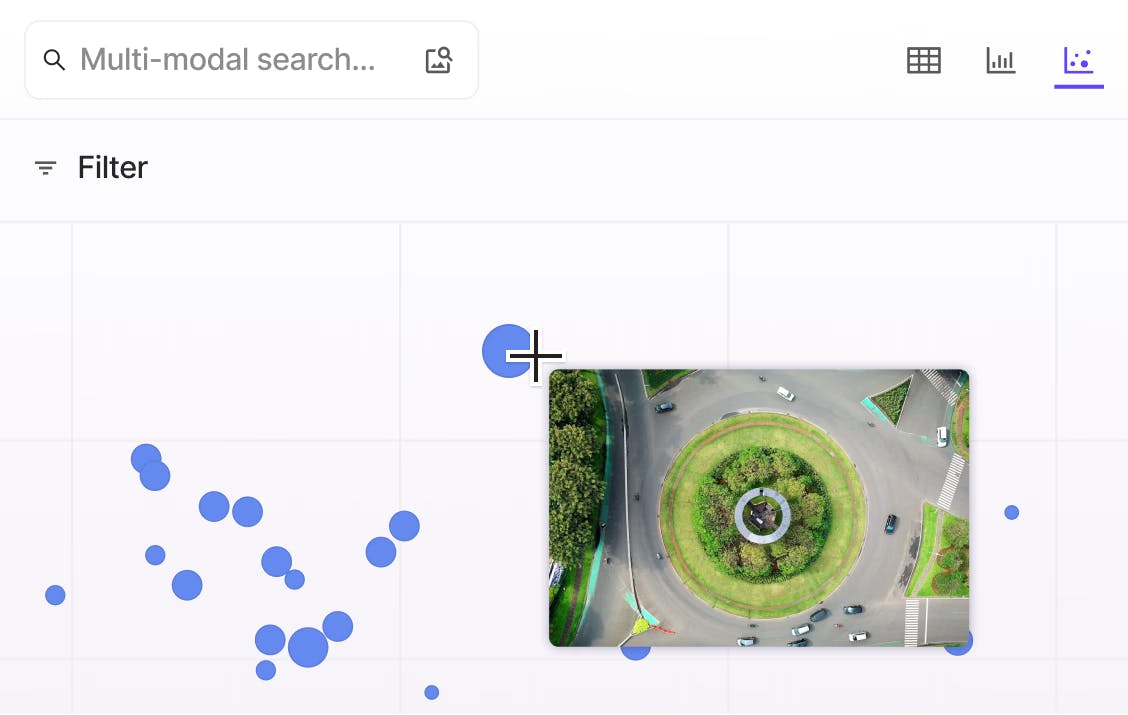
Explore and curate billions of video frames at scale with granular filtering, sort and search using quality metrics, custom metadata, and natural language queries.
Curate video files using quality metrics
Explore videos temporally by embeddings-based quality metrics to find the most valuable data for labeling and create diverse training datasets.
Testimonial
Supporting leading AI teams

We now have an integrated, one-stop solution where we can manage our data and also understand our model performance to create feedback mechanisms to improve data and models.

Encord’s DICOM annotation tool captures the shape of the pathology, interpolating the label on the slices the annotators skipped. In a case with 100 slices, annotators only have to label about 30 images.

Encord made it very easy to centrally keep track of annotations, including who had made them and who had reviewed them. It also has this great interpolation tool which was especially useful.

It’s always about balancing speed and quality. A lot of platforms prioritize speed over quality or quality over speed. Encord speeds up annotation while still allowing for strong quality control.

Encord’s robust support system has been remarkable. Whenever questions or issues come up, they are always supportive and helpful. This ensures that our workflows remain uninterrupted.

We went through a bunch of vendors and one of the things that stood out about Encord was the video first support, which other vendors do not have.

Getting started with Encord and integrating it into our workflow was really fast. The thing that I find the most valuable is the flexibility of how we can integrate the Encord pipeline into our own pipeline.

Encord Index is a high-performance system for our AI data, enabling us to sort and search at any level of complexity.

Before using Encord, it was challenging to see all the data, projects, and annotations in one place. Now, with Encord I feel like we have a much clearer understanding of everything that's happening.
We now have an integrated, one-stop solution where we can manage our data and also understand our model performance to create feedback mechanisms to improve data and models.
Encord’s DICOM annotation tool captures the shape of the pathology, interpolating the label on the slices the annotators skipped. In a case with 100 slices, annotators only have to label about 30 images.
Encord made it very easy to centrally keep track of annotations, including who had made them and who had reviewed them. It also has this great interpolation tool which was especially useful.
It’s always about balancing speed and quality. A lot of platforms prioritize speed over quality or quality over speed. Encord speeds up annotation while still allowing for strong quality control.
Encord’s robust support system has been remarkable. Whenever questions or issues come up, they are always supportive and helpful. This ensures that our workflows remain uninterrupted.
We went through a bunch of vendors and one of the things that stood out about Encord was the video first support, which other vendors do not have.
Getting started with Encord and integrating it into our workflow was really fast. The thing that I find the most valuable is the flexibility of how we can integrate the Encord pipeline into our own pipeline.
Encord Index is a high-performance system for our AI data, enabling us to sort and search at any level of complexity.
Before using Encord, it was challenging to see all the data, projects, and annotations in one place. Now, with Encord I feel like we have a much clearer understanding of everything that's happening.

Integration
Integrate seamlessly
Connect your secure cloud storage, MLOps tools, and much more with dedicated integrations that slot seamlessly into your workflows.

Security
Built with security in mind
Encord is SOC2, HIPAA, and GDPR compliant with robust security and encryption standards.

API/SDK
Developer-friendly for easy access
Leverage our API/SDK to programatically access projects, datasets & labels within the platform via API.
Forget fragmented workflows, annotation tools, and Notebooks for building AI applications. Encord's Data Development platform accelerates every step of taking your model into production.
It’s an AI-assisted platform designed for high-quality video labeling. It accelerates precise annotations without frame rate errors, enabling faster training of production-ready models.
Encord uses native video rendering to preserve temporal context, prevent frame-splitting issues, and reduce storage usage by up to 80%, boosting both speed and data pipeline efficiency.
Encord supports multi-view annotation, object tracking, related objects, rotatable bounding boxes, semantic segmentation, panoptic segmentation, and audio annotation.
Yes. With native SAM 3 integration, you can achieve faster and more accurate mask prediction and object tracking. Workflows allow automation of reviews, pre-labeling, classification, and filtering.


