Mean Square Error (MSE)
Encord Computer Vision Glossary
In the fields of regression analysis and machine learning, the Mean Square Error (MSE) is a crucial metric for evaluating the performance of predictive models. It measures the average squared difference between the predicted and the actual target values within a dataset. The primary objective of the MSE is to assess the quality of a model's predictions by measuring how closely they align with the ground truth.
Mathematical Formula
The MSE is calculated using the following formula
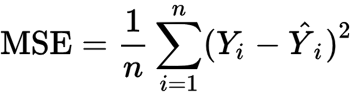
MSE = Mean Square error
n = Number of Data points
Yi = Observed Values
Y = Predicted Values
Interpretation
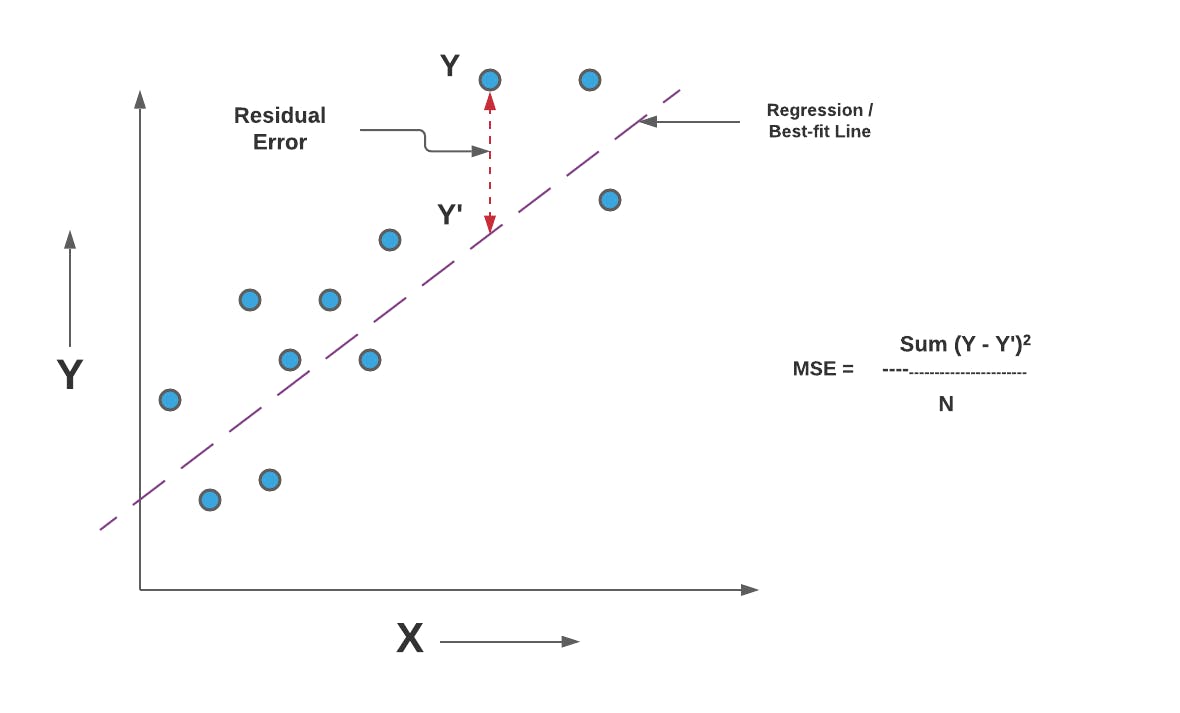
The MSE measures the average of the squared differences between predicted values and actual target values. By squaring the differences, the MSE places a higher weight on larger errors, making it sensitive to outliers. A lower MSE indicates that the model's predictions are closer to the true values, reflecting better overall performance.
Use Cases
MSE has widespread application in various scenarios:
- Regression Models: It is extensively used to evaluate the performance of regression models, including linear regression, polynomial regression, and more. The smaller the MSE, the better the model's predictive accuracy.
- Model Selection: In cases where multiple models are considered for a specific problem, the one with the lowest MSE is often preferred as it demonstrates better fitting to the data.
- Feature Selection: By comparing MSE values while including or excluding certain features, you can identify which features contribute significantly to prediction accuracy.
Limitations
While MSE is a valuable metric, it has certain limitations:
- Sensitivity to Outliers: MSE is sensitive to outliers due to the squaring of errors.This may cause extreme values to have a significant impact on the model.
- Scale Dependence: The magnitude of the MSE depends on the scale of the target variable. This can make it challenging to compare MSE values across different datasets.
Here is a simple Python code snippet to calculate and display the Mean Square Error using the scikit-learn library:
import numpy as np
from sklearn.metrics import mean_squared_error


# Simulated ground truth and predicted values
ground_truth = np.array([2.5, 3.7, 4.2, 5.0, 6.1])
predicted_values = np.array([2.2, 3.5, 4.0, 4.8, 5.8])

# Calculate Mean Square Error
mse = mean_squared_error(ground_truth, predicted_values)

print(f"Mean Square Error: {mse}")
Output: Mean Square Error: 0.06
In this code, the `mean_squared_error()` function from scikit-learn has been used to calculate the MSE between the ground truth and predicted values.