ROC Curve
Encord Computer Vision Glossary
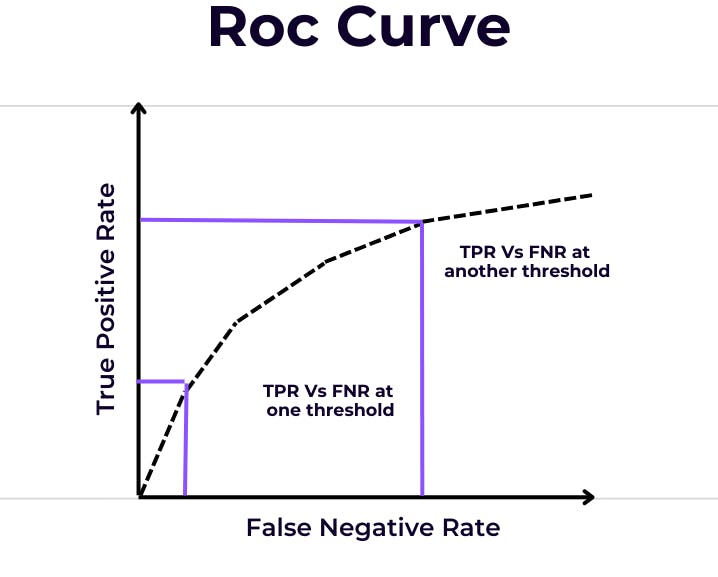
A ROC curve is a graphical representation of the performance of a binary classifier, showing the tradeoff between sensitivity and specificity. A binary classifier is a model that can predict one of two possible outcomes for a given input - for example, whether an email is spam or not, whether a credit card transaction is fraudulent or not, or whether a patient has a disease or not.

The ROC curve plots the true positive rate (TPR), also known as sensitivity or recall, on the y-axis, against the false positive rate (FPR) on the x-axis. The TPR is the proportion of positive cases that are correctly classified as positive, while the FPR is the proportion of negative cases that are incorrectly classified as positive. The ROC curve is created by varying the decision threshold of the classifier, which determines the point at which a positive prediction is made. By varying this threshold, the tradeoff between TPR and FPR can be visualized.
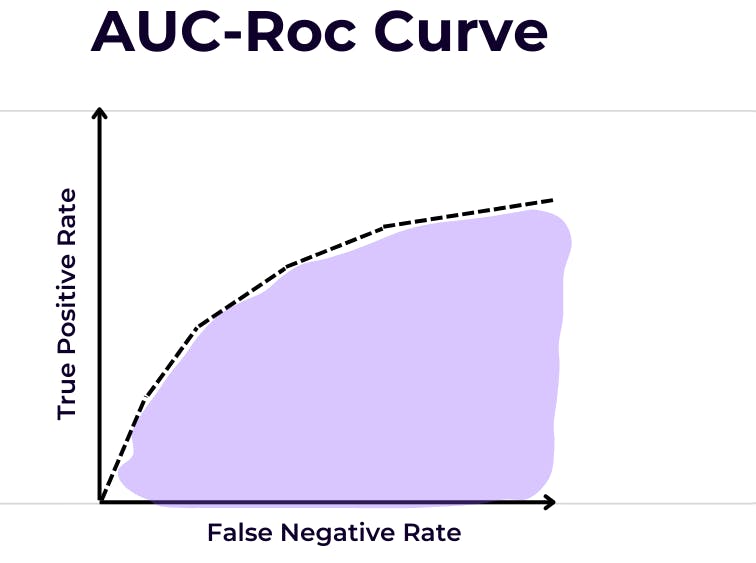
The ROC curve can be used to evaluate the performance of a binary classifier and compare different classifiers. A classifier that performs well will have a ROC curve that is closer to the top-left corner of the plot, indicating a higher TPR and a lower FPR. The area under the ROC curve (AUC-ROC) is a widely used metric for binary classification performance, with values ranging from 0.5 (random guessing) to 1.0 (perfect classification).
The ROC curve and AUC-ROC are used in many applications, including medical diagnosis, credit risk assessment, and spam filtering. In medical diagnosis, for example, the ROC curve can be used to evaluate the performance of a diagnostic test by plotting the sensitivity against the false positive rate for different thresholds. The optimal threshold can then be selected based on the desired balance between sensitivity and specificity.