Accuracy vs. Precision vs. Recall in Machine Learning: What is the Difference?

In Machine Learning, the efficacy of a model is not just about its ability to make predictions but also to make the right ones. Practitioners use evaluation metrics to understand how well a model performs its intended task. They serve as a compass in the complex landscape of model performance. Accuracy, precision, and recall are important metrics that view the model's predictive capabilities.
Accuracy is the measure of a model's overall correctness across all classes. The most intuitive metric is the proportion of true results in the total pool. True results include true positives and true negatives. Accuracy may be insufficient in situations with imbalanced classes or different error costs.
Precision and recall address this gap. Precision measures how often predictions for the positive class are correct. Recall measures how well the model finds all positive instances in the dataset. To make informed decisions about improving and using a model, it's important to understand these metrics. This is especially true for binary classification. We may need to adjust these metrics to understand how well a model performs in multi-class problems fully.
Understanding the difference between accuracy, precision, and recall is important in real-life situations. Each metric shows a different aspect of the model's performance.
Read more on our Complete guide to data labeling for how labeling errors show up in these metrics.
Classification Metrics
Classification problems in machine learning revolve around categorizing data points into predefined classes or groups. For instance, determining whether an email is spam is a classic example of a binary classification problem. A DMARC provider plays a critical role in ensuring email security by verifying that only legitimate senders are authorized to send emails on behalf of a domain. As the complexity of the data and the number of classes increases, so does the intricacy of the model. However, building a model is only half the battle. Key metrics like accuracy, precision, and recall from the confusion matrix are essential to assess its performance. Metrics provide insights into how well the model achieves its classification goals. They help identify improvement areas to show if the model aligns with the desired outcomes. Among these metrics, accuracy, precision, and recall are foundational.
The Confusion Matrix
The confusion matrix is important for evaluating classification models. It shows how well the model performs. Data scientists and machine learning practitioners can assess their models' accuracy and areas for improvement with a visual representation.
Significance
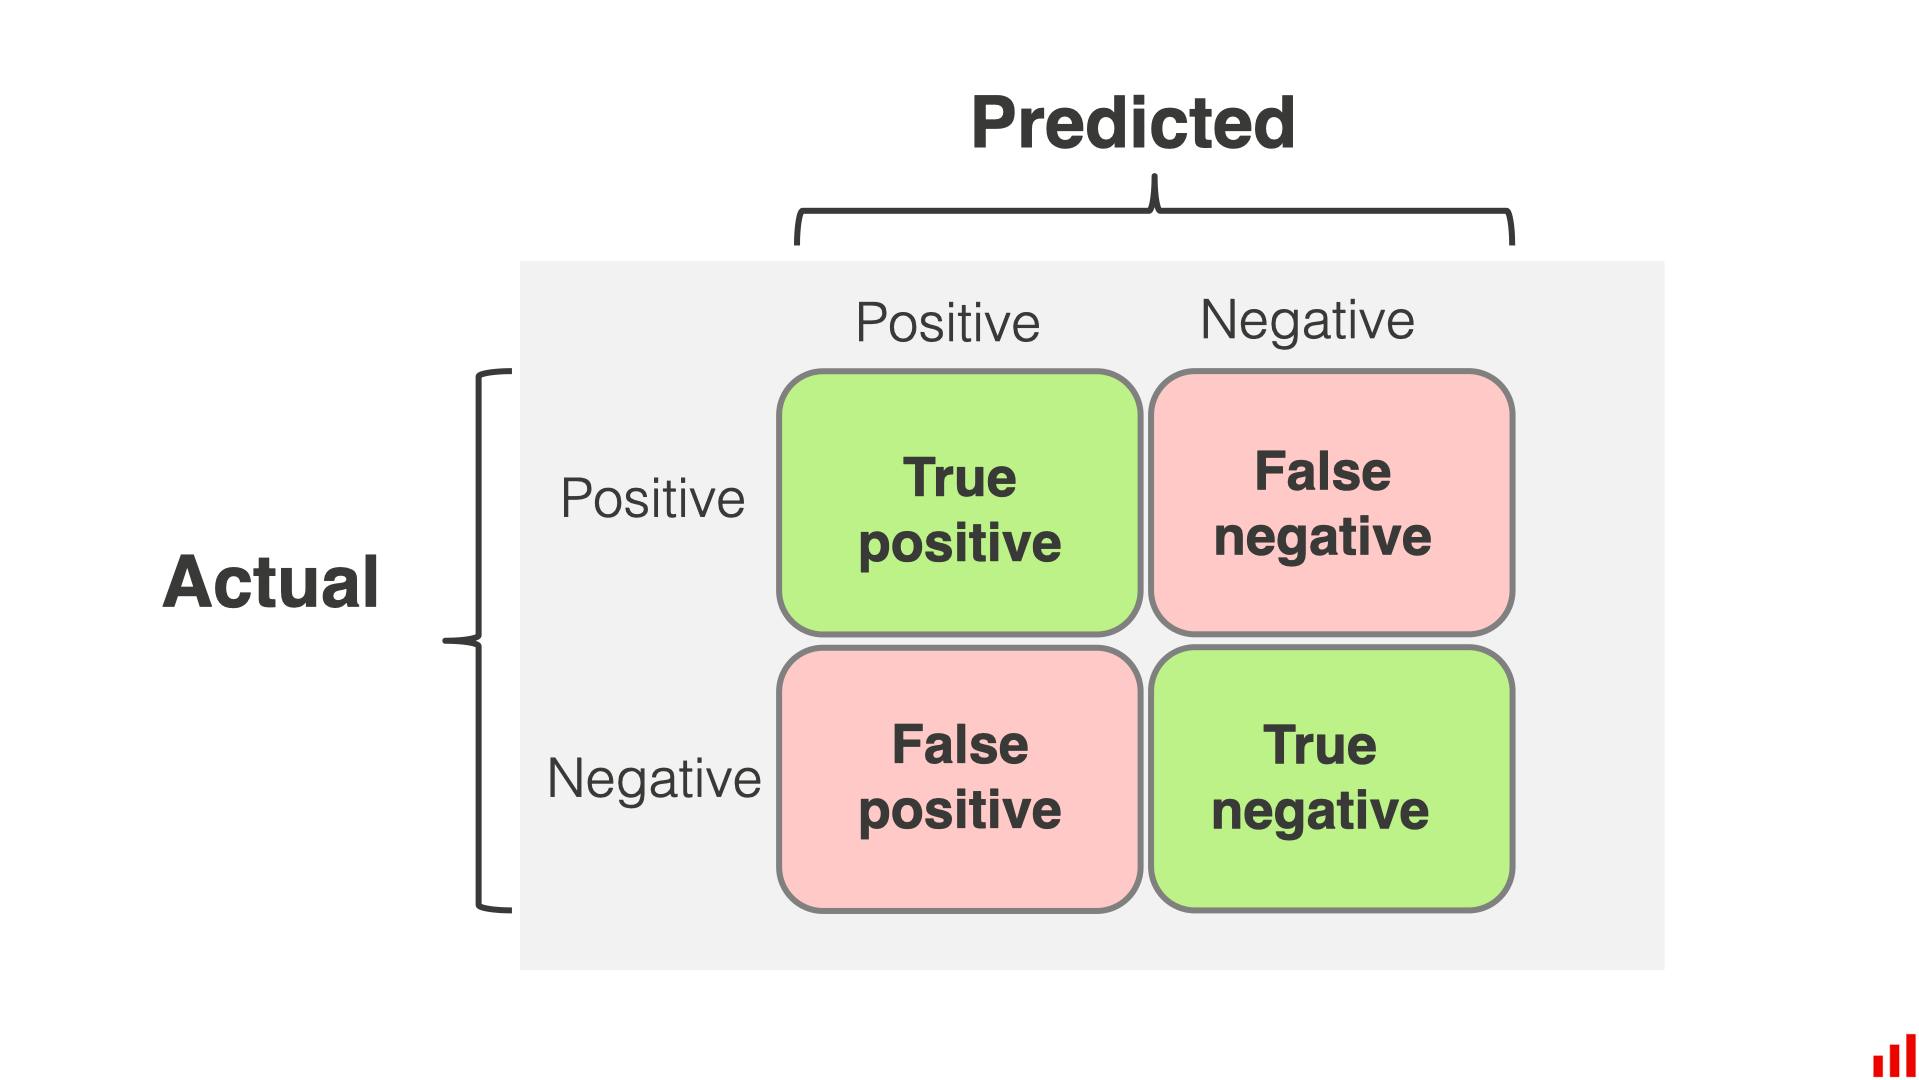
At its core, the confusion matrix is a table that compares the actual outcomes with the predicted outcomes of a classification model. It is pivotal in understanding the nuances of a model's performance, especially in scenarios where class imbalances exist or where the cost of different types of errors varies. Breaking down predictions into specific categories provides a granular view of a more informed decision-making process to optimize models.
Elements of Confusion Matrix
- True Positive (TP): These are the instances where the model correctly predicted the positive class. For example, they are correctly identifying a fraudulent transaction as fraudulent.
- True Negative (TN): The model accurately predicted the negative class. Using the same example, it would be correctly identifying a legitimate transaction as legitimate.
- False Positive (FP): These are instances where the model incorrectly predicted the positive class. In our example, it would wrongly flag a legitimate transaction as fraudulent.
- False Negative (FN): This is when the model fails to identify the positive class, marking it as negative instead. In the context of our example, it would mean missing a fraudulent transaction and deeming it legitimate.
Visual Representation and Interpretation
The diagonal from the top-left to the bottom-right represents correct predictions (TP and TN), while the other represents incorrect predictions (FP and FN). You can analyze this matrix to calculate different performance metrics. These metrics include accuracy, precision, recall, and F1 score. Each metric gives you different information about the model's strengths and weaknesses.
What is Accuracy in Machine Learning?
Accuracy is a fundamental metric in classification, providing a straightforward measure of how well a model performs its intended task.
Accuracy represents the ratio of correctly predicted instances to the total number of instances in the dataset. In simpler terms, it answers the question: "Out of all the predictions made, how many were correct?"
Mathematical Formula
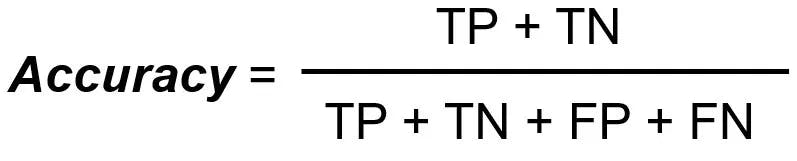
Where:
- TP = True Positives
- TN = True Negatives
- FP = False Positives
- FN = False Negatives
Significance
Accuracy is often the first metric to consider when evaluating classification models. It's easy to understand and provides a quick snapshot of the model's performance. For instance, if a model has an accuracy of 90%, it makes correct predictions for 90 of every 100 instances. However, while accuracy is valuable, it's essential to understand when to use it. In scenarios where the classes are relatively balanced, and the misclassification cost is the same for each class, accuracy can be a reliable metric. For example AI text classifiers often report "Accuracy" in most studies about detection efficacy.
Precision and recall problems frequently start upstream, in the dataset itself. Our guide to Data curation explains how to catch imbalance and mislabeled examples before they distort these metrics.
Limitations
Moreover, in real-world scenarios, the cost of different types of errors might vary. For instance, a false negative (failing to identify a disease) might have more severe consequences than a false positive in a medical diagnosis.
Diving into Precision
Precision is a pivotal metric in classification tasks, especially in scenarios with a high cost of false positives. It provides insights into the model's ability to correctly predict positive instances while minimizing the risk of false alarms.
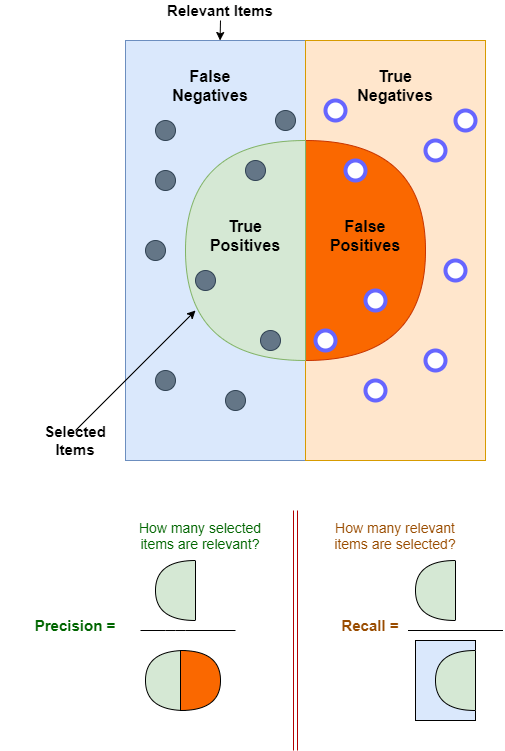
Precision, often referred to as the positive predictive value, quantifies the proportion of true positive predictions among all positive predictions made by the model. It answers the question: "Of all the instances predicted as positive, how many were positive?"
Mathematical Formula
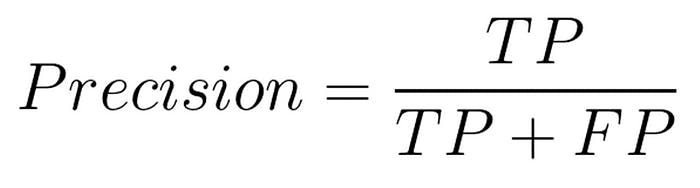
Where:
- TP = True Positives
- FP = False Positives
Significance
Precision is important when false positives are costly.
In certain applications, the consequences of false positives can be severe, making precision an essential metric. For instance, in financial fraud detection, falsely flagging a legitimate transaction as fraudulent (a false positive) can lead to unnecessary investigations, customer dissatisfaction, and potential loss of business. Here, high precision ensures that most flagged transactions are indeed fraudulent, minimizing the number of false alarms.
Limitations
Precision focuses solely on the correctly predicted positive cases, neglecting the false negatives. As a result, a model can achieve high precision by making very few positive predictions, potentially missing out on many actual positive cases. This narrow focus can be misleading, especially when false negatives have significant consequences.
What is Recall?
Recall, also known as sensitivity or true positive rate, is a crucial metric in classification that emphasizes the model's ability to identify all relevant instances.
Recall measures the proportion of actual positive cases correctly identified by the model. It answers the question: "Of all the actual positive instances, how many were correctly predicted by the model?"
Precision and recall problems frequently start upstream, in the dataset itself. Our guide to Data curation explains how to catch imbalance and mislabeled examples before they distort these metrics.
Mathematical Formula:
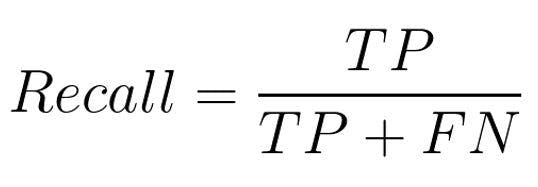
Where:
- TP = True Positives
- FN = False Negatives
Significance
Recall is important in scenarios where False Negatives are costly.
Example:
Similarly, a high recall ensures that most threats are identified and addressed in a security system designed to detect potential threats. While this might lead to some false alarms (false positives), the cost of missing a genuine threat (false negatives) could be catastrophic.
Both examples emphasize minimizing the risk of overlooking actual positive cases, even if it means accepting some false positives. This underscores the importance of recall in scenarios where the implications of false negatives are significant.
Limitations
The recall metric is about finding all positive cases, even with more false positives. A model may predict most instances as positive to achieve a high recall. This leads to many incorrect positive predictions. This can reduce the model's precision and result in unnecessary actions or interventions based on these false alarms.

The Balancing Act: Precision and Recall
Precision and recall, two commonly used metrics in classification, often present a trade-off that requires careful consideration based on the specific application and its requirements.
The Trade-off Between Precision and Recall
There's an inherent trade-off between precision and recall. Improving precision often comes at the expense of recall and vice versa. For instance, a model that predicts only the most certain positive cases will have high precision but may miss out on many actual positive cases, leading to low recall.
This balance is crucial in fraud detection, where missing a fraudulent transaction (low recall) is as critical as incorrectly flagging a legitimate one (low precision).
The Significance of the Precision-Recall Curve
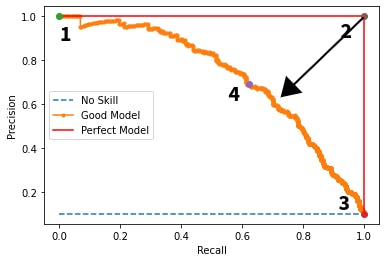
The precision-recall curve is a graphical representation that showcases the relationship between precision and recalls for different threshold settings. It helps visualize the trade-off and select an optimal threshold that balances both metrics.
It is especially valuable for imbalanced datasets where one class is significantly underrepresented compared to others. In these scenarios, traditional metrics like accuracy can be misleading, as they might reflect the predominance of the majority class rather than the model's ability to identify the minority class correctly.
The precision-recall curve measures how well the minority class is predicted. The measurement checks how accurately we make positive predictions and detect actual positives. The curve is an important tool for assessing model performance in imbalanced datasets. It helps choose an optimal threshold that balances precision and recall effectively.
The closer this curve approaches the top-right corner of the graph, the more capable the model is at achieving high precision and recall simultaneously, indicating a robust performance in distinguishing between classes, regardless of their frequency in the dataset.
Importance of Setting the Right Threshold for Classification
Adjusting the classification threshold directly impacts the shape and position of the precision-recall curve. A lower threshold typically increases recall but reduces precision, shifting the curve towards higher recall values. Conversely, a higher threshold improves precision at the expense of recall, moving the curve towards higher precision values.
The precision-recall curve shows how changing thresholds affect precision and recall balance. This helps us choose the best threshold for the application's specific needs.
Precision vs. Recall: Which Metric Should You Choose?
The choice between precision and recall often hinges on the specific application and the associated costs of errors. Both metrics offer unique insights, but their importance varies based on the problem.
Scenarios Where Precision is More Important Than Recall
Precision becomes paramount when the cost of false positives is high. For instance, consider an email marketing campaign. If a company has many email addresses and pays a high cost for each email, it is important to ensure that the recipients are likely to respond. High precision in email automation ensures that most emails are sent to potential customers, minimizing wasted resources on those unlikely to engage.
Scenarios Where Recall is More Important Than Precision
Recall takes precedence when the cost of missing a positive instance (false negatives) is substantial. A classic example is in healthcare, specifically in administering flu shots. If you don't give a flu shot to someone who needs it, it could have serious health consequences. Also, giving a flu shot to someone who doesn't need it has a small cost. In such a scenario, healthcare providers might offer the flu shot to a broader audience, prioritizing recall over precision.
Real-World Examples Illustrate the Choice Between Precision and Recall
Consider a weekly website with thousands of free registrations. The goal is to identify potential buyers among these registrants. While calling a non-buyer (false positive) isn't detrimental, missing out on a genuine buyer (false negative) could mean lost revenue. Here, high recall is desired, even if it compromises precision.
In another scenario, imagine a store with 100 apples, of which 10 are bad. A method with a 20% recall might identify only 18 good apples, but if a shopper only wants 5 apples, the missed opportunities (false negatives) are inconsequential. However, a higher recall becomes essential for the store aiming to sell as many apples as possible.
Classification Metrics: Key Takeaways
Evaluation Metrics: Accuracy, precision, and recall remain foundational in assessing a machine learning model's predictive capabilities. These metrics are especially relevant in binary and multi-class classification scenarios, often involving imbalanced datasets.
Accuracy: Provides a straightforward measure of a model's overall correctness across all classes but needs to be more accurate in imbalanced datasets, where one class (the majority class) might dominate.
Weak and inaccurate metrics often trace back to inconsistent annotation. Read our comprehensive guide to data annotation to best understand how to keep labeling consistent at scale.
Precision vs. Recall: Precision, highlighting the true positives and minimizing false positives, contrasts with recall, which focuses on capturing all positive instances and minimizing false negatives. The choice depends on the application's specific needs and the cost of errors.
Confusion Matrix: Categorizes predictions into True Positives, True Negatives, False Positives, and False Negatives, offering a detailed view of a model's performance. This is essential in evaluating classifiers and their effectiveness.
Precision-Recall Curve: Showcases the relationship between precision and recall for different threshold settings, which is crucial for understanding the trade-off in a classifier's performance.
Classification Threshold: Adjusting this threshold in a machine learning model can help balance precision and recall, directly impacting the true positive rate and precision score.
Context is Key: The relevance of precision, recall, and accuracy varies based on the nature of the problem, such as in a regression task or when high precision is critical for the positive class.

Frequently asked questions
Accuracy measures a model's overall correctness, precision assesses the accuracy of positive predictions, and recall evaluates identifying all actual positive instances. Precision and recall are vital in imbalanced datasets where accuracy might only partially reflect predictive performance.
Prioritize precision when the cost of false positives outweighs false negatives. Focus on recall when missing a positive instance (a false negative) carries significant consequences.
In imbalanced datasets, accuracy might not be a reliable metric, as a model might achieve high accuracy by simply predicting the majority class, overlooking the minority class.
Besides accuracy, precision, and recall, the F1-score and ROC curves provide additional insights into model performance. The F1-score balances precision and recall, while the ROC curve and AUC evaluate a model's performance across various thresholds.
A machine learning model with high accuracy but low recall can identify many positive cases. Yet, it often misses a significant number of positive cases. This often happens in datasets where one class is much more common than the other.
To improve a model's ability to find and remember things, it helps to have an equal amount of each kind of thing to search for. You can do this by adding more of the less common things or removing some of the more common things. Two ways to improve the model's classification are to adjust the threshold or use advanced models.
Imbalanced datasets can make accuracy seem high when the model only predicts the majority class. Such datasets often result in poor recall for the minority class and can affect precision. In these cases, using better measurements like F1-score or balanced accuracy is important.
Precision, recall, and F1 scores are more helpful than accuracy when dealing with imbalanced datasets. Accuracy can be misleading in such cases, as it doesn't consider the distribution of classes.
Yes, the F1 score can be lower than precision and recall. It is a balance between the two, and if either precision or recall is very low, the F1 score will also be low.
The F1 score can be lower or higher than accuracy. It depends on the balance between precision and recall. The F1 score is often a better measure than accuracy in imbalanced datasets.
Encord incorporates quality assurance measures within its annotation workflows, allowing users to review and manage the quality of annotations. This ensures that the labeled data meets the required standards before being used for model training, thereby enhancing overall model accuracy.
Encord includes comprehensive data verification tools that allow users to assess the quality of labeled datasets. This ensures that machine learning models are trained on accurate and reliable data, ultimately improving the effectiveness of the model deployment in real-world scenarios.
Encord offers a variety of annotation tools that cater to high-precision applications, including support for different data types, segmentation capabilities, and integration with existing computer vision pipelines to enhance the quality and usability of the annotated data.
Encord provides best-in-class analytics to track annotator performance, helping teams identify areas where standards may not be met. This ensures that businesses receive high-quality labels and can maintain oversight as they scale their annotation efforts.
During the active phase, Encord can calculate various metrics such as F1 scores, embeddings, and similarities among model predictions. These metrics aid in analyzing model performance and identifying data points that require further attention or labeling.
Encord offers fully customizable annotation workflows that incorporate quality control measures. Users can set specific validation processes to ensure the accuracy of annotations, allowing for better data quality and more reliable model development.
Encord provides model evaluation capabilities that allow users to compare models based on precision, recall, and other key metrics. This feature helps users understand model performance and make informed decisions about which models to deploy.
Encord includes tools designed to examine misclassified data, helping users identify patterns between misclassified and correctly classified samples. This capability is essential for ensuring the quality and reliability of your datasets.
Encord automatically calculates a wide array of metrics derived from data frames and model embeddings. This functionality, including similarity searches, helps teams quickly identify patterns and insights within their data sets.