Contents
Imbalance in Object Detection Computer Vision Models
Spatial Imbalance
Conclusion
Encord Blog
9 Ways to Balance Your Computer Vision Dataset

Machine learning engineers need to know whether their models are correctly predicting in order to assess the performance of the model. However, judging the model’s performance just on the model's accuracy score doesn’t always help in finding out the underlying issues because of the accuracy paradox. Accuracy paradox talks about the problem of just using the accuracy metric.
A model which is trained on an unbalanced dataset might report very accurate predictions during training. But this may actually merely be a reflection of how the model learned to predict.
Hence, when building your computer vision artificial intelligence model, you need to have a balanced dataset to build a robust model. Imbalanced data results in a model that is biased towards the classes that have more representation. This can result in poor performance on the underrepresented classes.
Imbalance in Object Detection Computer Vision Models
An image contains several input variables, such as various objects, the size of the foreground and background, the participation of various tasks (like classification and regression in machine learning models), etc. Problems with imbalance emerge when these properties are not uniformly distributed.
Tools like Encord Index address these challenges through effective data curation: it organizes datasets for balanced representation, ensures data quality through validation tools, and allows customization of workflows to handle imbalance issues.
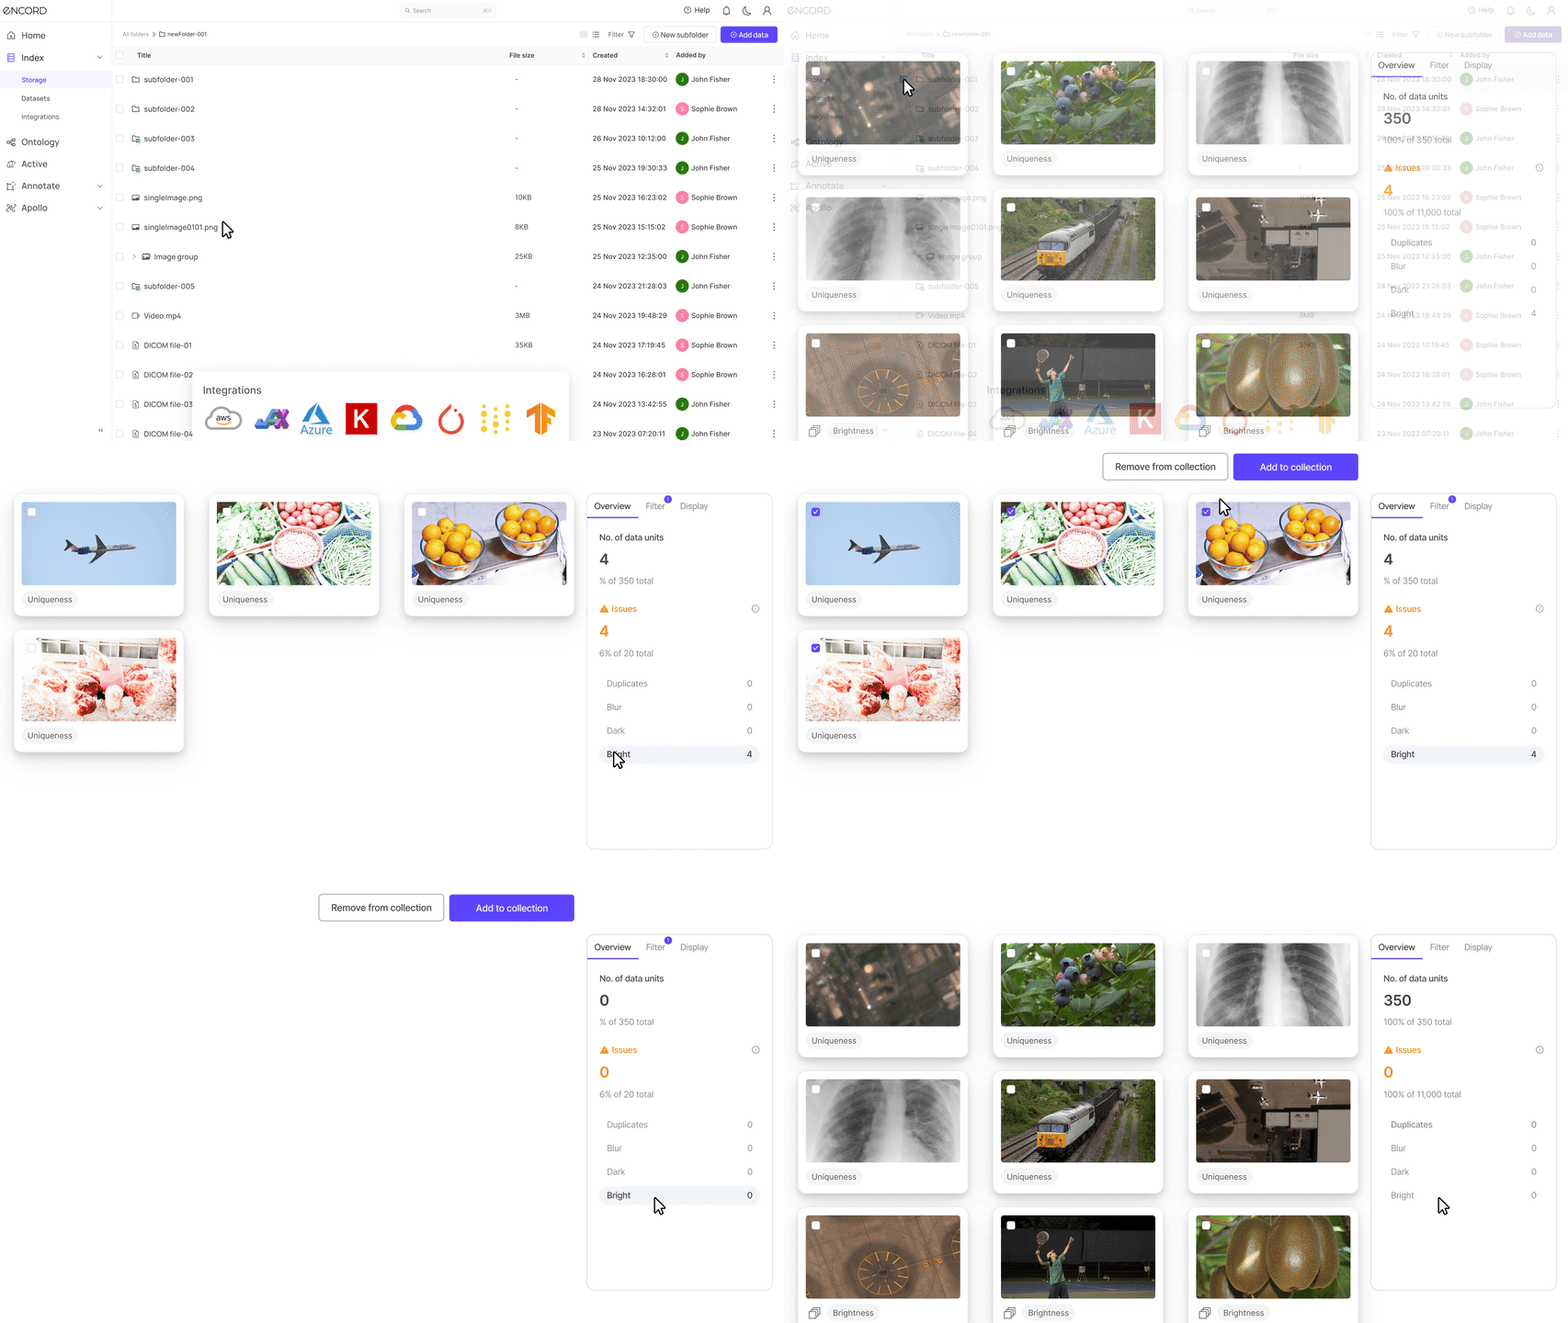
Let’s understand how these imbalances occur and how they can be solved.
Class Imbalance
Class imbalance, as the name suggests, is observed when the classes are not represented in the dataset uniformly, i.e., one class has more examples than others in the dataset. From the perspective of object detection, class imbalance can be divided into two categories: foreground-foreground imbalance and foreground-background imbalance.
There are tools available to visualize your labeled data. Tools like Encord Active have features which show the data distribution using different metrics which makes it easier to identify the type of class imbalance in the dataset.

MS-COCO dataset loaded on Encord Active
The two kinds of class imbalances have different characteristics and have been addressed using different approaches. However, some approaches like generative modeling might be used for both types of problems.
Types of Class Imbalance
Foreground-Background Class Imbalance
In this case, the background classes are over-represented and the foreground classes are under-represented. This can be a problem while training your computer vision model, as the model may become biased towards the majority class, leading to poor performance on the minority class. Foreground-background imbalance issue occurs during training and does not depend on the number of samples per class in the dataset; the background is not often annotated.
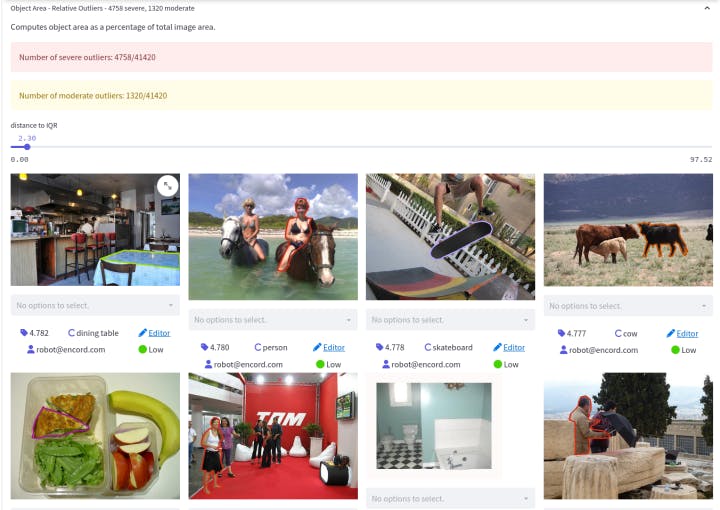
Encord Active showing the object area outliers in the MS COCO dataset.
Foreground-Foreground Class Imbalance
In this case, the over-represented and the under-represented classes are both foreground classes. Objects in general exist in different quantities, which naturally can be seen in a real-world dataset. For this reason, overfitting of your model to the over-represented classes may be inevitable for naive approaches on such a dataset.
How to Solve Class Imbalance
There are three major methods to handle class imbalance. Let’s have a look at what they are and how you can add it to your computer vision project dataset.
Hard Sampling Method
Hard sampling is a commonly used method for addressing class imbalance in object detection. By choosing a subset of the available set of labeled bounding boxes, it corrects the imbalance. Heuristic approaches are used to make the selection. Such approaches will ignore the non-selected objects. As a result, each sampled bounding box will contribute equally to the loss, and the training for the current iteration will not be affected by the ignored samples. Let’s have a look at one such heuristic approach.
Random Sampling
Random sampling is a very straightforward hard sampling method. While training, a certain number of data from both under and over represented classes are selected. The rest of the unselected data is dropped during the current iteration of training.
There is an open-source library based on scikit-learn called Imbalanced-learn to deal with imbalance classes. Random sampling using PyTorch and OpenCV can also be used. Here is a Python code snippet to show how Imbalanced-learn library is used for random over and under-sampling.
from imblearn.under_sampling import RandomUnderSampler
from imblearn.over_sampling import RandomOverSampler

# Applies decision tree without fixing the class imbalance problem
def dummy_decision_tree():
    classify(x,y)

# Applying random oversampling to the decision tree
def over_sampler():
    R_o_sampler = RandomOverSampler()
    X, y = R_o_sampler.fit_resample(x, y)
    classify(x, y)

# Applying random under-sampling to the decision tree
def under_sampler():
    R_u_sampler = RandomUnderSampler()
    X, y = R_u_sampler.fit_resample(x, y)
    classify(x, y)
Soft Sampling Method
In soft sampling, we adjust the contribution of each sample by its relative importance to the training process. This stands in contrast to hard sampling where the contribution of each sample is binarized, i.e., either they contribute or don’t. So, in soft sampling no sample of data is discarded.
One of the ways soft sampling can be used in your computer vision model is by implementing focal loss. Focal loss dynamically assigns a “hardness-weight” to every object to pay more attention to harder cases. In turn, it reduces the influence of easy examples on the loss function, resulting in more attention being paid to hard examples.
Generative Methods
Unlike sampling-based and sample-free methods, generative methods address imbalance by directly producing and injecting artificial samples into the training dataset. Since the loss values of these networks are directly based on the classification accuracy of the generated examples in the final detection, generative adversarial networks (GANs) are typically utilized in this situation because they can adjust themselves to generate harder examples during the training.
Adversarial-Fast-RCNN is an example of a GAN (generative adversarial network) used for class imbalance. In this method, the generative manipulation is directly performed at the feature-level, by taking the fixed size feature maps after RoI standardization layers (i.e., RoI pooling). This is done using two networks which are placed sequentially in the network design:
- Adversarial spatial dropout network for occluded feature map generation - creates occlusion in the images
- Adversarial spatial transformer network for deformed (transformed) feature map generation - rotates the channels to create harder examples
The GAN used in Adversarial-Fast-RCNN is trained to generate synthetic examples that are similar to the real samples of the minority class by introducing occlusion and deformation. This helps the model to learn to recognize a wider range of variations of the minority class objects and hence generalize better.

Occluded areas in the image introduced by adversarial spatial dropout network
Official implementation of the paper in Caffee can be found here. It is intuitive and allows you to introduce generative methods to solve your class imbalance problem.
Spatial Imbalance
In object detection, spatial properties of the bounding boxes define the properties of the object of interest in the image data. The spatial aspects include Intersection over Union (IoU), shape, size and location. Imbalance in these attributes surely affect the training and generalization performance. For instance, if a proper loss function is not used, a small change in location could cause substantial changes in the regression (localization) loss, leading to an imbalance in the loss values.
Types of Spatial Imbalance
There are different attributes of bounding boxes which affect the training process:
Imbalance in Regression Loss
The bounding boxes of objects in an image are typically tightened using regression loss in an object detection algorithm. Regression loss can drastically alter in response to even little changes in the predicted bounding box and ground truth positions. There, it is crucial to pick a regression model with a stable loss function that can withstand this kind of imbalance.
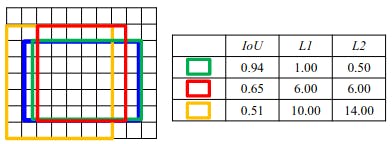
In the above illustration one can see that the contribution of the yellow box to the L2 loss is more dominating than its effect on the total L1 loss. Also, the contribution of the green box is less for the L2 error.
IoU Distribution Imbalance
When the IoU distribution in the input bounding boxes is skewed, an imbalance in the distribution is seen.
For example, in the figure below we can see the IoU distribution of the anchors in RetinaNet.
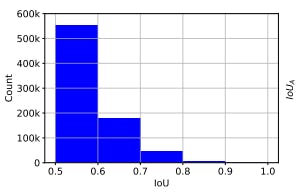
The IoU distribution of the positive anchors for a converged RetinaNet on MS COCO before regression
As one can see the anchors in the above image are skewed towards lower IoUs. This kind of imbalance is also observed while training two-staged object detectors. By observing the effect of regressor on the IoUs of the input bounding boxes, one can see that there is room for improvement.
Object Location Imbalance
In the real-world applications, deep learning models for object detection use sliding window classifiers. These classifiers use densely sampled anchors where the distribution of the objects within the image is important. The majority of the methods uniformly distribute the anchors throughout the image, giving each component of the image the same level of importance. On the other hand, there is an imbalance regarding object positions because the objects in an image do not follow a uniform distribution.

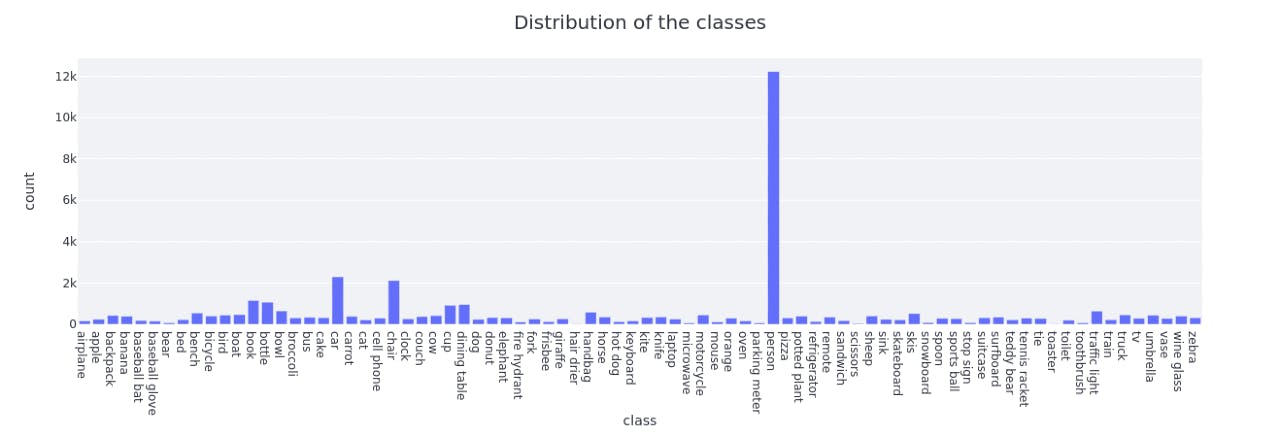
Encord Active can show the annotation closeness to image borders.Here you can see the distribution of each class.
How to Solve Spatial Imbalance
As we saw above, spatial imbalance has subcategories where each imbalance is caused by different spatial aspects of an image. Hence, the solutions are specific to each spatial aspect. Let’s discuss the solutions:
Solving Imbalance in Regression Loss
A stable loss function for your object detection model is essential to stabilize the regression loss. The regression losses for object detection have evolved under two main streams: Lp-norm based loss function and IoU-based loss functions. Understanding of loss function and how they affect the bounding box regression task is crucial in choosing the right loss function.
null
| Loss Function | How they affect the bounding box regression task |
|---|---|
|
L2 Loss |
Stable for small errors but penalizes outliers heavily |
|
L1 Loss |
Not stable for small errors |
|
Smooth L1 Loss |
Baseline regression loss function. More robust to outliers compared to L1 Loss |
|
Balanced L1 Loss |
Increases the contribution of the inliers compared to smooth L1 loss |
|
Kullnack-Leibler Loss |
Predicts a confidence about the input bounding box based on KL divergence |
|
IoU Loss |
Uses a indirect calculation of IoU as the loss function |
|
Bounded IoU Loss |
Fixes all parameters of an input box in the IoU definition except the one whose gradient is estimated during backpropagation |
|
GIoU Loss |
GIoU is created by extending the definition of IoU depending on the inputs' smallest enclosing rectangle. IoU is then used directly as the loss function. |
|
DIoU Loss, CIoU Loss |
Adds more penalty terms related to aspect ratio differences and center distances between two boxes to the definition of IoU. |
Solving Imbalance in IoU Distribution
Convolutional neural networks are commonly used to solve the IoU distribution Imbalance. Some of the networks used are:
Cascade R-CNN
Cascade R-CNN uses three detectors in cascaded pipeline with different IoU thresholds.Instead of sampling the boxes from the previous step anew, each detector in the cascade uses them. This approach demonstrates that the distribution's skewness may be changed from being left-skewed to being nearly uniform or even right-skewed, giving the model enough samples to be trained with the ideal IoU threshold.
Two implementations of cascade R-CNN are available in Caffe and as a Detectron.
Hierarchical Shot Detector
The Hierarchical Shot Detector runs its classifier after the boxes are regressed, producing a more even distribution, as opposed to utilizing a classifier and regressor at distinct cascade levels. This results in a more balanced IoU distribution.
The implementation of the code is available in PyTorch and can be found on GitHub here.
IoU Uniform RCNN
This convolutional neural network adds variations in such a way that it provides approximately uniform positive input bounding boxes to the regressor only. It directly generates training samples with uniform IoU distribution for the regression branch as well as the IoU prediction branch.
The code implementation of this can be found here.
Conclusion
Data imbalance can be a major problem in computer vision dataset, as it can lead to biased or inaccurate models. Analyzing and understanding the distribution of the dataset before building the object detection model is crucial to find out about the imbalances in the dataset and solving them.
The imbalances mentioned here are not all inclusive of the imbalances one sees in the real-world dataset but can be a starting point to solve your major imbalance issues. It is more convenient to use tools which are built to visualize your data and edit the annotations to build a robust dataset in one go.
Tools like Encord Active allow you to visualize the outliers in your dataset, saving you time to go through your data to find any kind of imbalances. It has built in metrics for data quality and label-quality to analyze your data distribution. You can either choose to implement algorithms for different imbalances and its performance can be compared on the tool itself. You can also build a balanced dataset after visualization according to data distribution.
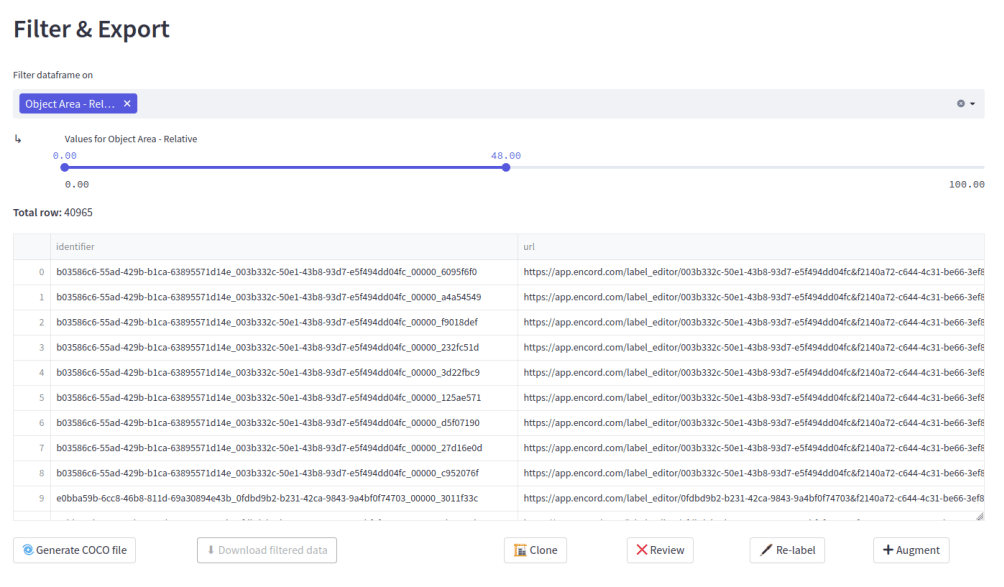
The filter and export feature of Encord Active allows you to filter out the samples that disturb the dataset distribution.

Explore the platform
Data infrastructure for multimodal AI
Explore product
Explore our products
Encord provides a data operations platform that streamlines the annotation process for various types of datasets, including biometric data. By optimizing resource allocation and employing efficient QA processes, Encord ensures that the right data is annotated effectively, helping to accelerate the deployment of models into production.
Encord offers best-in-class annotation tooling that is capable of handling multiple modalities, including images and videos. The platform allows for the assignment of organizational tasks and incorporates advanced features like pre-labeling, making the annotation process efficient and adaptable.
Encord offers specialized tools for annotating sports data, allowing users to focus on the intricate details of player movements and game dynamics. The platform supports high-resolution video uploads, enabling annotators to work with clarity and precision on critical aspects of the game.
Encord supports a wide array of data types including images, video, text, and LIDAR data. This versatility allows organizations across different industries to utilize the platform for their specific annotation needs, facilitating the development of robust machine learning models.
Encord excels in providing a comprehensive suite of data annotation tools tailored for computer vision tasks. This includes features for curation and efficient annotation workflows, allowing teams to maintain high-quality datasets for machine learning projects.
Encord offers robust annotation capabilities for both images and videos, allowing users to configure custom classes and attributes for each project. This flexibility helps streamline the annotation process, making it efficient and tailored to specific needs.
Encord offers advanced annotation capabilities, including the use of polygons to track and assess body movements in images. This feature is designed to support high frame rate data, allowing for detailed analysis.

