Exploring the TACO Dataset [Model Training]

Introduction
Imagine for a moment you are building an autonomous robot that can collect litter on the ground. As a machine learning engineer, you'll be responsible for giving it the power to detect trash in any environment.
It's a challenge, but with the right detection system, you'll be one step closer to a cleaner world and you’ll have built a cool artificial intelligence robot. After downloading an open-source trash dataset you realize that there are multiple challenges for your model and the performance is very poor even though you apply a state-of-the-art model.
That was where we left off in the first part of this data-centric AI case study series. In the previous post, we analyzed the TACO dataset and labels and found that there are many issues with the dataset.
In this second part of our the data-centric AI case study, we will start debugging our dataset and improving the performance of our model step-by-step.
TLDR;
Using a quality metric to calculate the Object Annotation Quality of polygon labels in the popular open-source TACO dataset we found label errors on ~5% of images. By fixing the label errors we improved the mAP for a state-of-the-art computer vision model by nearly 50% from the baseline for the class: Clear plastic bottle.

Why Data-Centric AI?
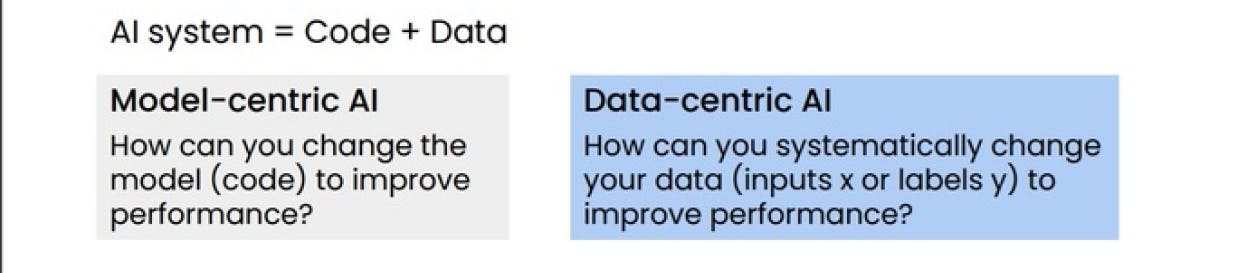
As machine learning engineers, it’s important to understand the different approaches to building AI models and the pros and cons of each. The data-centric approach emphasizes a static machine learning model and a focus on improving the underlying training data. A data-centric approach suggests a continuous focus on adding high-value training data in an interactive process to improve the overall model accuracy and performance.
On the other hand, a model-centric approach is based on a static dataset with a focus on developing and improving machine learning models and algorithms. This is often the approach taught in classrooms and used in cutting-edge research. In industry, however, the data-centric approach is more prevalent and it is what might drive the future of AI development and the maturation of fields such as MLOps and Active Learning.
As machine learning engineers and data scientists, it’s important that we consider the specific requirements and constraints of a problem, and choose the approach that best suits the task at hand. In some cases, a combination of both approaches can be used to achieve the best performance. Andrew Ng, whom you all know, is a pioneer in the field of machine learning, and we would go as far as call him the modern father of data-centric AI (at least he’s the most vocal fan). It’s worth studying his work to gain a deeper understanding of these approaches and how to apply them in practice. If you are interested check out DeepLearning.AI's different resources.
What did we learn last time?
Let’s first recap the challenges discovered in the TACO dataset in our first blog post:
- Class imbalance: The dataset contains a lot of classes (60) and we discovered a high class imbalance. A few classes had close to 0 labels (Aluminium blister pack 6, Battery 2, Carded blister pack 1).
- Similar object classes: Many of the object classes are semantically very similar.
- Small objects: The majority of the objects are very small e.g. cigarettes, cans, pop tabs.
- Low labeling quality: The label quality of the crowd-sourced dataset is a lot worse than the official dataset; therefore the labels should be reviewed.
We know many of you face these common challenges in your projects when improving your models. Let us formulate a problem statement and try to improve our model performance step-by-step.
Problem
We set out to improve the performance of a Mask RCNN model on the TACO dataset following a data-centric approach.
Since the TACO dataset contains 60 classes, we narrow our focus to one class for this tutorial (and to save some computing power). We ended up picking:
Clear plastic bottle: Water and soft drinking bottles made of PET.
Why?
Well, It is well represented in the dataset (626 annotations in 476 images), and we found that it is often confused with other objects such as Other plastic bottles and Drinking cans.
Furthermore, it is an interesting and useful use case, that could potentially be valuable in countries with deposit return systems (such as the Danish or Swedish system).
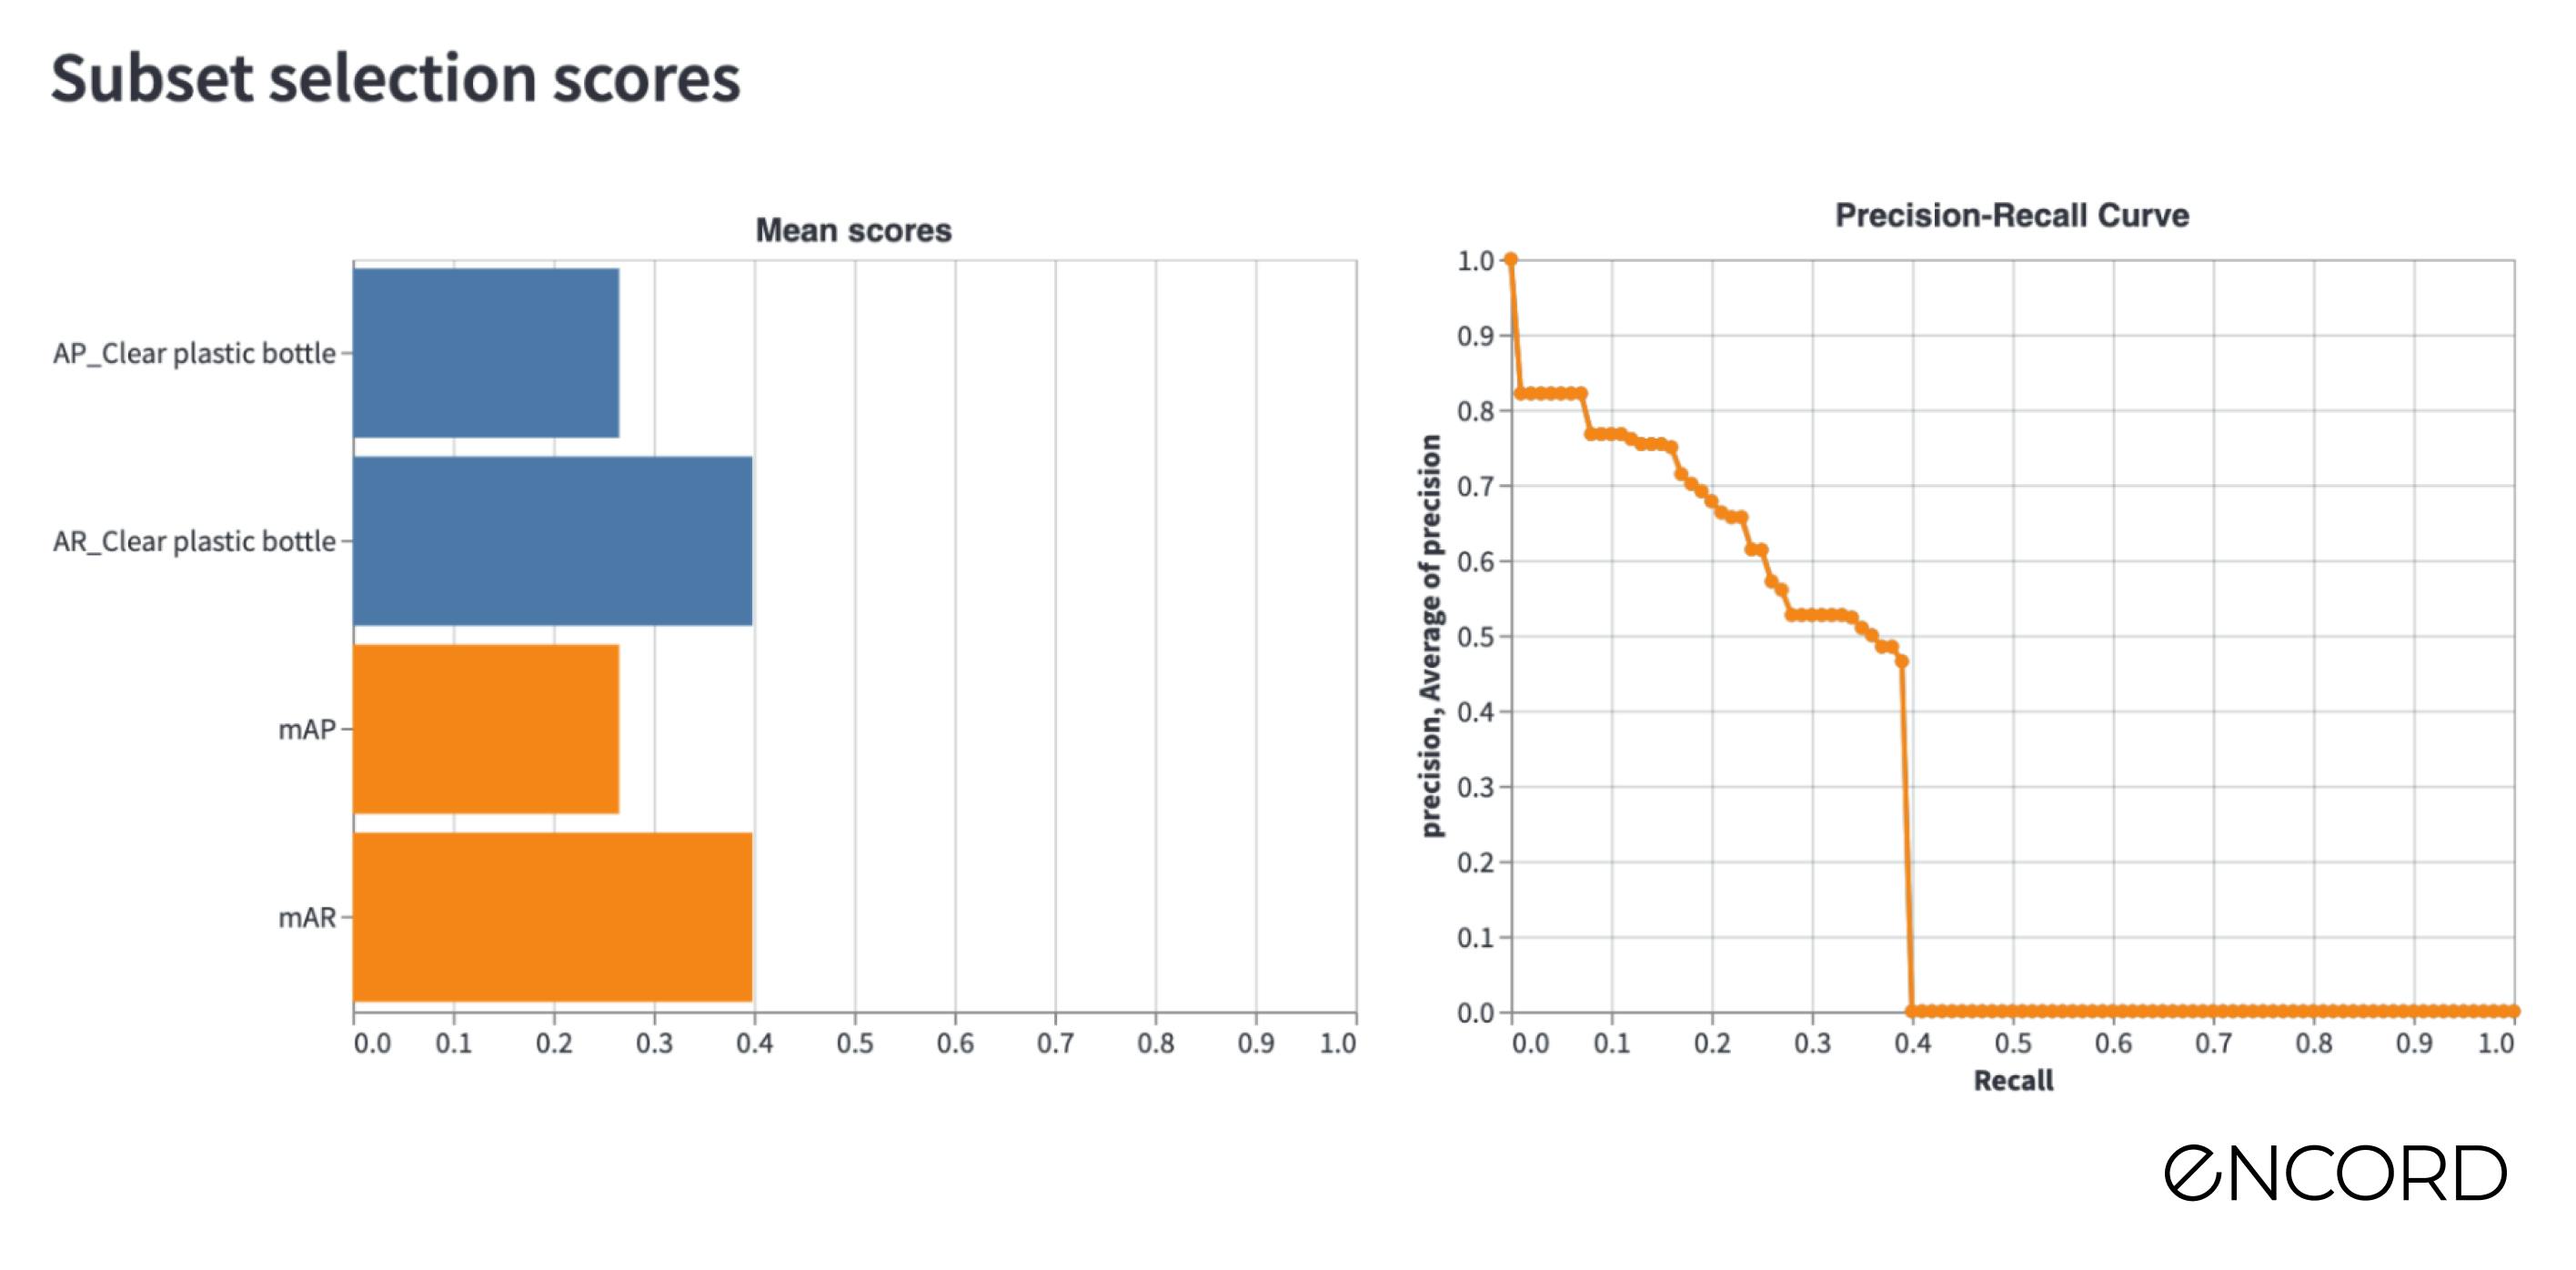
For simplicity we will measure the performance on three metrics: mAP, mAR, and our own Object Annotation Quality metric.
About the dataset
- Research Paper: TACO: Trash Annotations in Context for Litter Detection
- Author: Pedro F Proença, Pedro Simões
- Dataset Size: Official: 1500 images, 4784 annotations & Unofficial: 3736 images, 8419 annotations.
- Categories: 60 litter categories
- License: CC BY 4.0
- Release: 17 March 2020
- Read more: Github & Webpage
Methodology
To improve the machine learning model we set out to use various different strategies: (1) re-labeling bad samples, (2) fixing mislabeled classes, (3) labeling new samples, and (4) data augmentation.
For this tutorial, we will attempt strategies (1) and (2) and in the next tutorial we will try (3) and (4).
After each iteration, we will re-train the model with the same neural network architecture with the improved unofficial dataset to compare the model performance on the fixed official dataset.
Before we jump into it, let’s quickly cover the “Object Annotation Quality” metric:
What is the “Object Annotation Quality” Metric?
The “Object Annotation Quality” metric calculates the deviation of the class of a label among its nearest neighbors in an embedding space to identify which labels potentially contain errors.
Technically the metric transforms polygons into bounding boxes and an embedding for each bounding box is extracted. Then, these embeddings are compared with their neighbors. If the neighbors are annotated differently, a low score is given to it. You can find the technical implementation on the GitHub respository of Encord Active.
Great, let us begin.
1st Iteration: Fixing label errors
Analysis
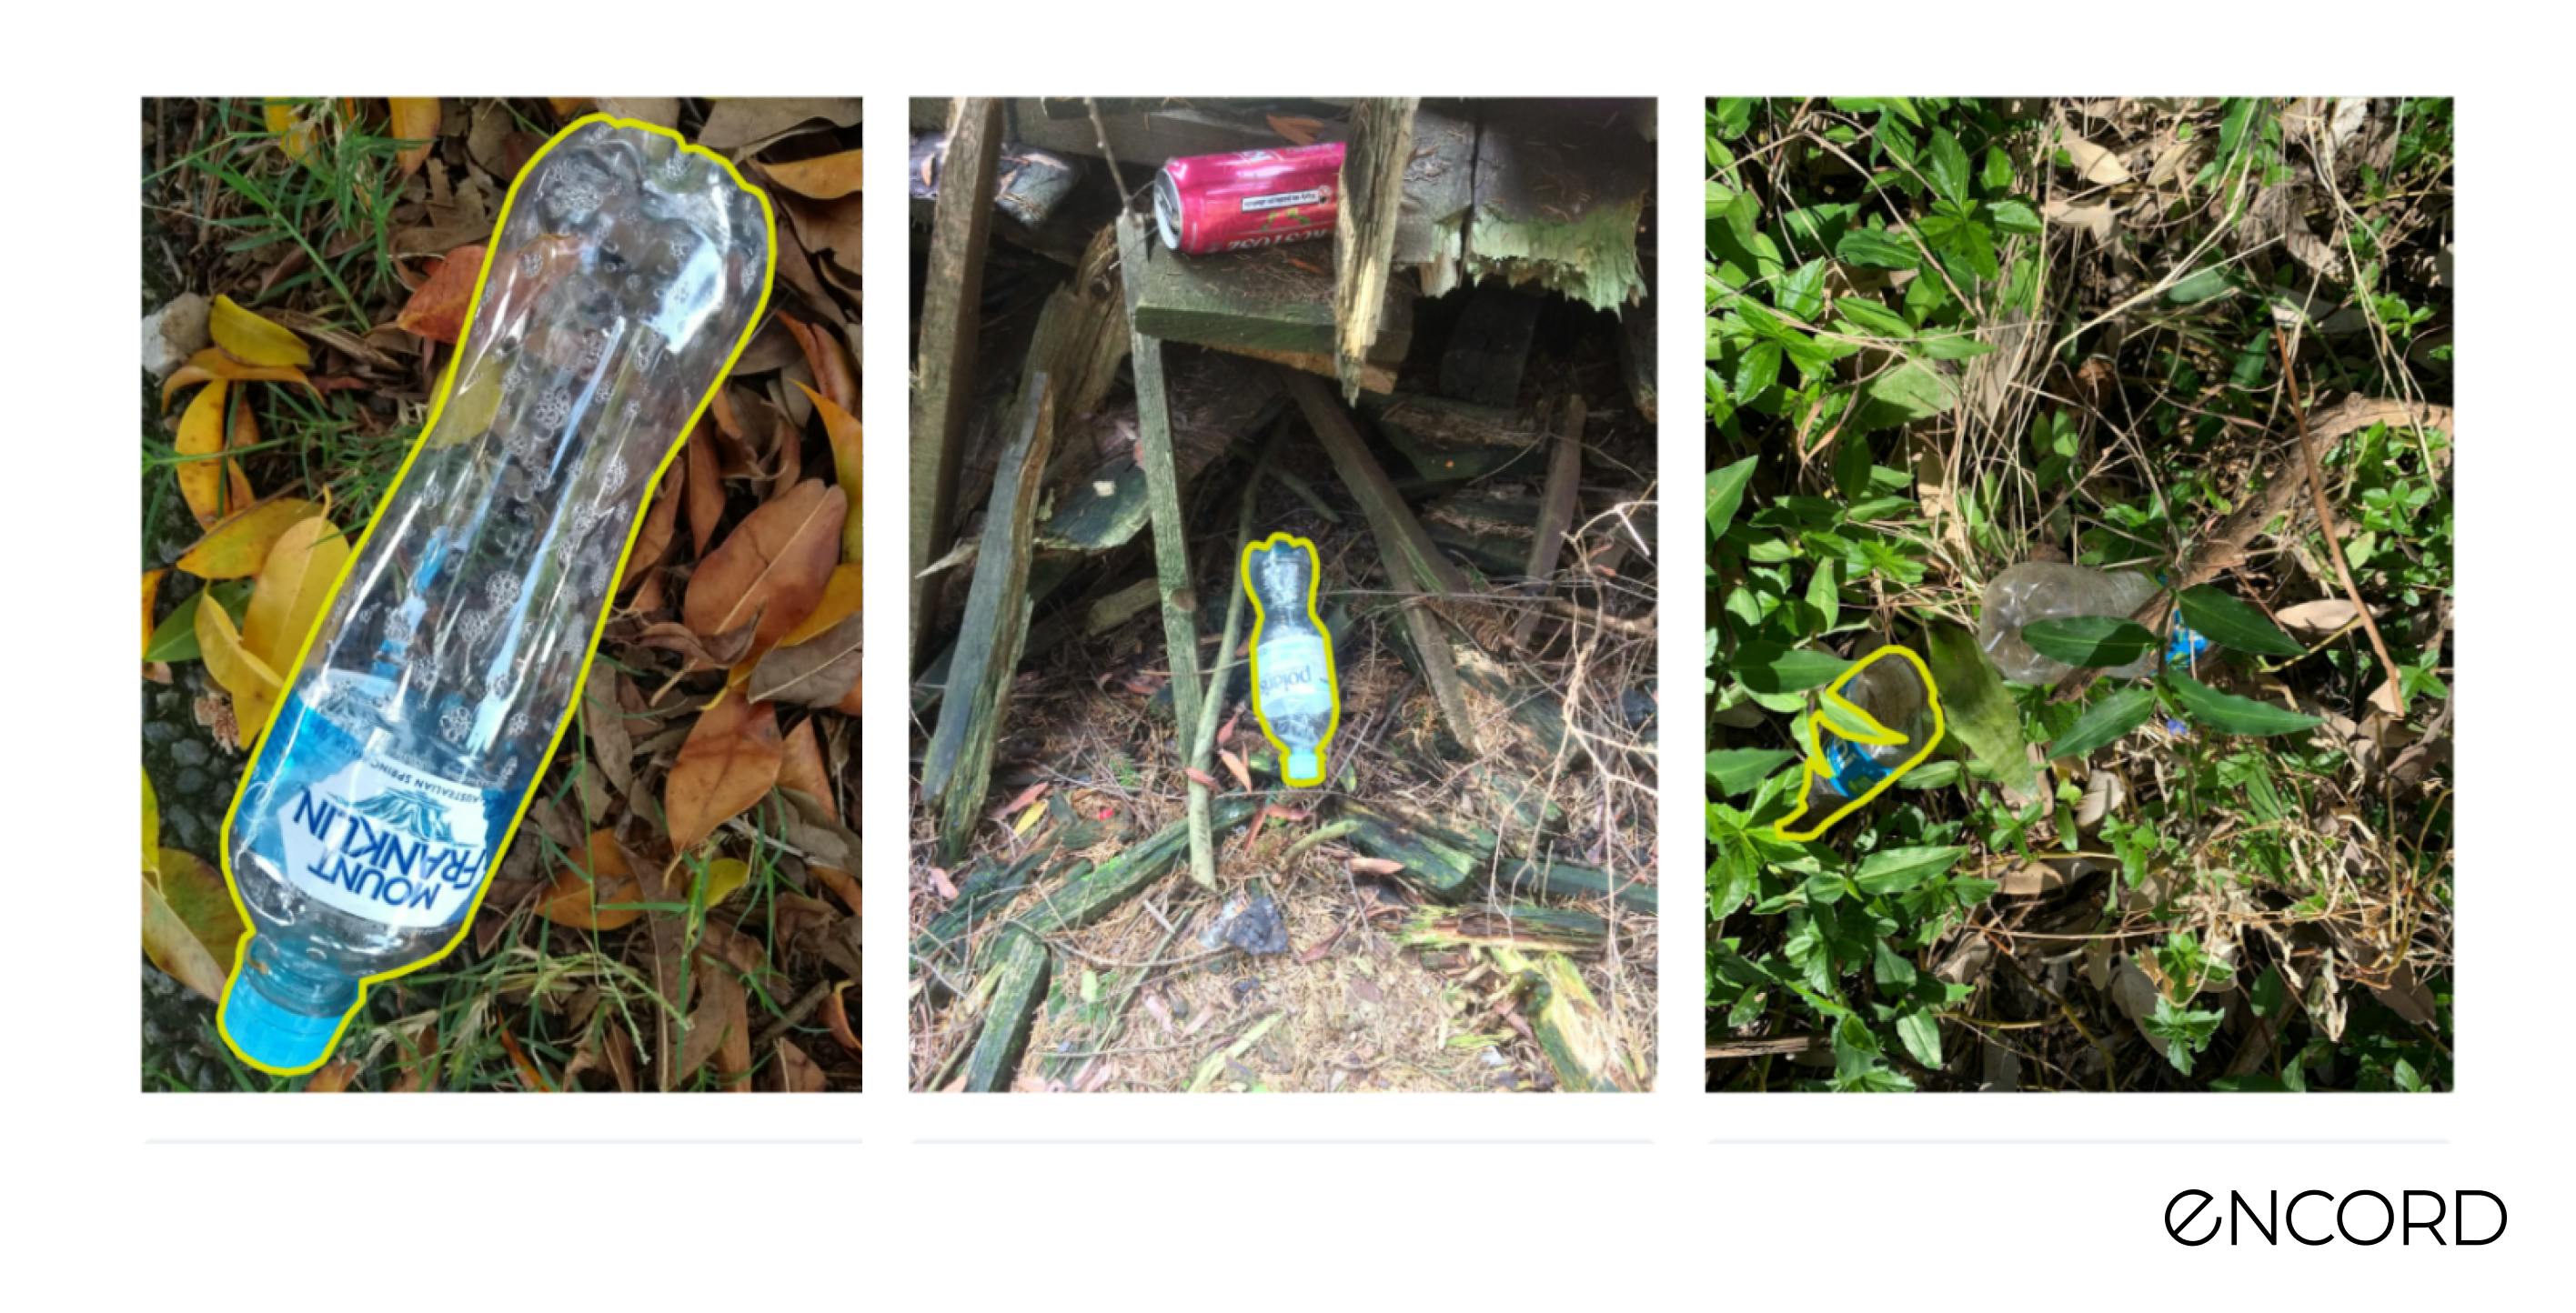
Using the Object Annotation Quality metric, we can see that the Clear plastic bottle class is confused with Other plastic bottle and sometimes even with the Drinking can class.
Tip: You can sort samples of an object class using the Label quality → Explore tab and select any quality metric. Simply choose the Object Annotation Quality metric metric and sort samples in descending order. This will show you the correctly labeled samples for that class first.
Let us visualize the three types of objects to get a sense of what they really represent:
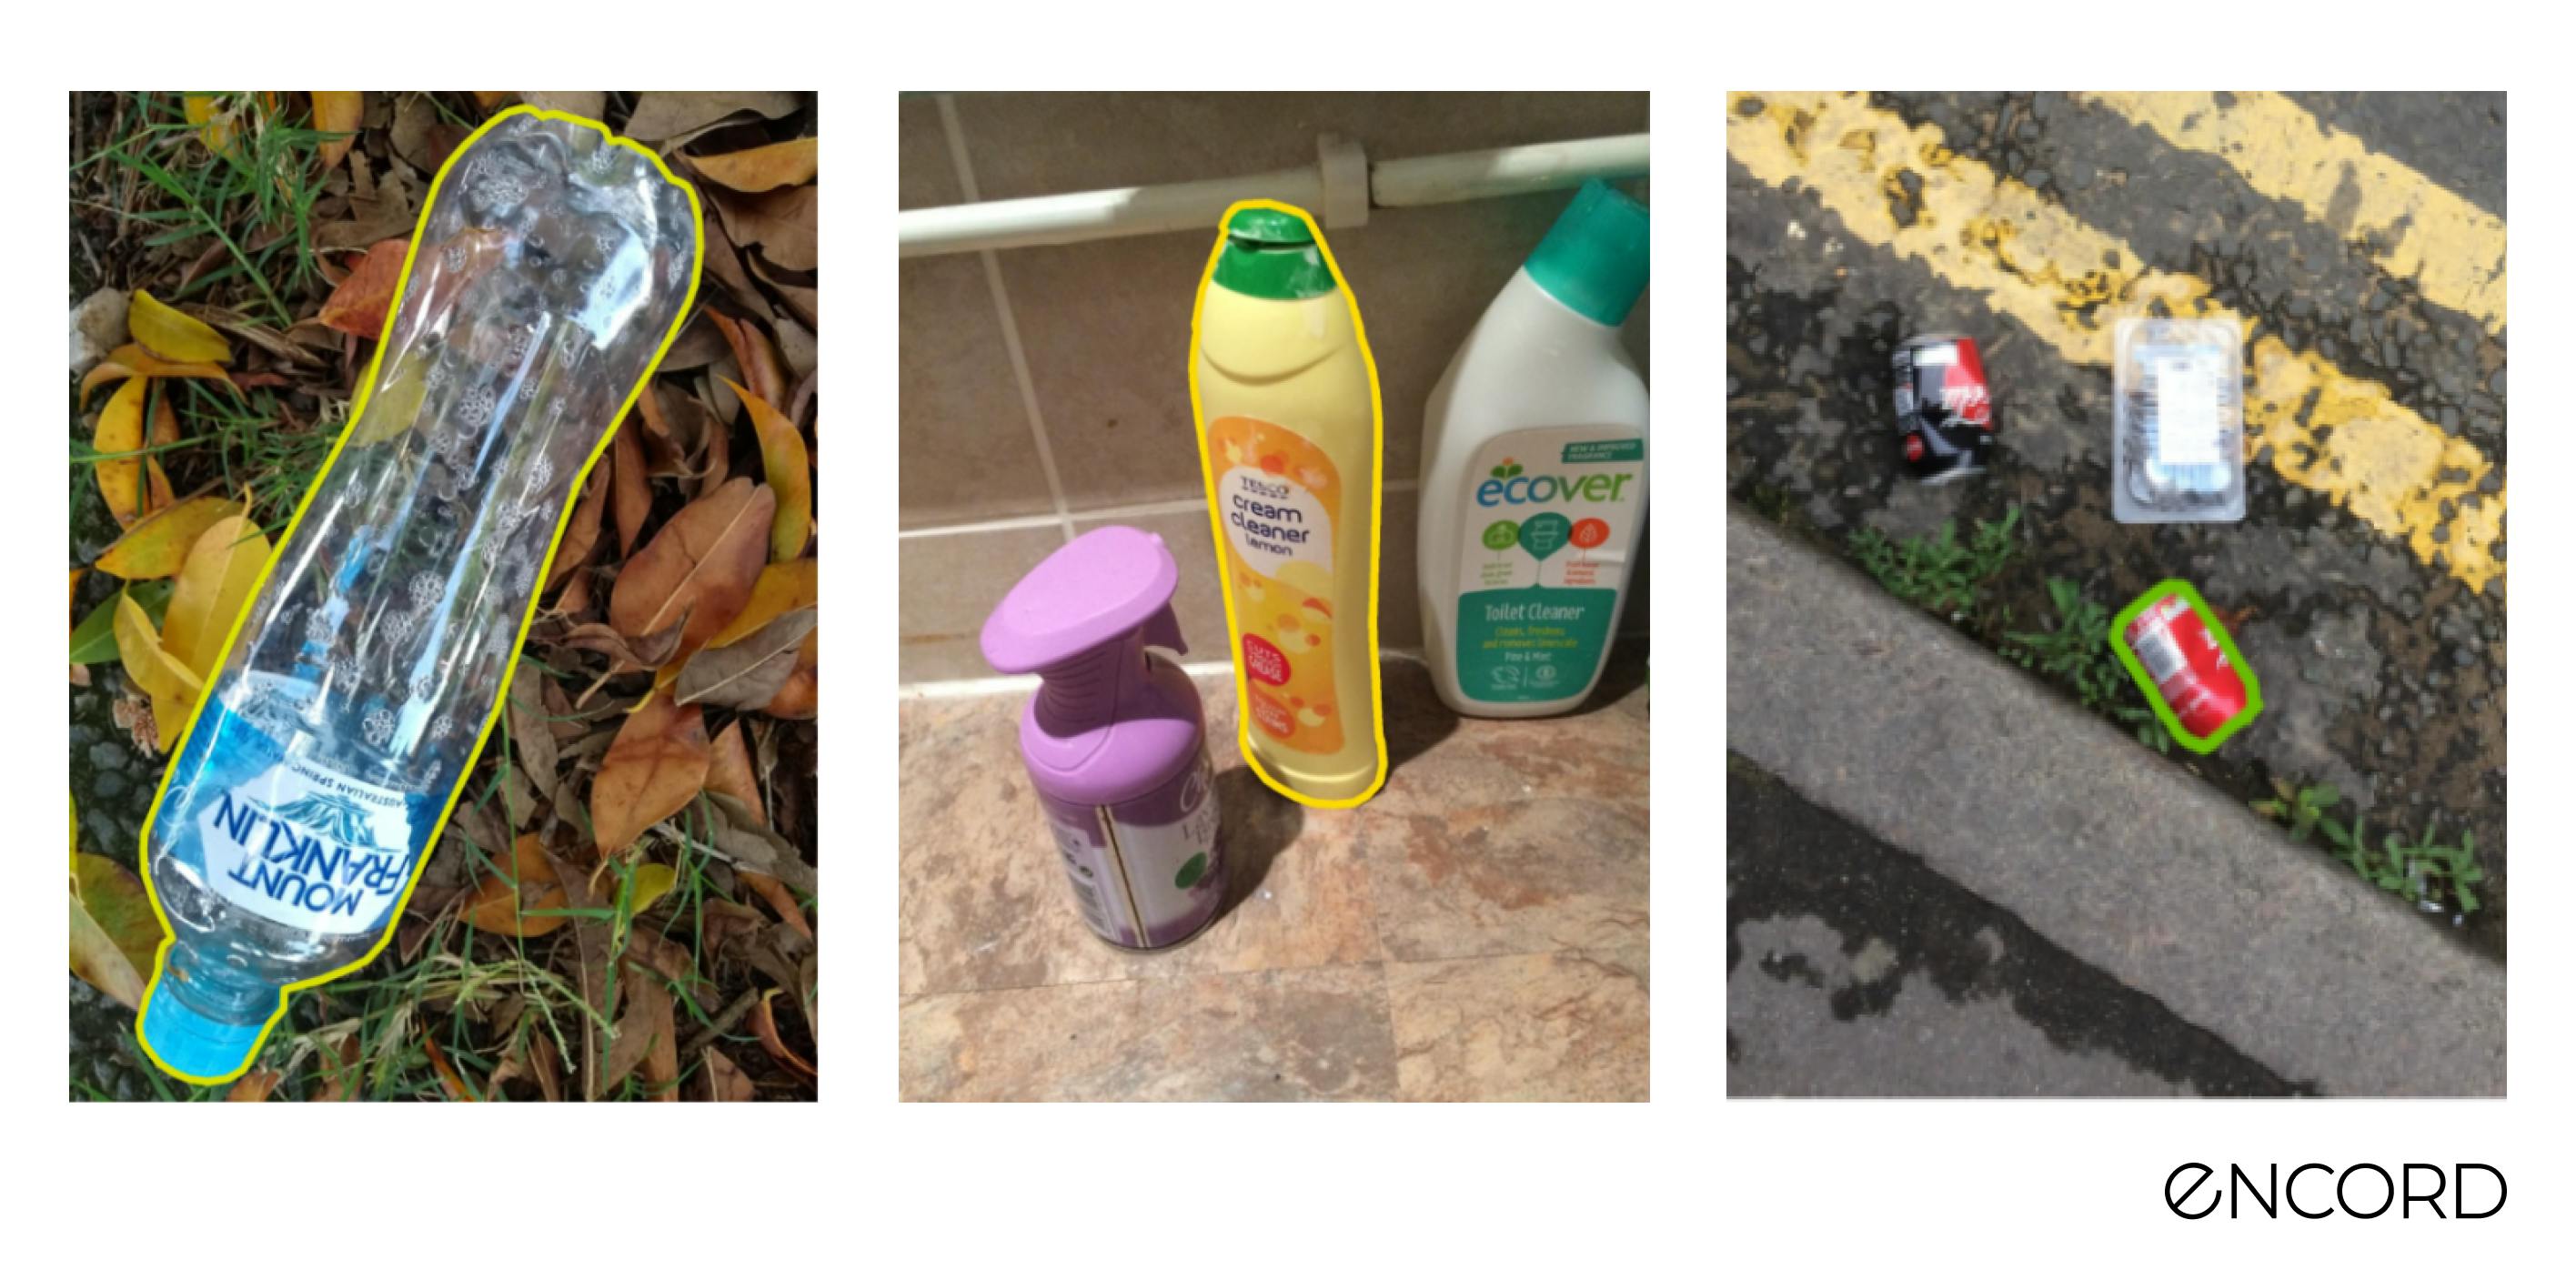
Fig: From left to right: 1) Clear plastic bottle: Water and soft drinking bottles made of PET. 2) Other plastic bottle: Opaque or translucent. Generally made of HDPE. Includes detergent bottles. 3) Drinking can: Aluminum soda can.
The similarity between them does not seem obvious: however, since these annotations are crowdsourced, the annotators might have different levels of context for this use case and the description of each class might cause confusion (given the fact that there are 60 labels classes).
Let’s dive into the Encord Active app and open the unofficial dataset.
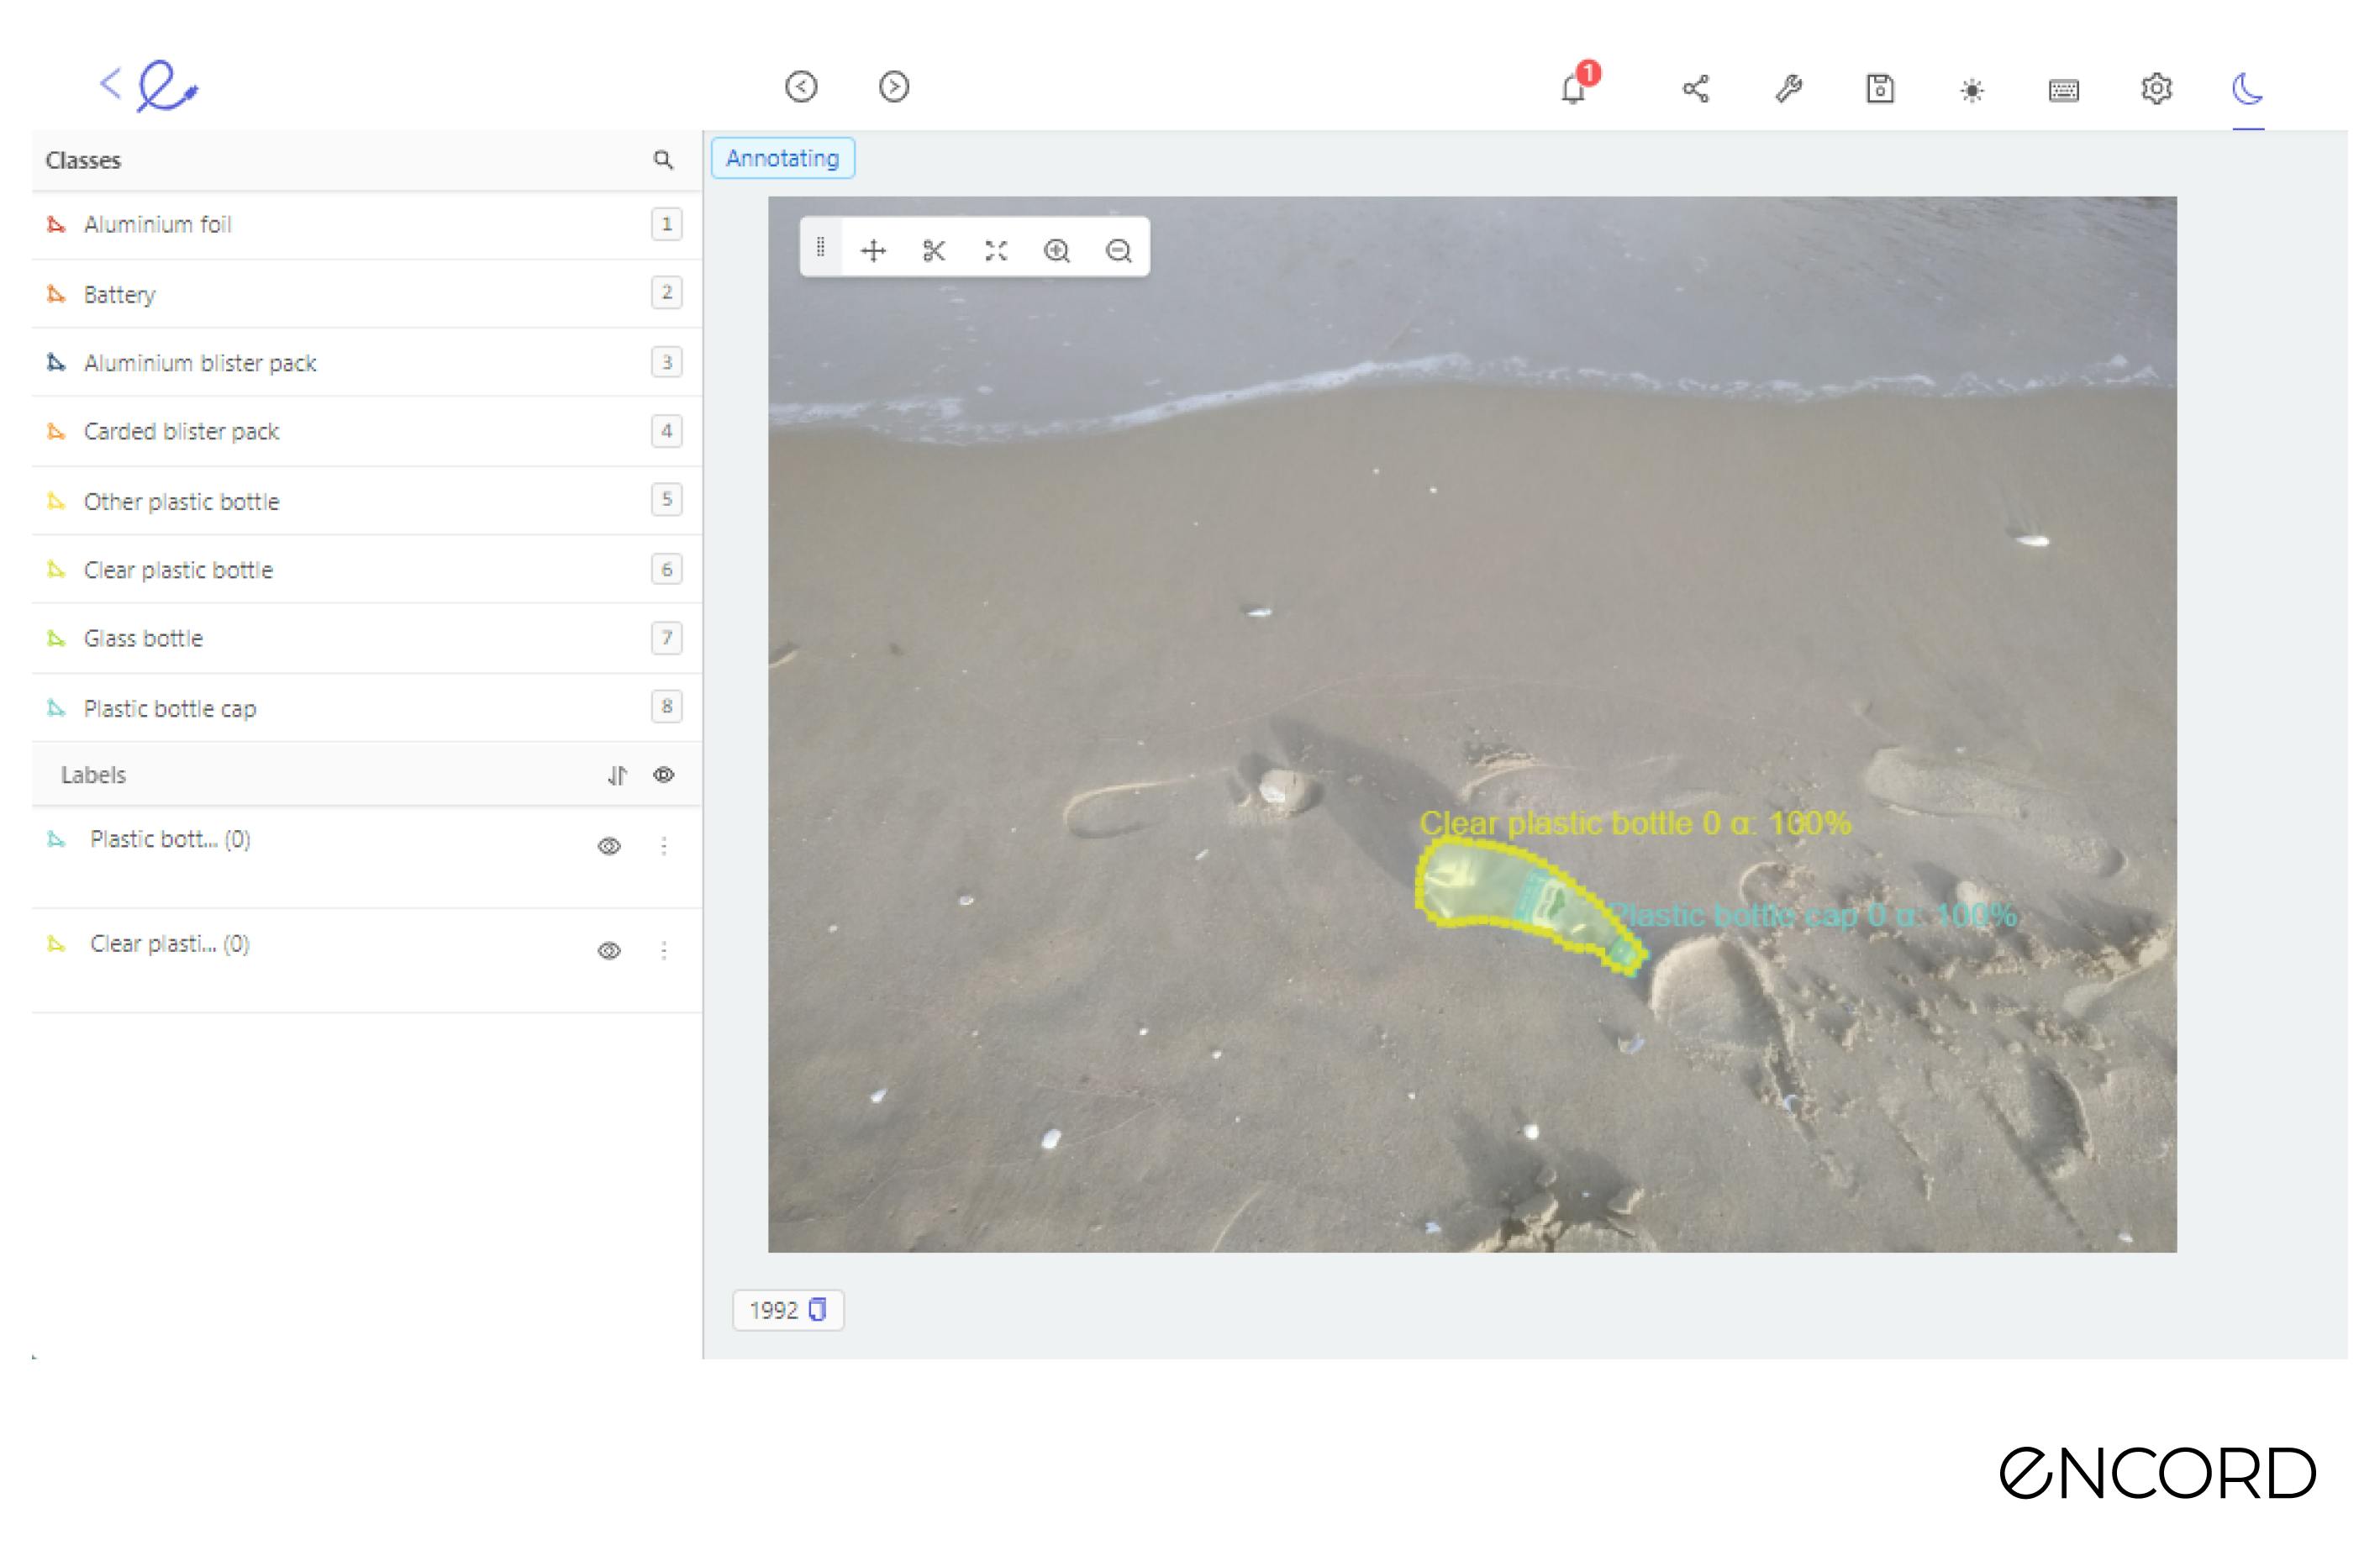
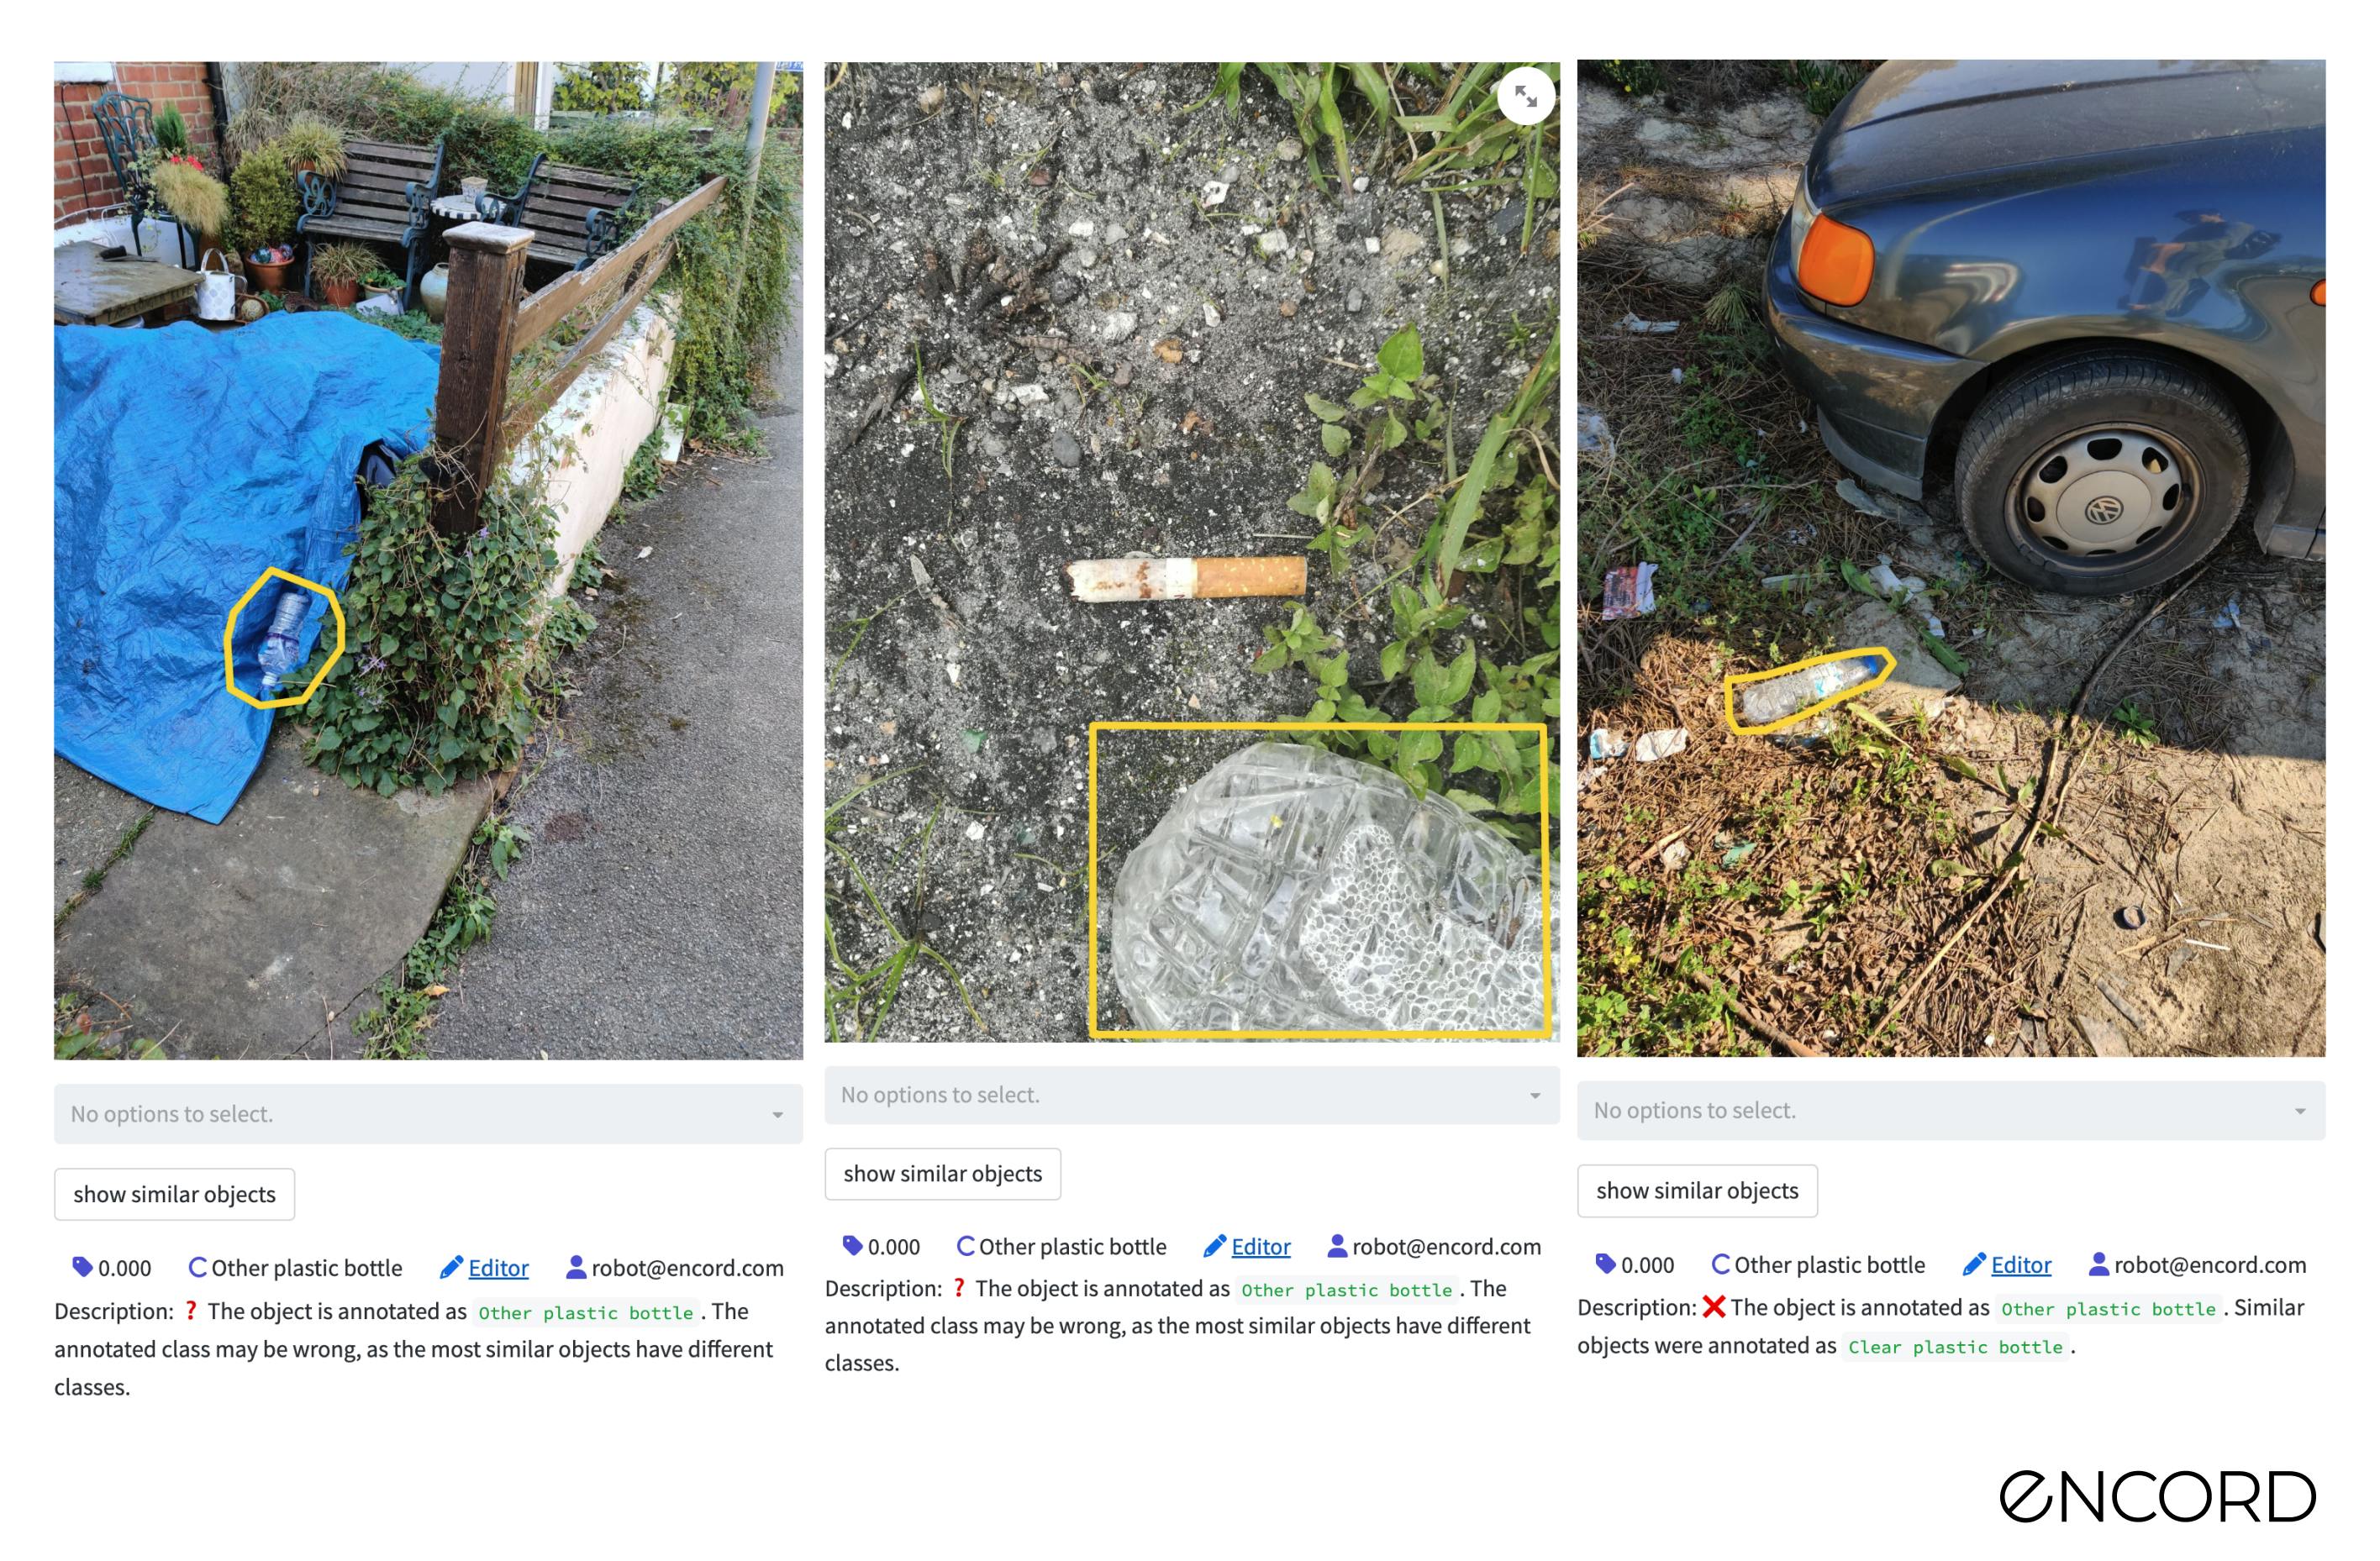
We navigate to Label Quality → Explorer tab, choose Object Annotation Quality as the metric and choose Clear plastic bottle as the target class. Sort samples by ascending to see objects with low annotation quality scores.
Here are some examples:
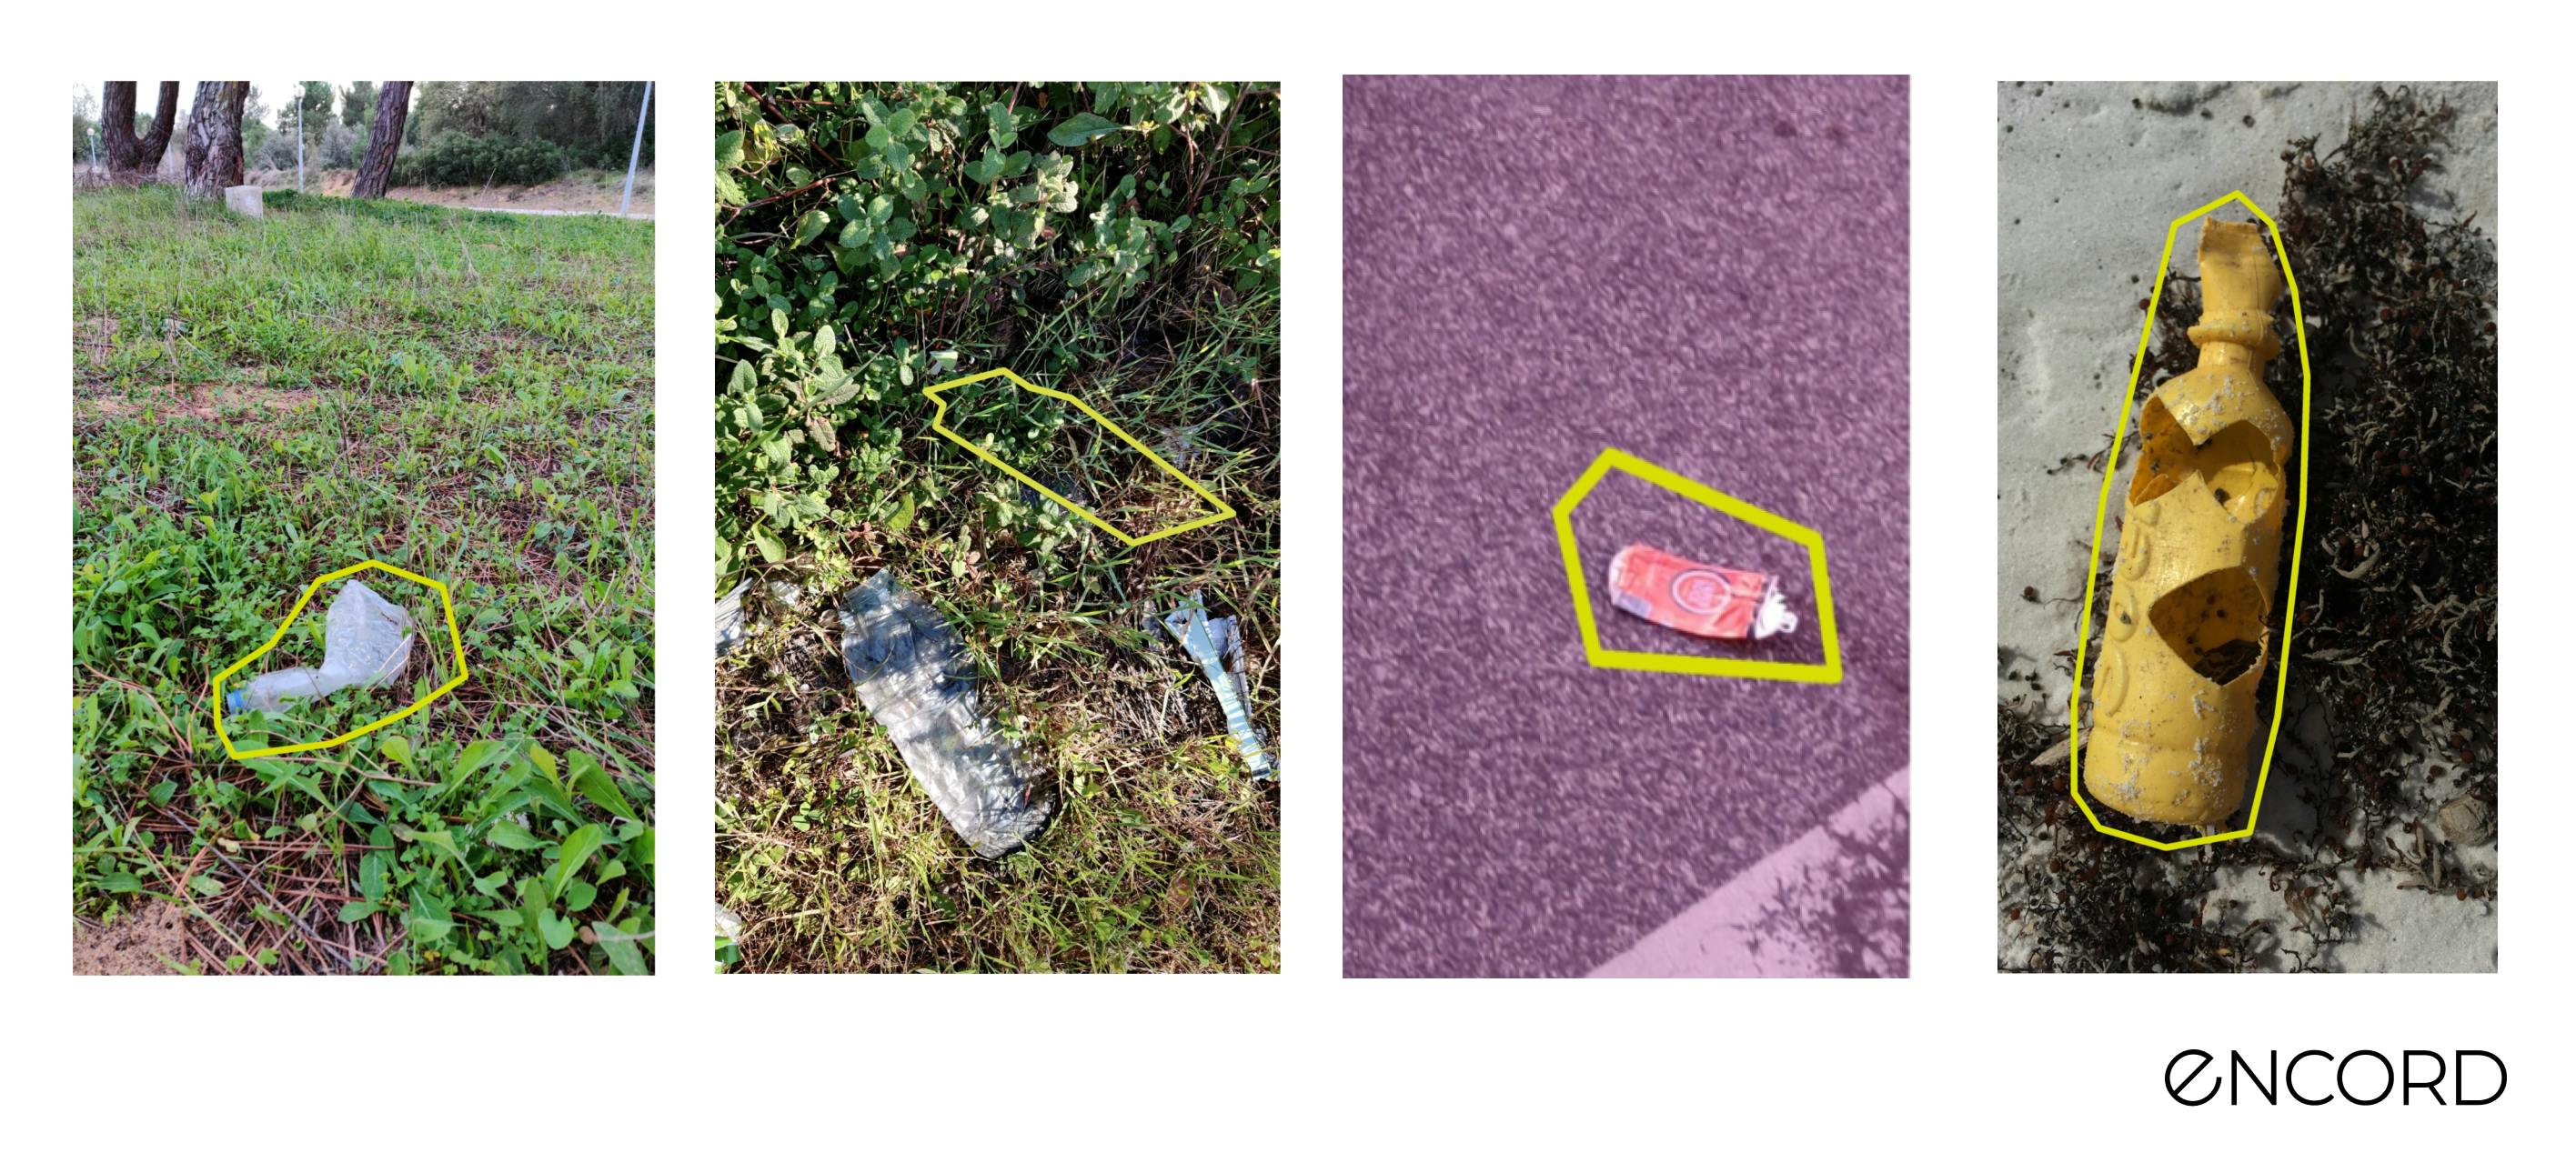
Fig: From left to right: 1) Completely off annotation. 2) Bad annotation 3) Both bad annotation and wrong class (the class should be Drinking can) 4) Wrong class (the class should be Other plastic bottle)
Using Encord Active, we can directly spot these label errors.
Tip: If you have imported your project from the Encord Annotate account, you can directly click the Editor button under each image to open it along with its annotations in the Encord Annotate platform, where you can easily fix the annotations.
Re-labeling
In this first iteration we will fix the labels of all the objects annotated as Clear plastic bottle. By going through the low annotation quality to high annotation quality, we can identify the lowest quality labels first.
Following this approach methodologically we fixed 117 labels for 81 images in a little over 1 hour.
After data labeling let’s return to model training.
Model re-training
Let’s re-train our machine learning model on the updated dataset to see if the performance for the Clear plastic bottles changes.
Now, fill in the details of your config.ini file in the project and re-train the model (if you did not do this before, please read the first blog here).
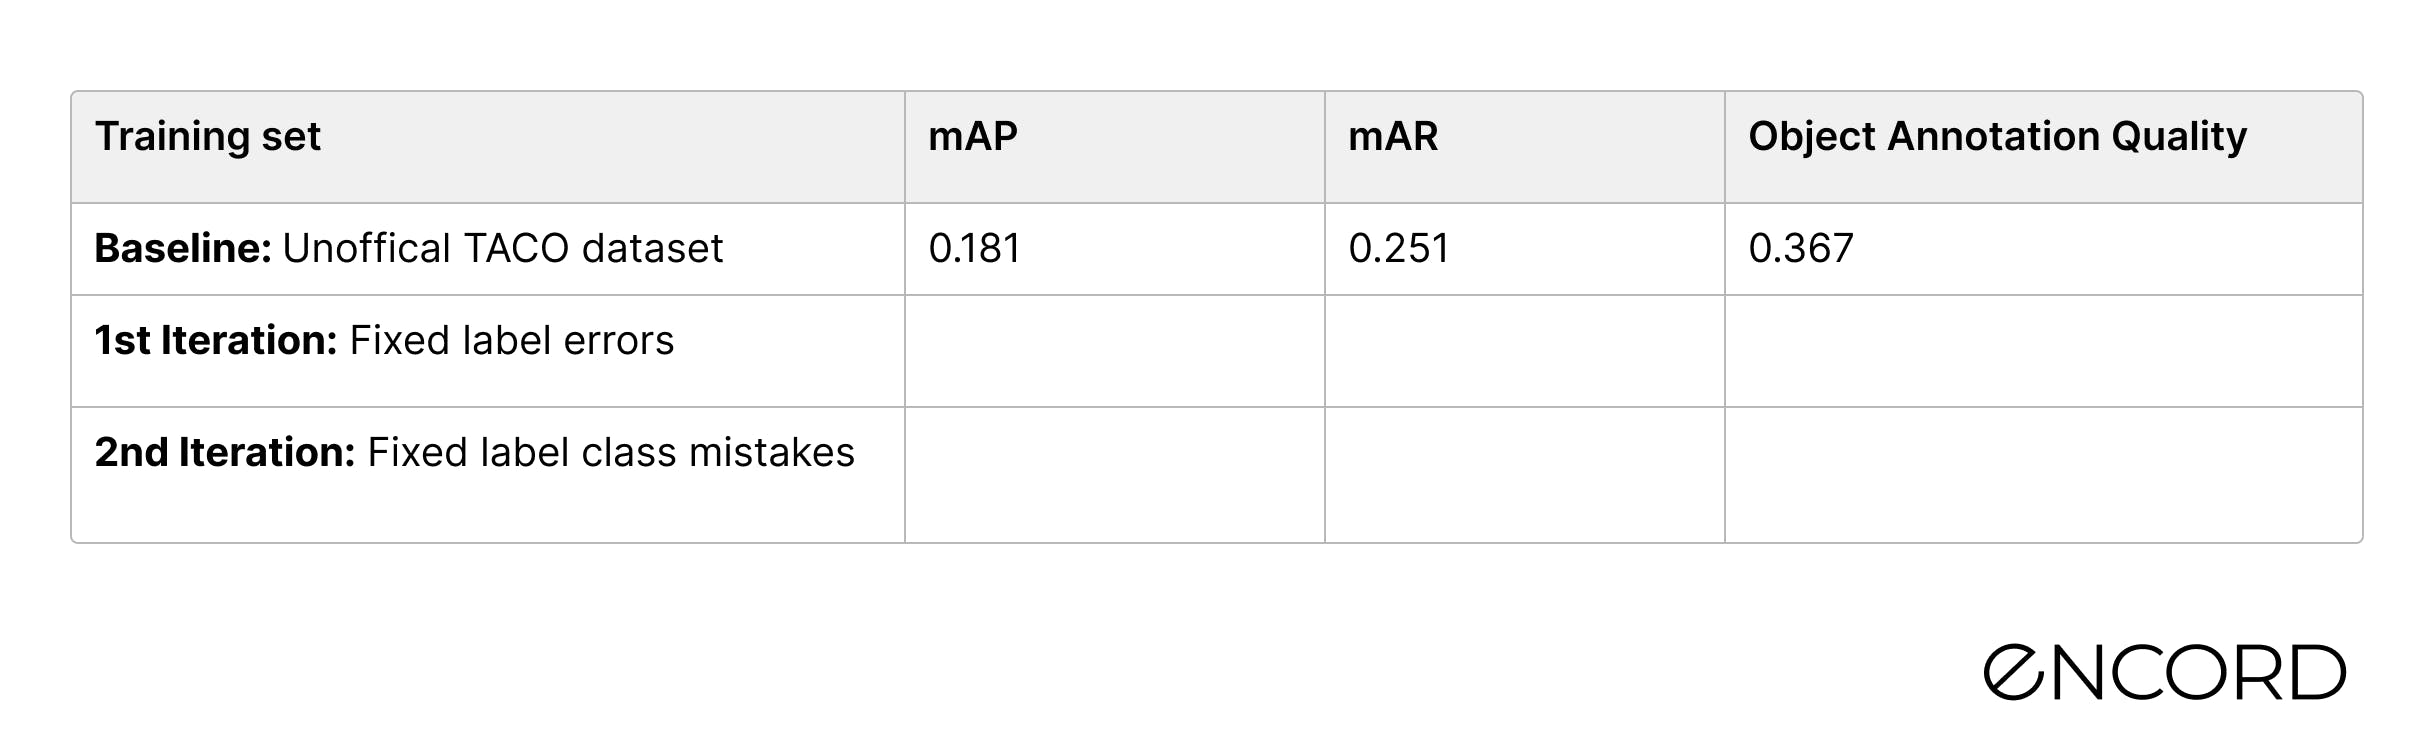
After the training, we import the predictions into Encord Active as we did in the previous blog post and inspect the performance. We can see that the performance of the Object Annotation Quality is now at 0.416.
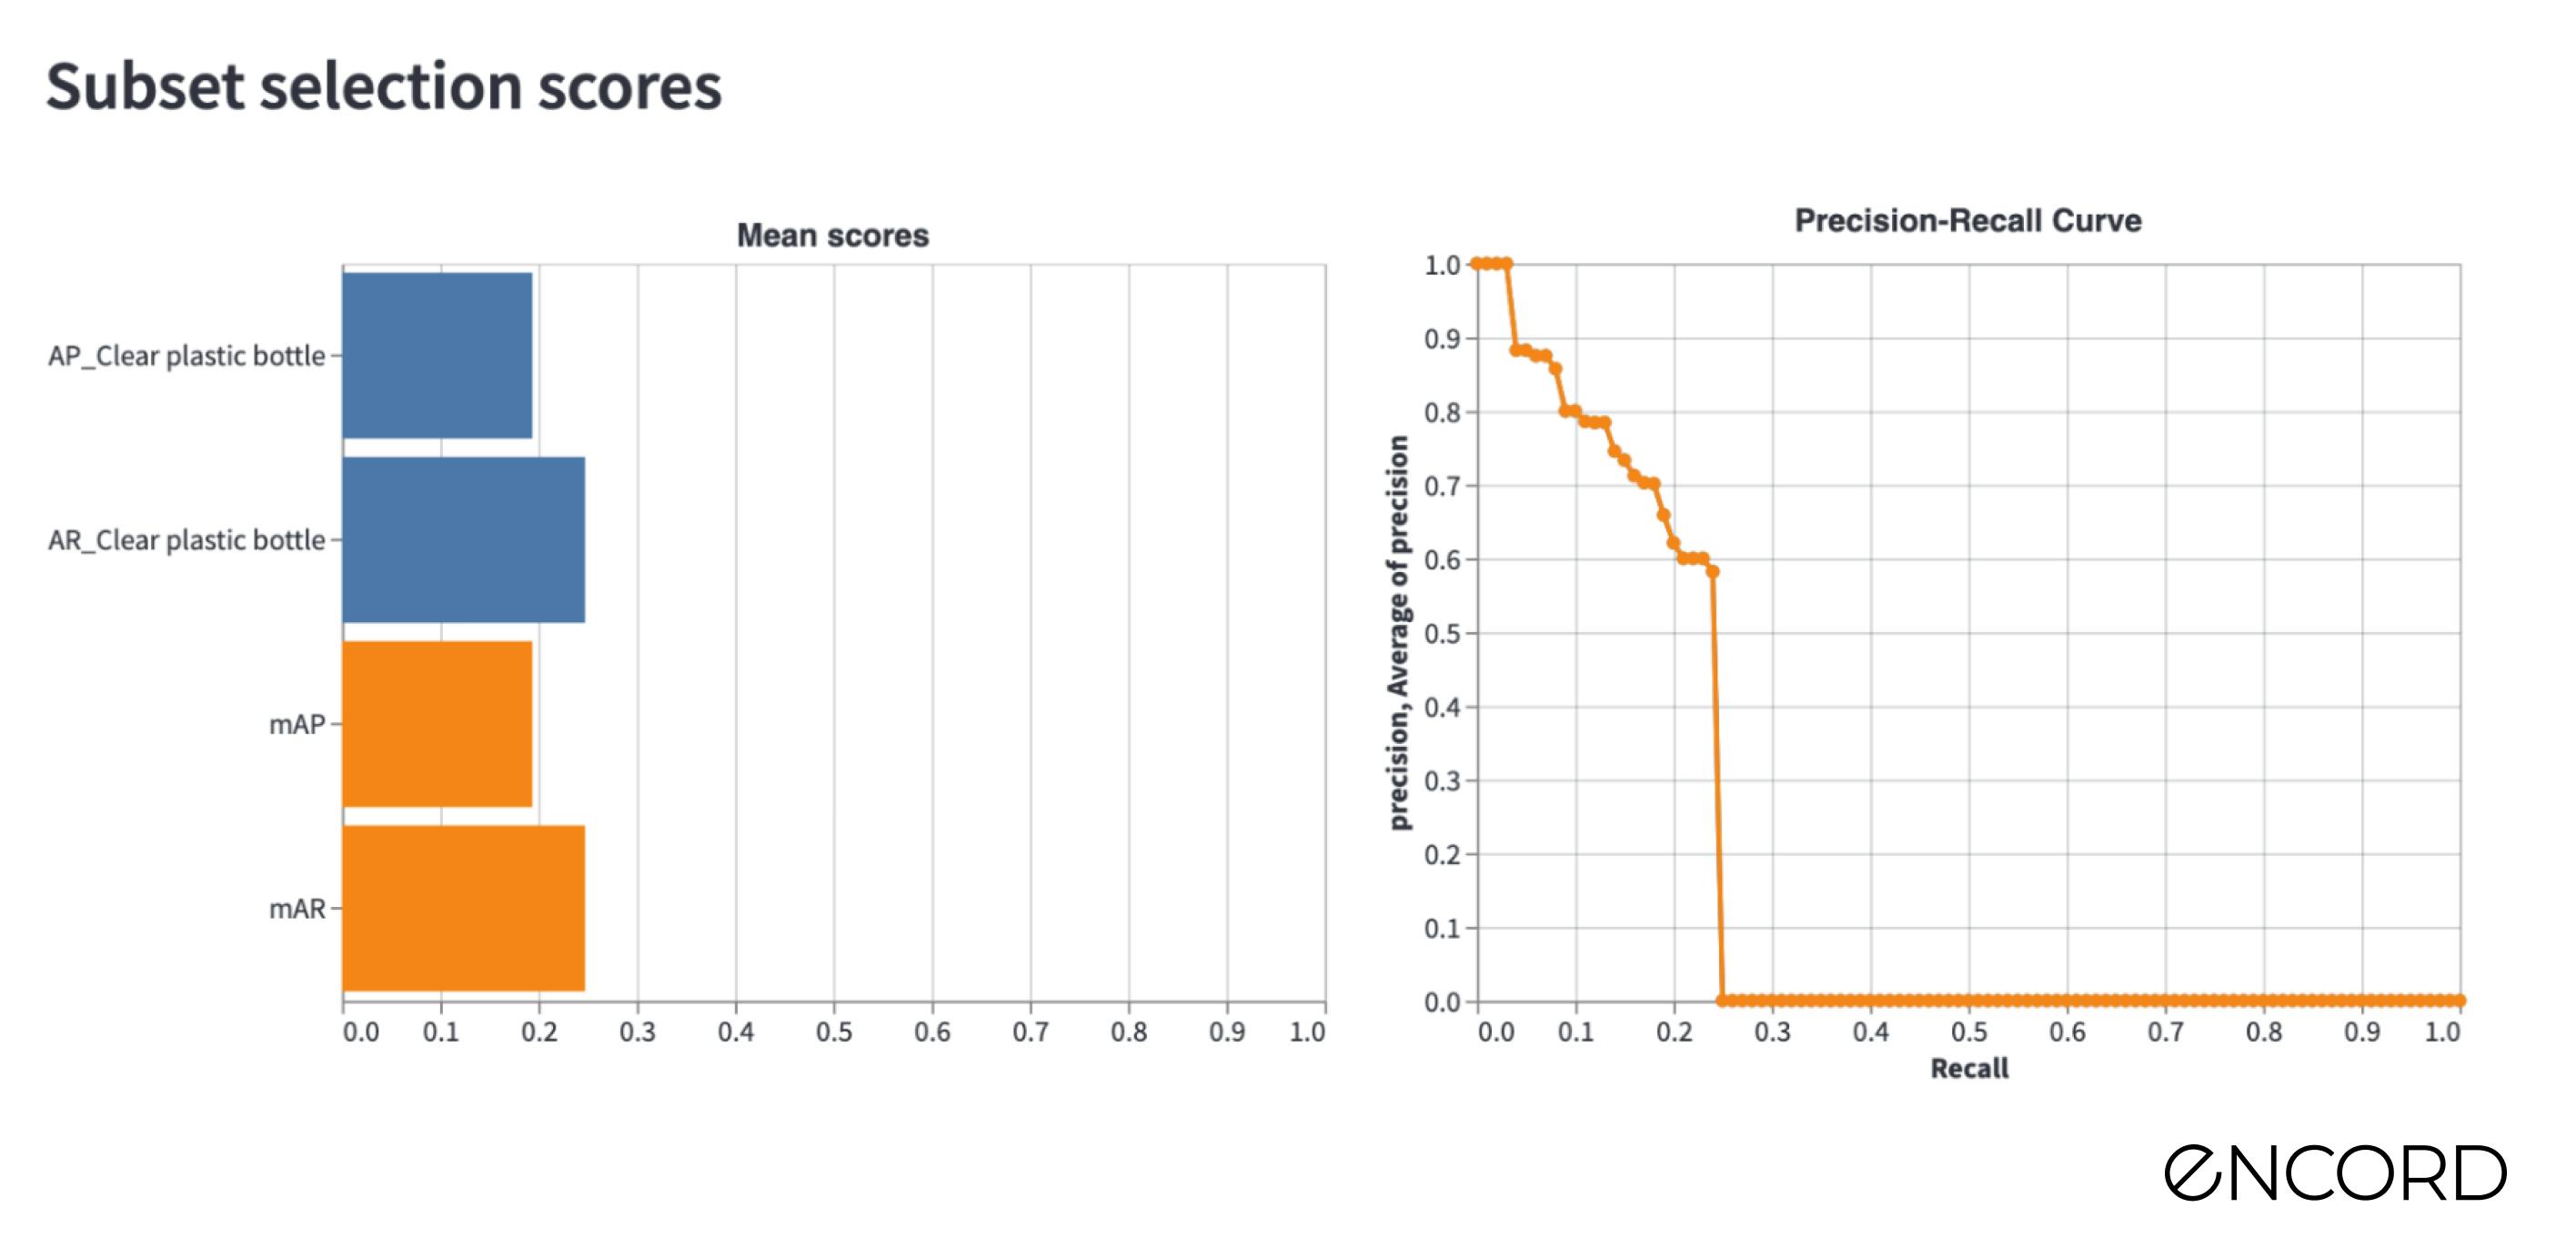
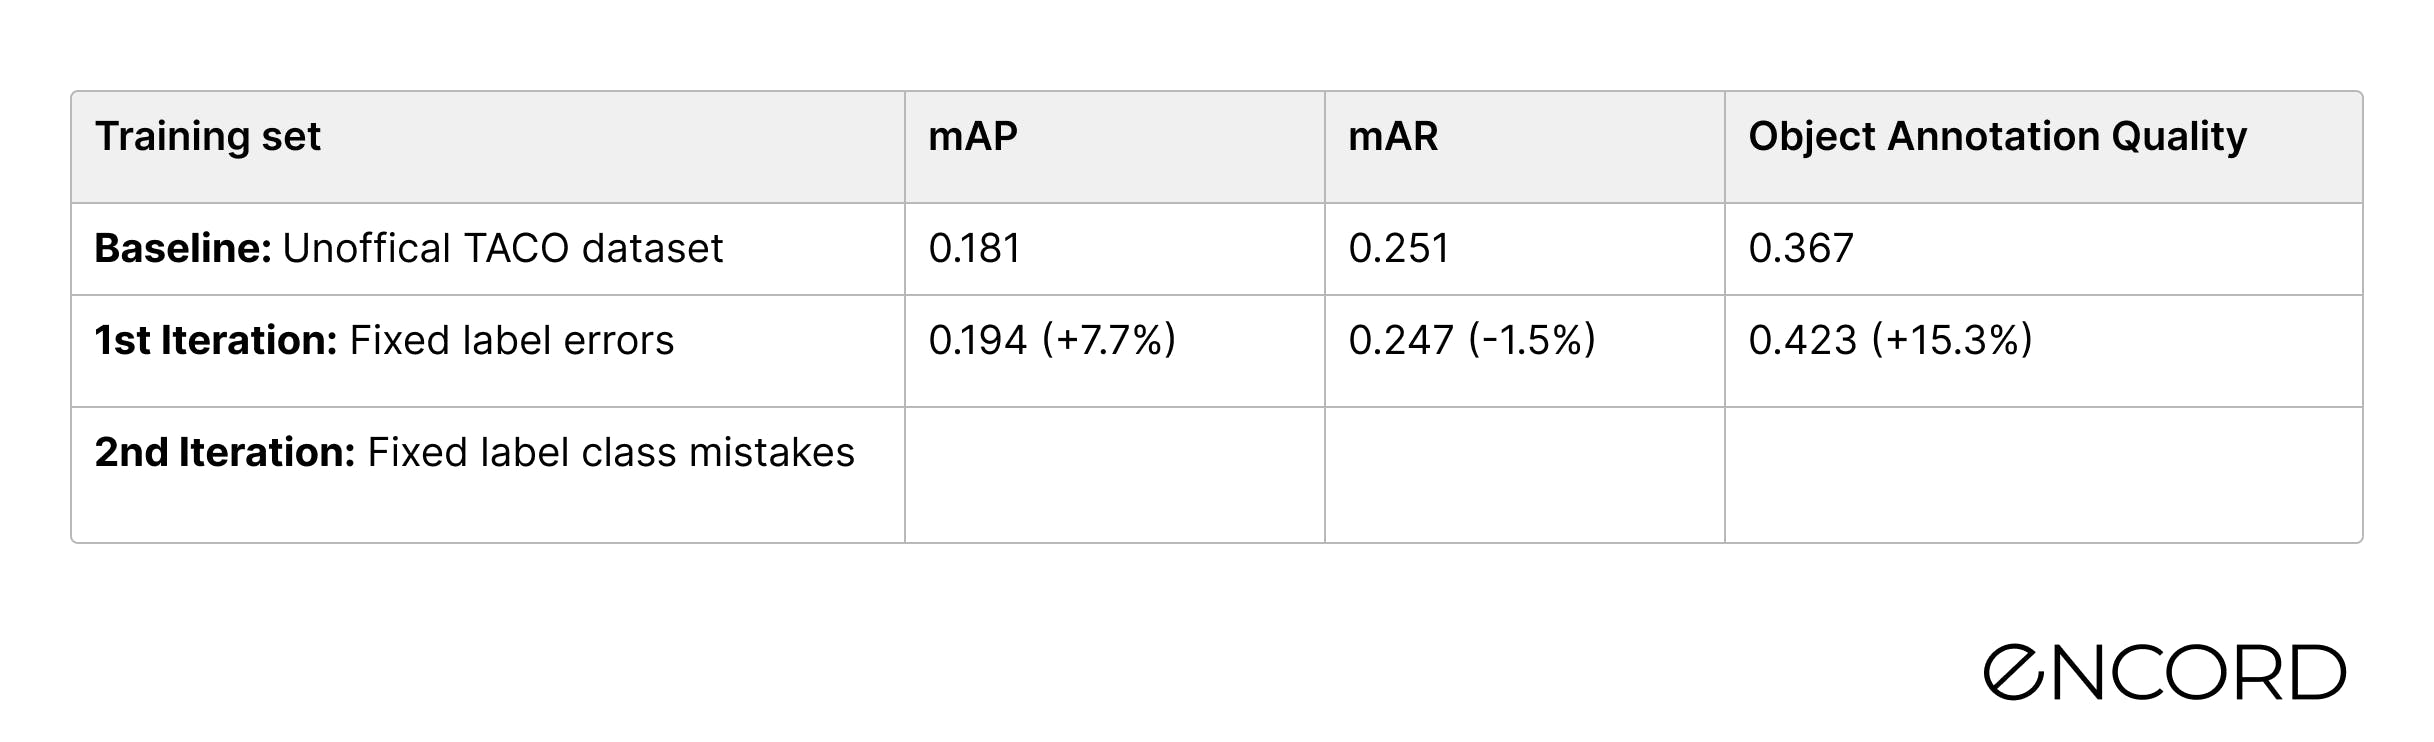
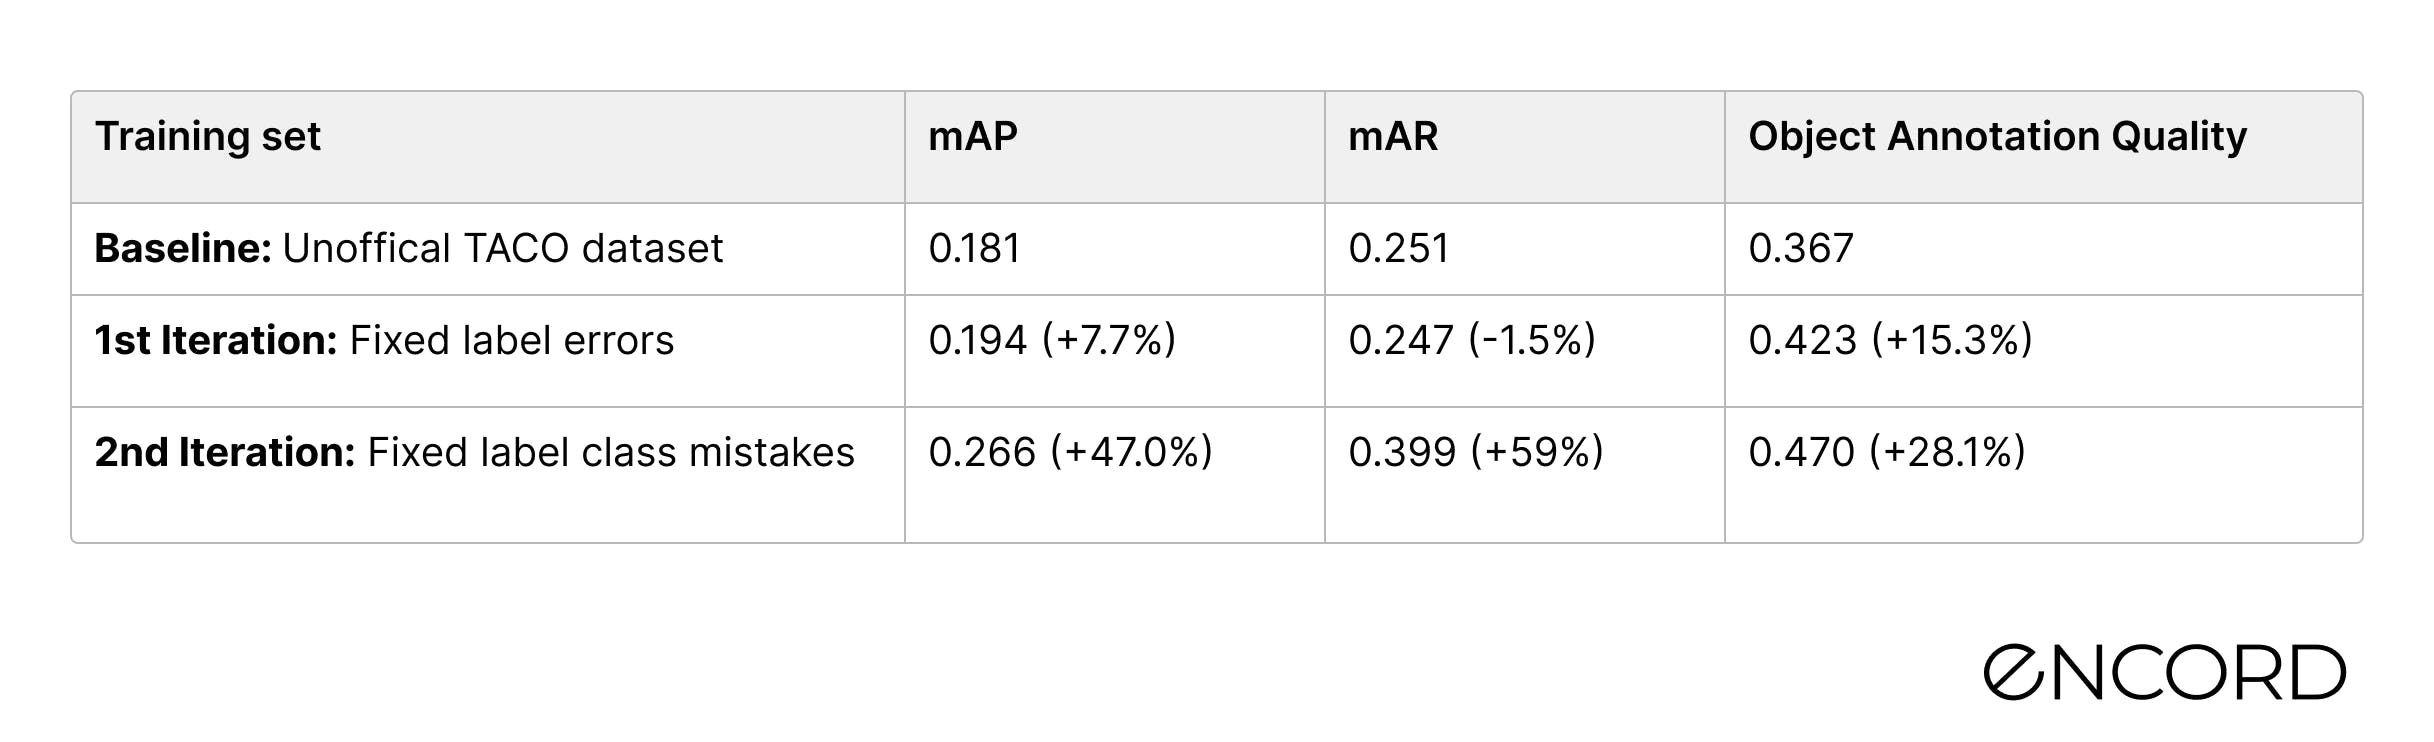
The performance results compared to the baseline are in the below table. The new model’s detection performance is 7.7% higher than the baseline for the mAP and it is slightly lower (-1.5%) for the mAR.
2nd Iteration: Fixing wrongly labeled objects
Off to a good start; however, we want to investigate other ways of improving model performance for the Clear plastic bottle class.
Next, we will look at fixing class label mistakes. We will start by looking at the label quality of the Other plastic bottle objects to identify whether some of the objects are mislabeled as Clear plastic bottle.
Analysis
First we investigate some of the badly annotated Other plastic bottle labels.
We see that many labels in fact belong to the class Clear plastic bottle but are labeled as Other plastic bottle.
So, let’s re-label the misclassified images of Other plastic bottle, as we did before.
Re-labeling

1.5 hours later and now have re-labeled 150 labels in nearly 100 images (98…). Data labeling is time consuming and tedious, but let’s see how powerful it can be as a data-centric approach to improving the model performance.
Model re-training
Let’s name this dataset Unofficial-v3 and train a new machine learning model. When the training is finished, we import the predictions for the official dataset, open the app and check the performance of the Object Annotation Quality is now at 0.466.
What an improvement!
By fixing wrongly labeled Other plastic bottle objects, we improved the performance of our Mask-RCNN machine learning model by 40% in the mAP score. If we were to choose a model-centric AI approach and simply tried to fine-tune the model, such a performance increase would have been nearly impossible. Compared to the baseline, we have improved the performance by almost 50%!
In this work, we have only focused on improving a single class performance; but similar results could have been achieved if we did the same work for other classes.
Conclusion
In the 2nd installment of the Data-centric AI case study series, our goal was to improve the performance of our litter detection model for a specific class. To do that, we utilized a simple data-driven workflow using the open source active learning tool, Encord Active. With the tool we:
- Found and fixed bad labels to optimize our models performance, leading to higher accuracy on Clear plastic bottle class.
- Found and fixed objects that have been wrongly classified and fixed the labels.
At the end of the two iteration cycles, we improved the mAP of the target class by 47% from the baseline.
In the last post of the data-centric AI case study series, we will showcase how to improve the class-based model performance by targeting labeling efforts and augmenting current images.
Want to test your own models?
"I want to get started right away" - You can find Encord Active on Github here.
"Can you show me an example first?" - Check out this Colab Notebook.
"I am new, and want a step-by-step guide" - Try out the getting started tutorial.
If you want to support the project you can help us out by giving a Star on GitHub :)
Want to stay updated?
- Follow us on Twitter and Linkedin for more content on computer vision, training data, MLOps, and active learning.
- Join the Slack community to chat and connect.
Frequently asked questions
Encord allows users to curate their data using Encord Index, where they can organize and manage datasets effectively before sending them through the workflow manager for annotation. This structured approach ensures that the annotation process aligns with specific project goals.
Encord's platform is built for scalability, enabling users to train hundreds of models concurrently. This is achieved through efficient data management and processing capabilities that streamline the training workflow, allowing for rapid model development and deployment.
Encord allows for fine-grained access control, enabling users to manage who can view and interact with data during the annotation and training phases. This ensures that sensitive data is protected while still being utilized effectively in the model training process.
Encord provides the necessary labels and allows users to train models in their own environment using platforms like Hugging Face. Once trained, users can integrate their models for pre-labeling or inference directly with Encord's system.
No, Encord is not a data provider. Instead, it works with clients' existing data to facilitate the training and fine-tuning of their models, allowing for a customized and efficient approach to model development.