Contents
What is Data Clustering?
Types of Data Clustering Techniques
Data Clustering Algorithms
Real-World Applications of Data Clustering
Data Clustering: Key takeaways
Encord Blog
Data Clustering: Intro, Methods, Applications

Data clustering involves grouping data based on inherent similarities without predefined categories. The main benefits of data clustering include simplifying complex data, revealing hidden structures, and aiding in decision-making. Let’s understand more with the help of an example. It might seem intuitive that data clustering means clustering data into different groups.
But why do we need this concept of data clustering?
Data analysis using data clustering is a particularly interesting approach where you look at the entities or items by their general notion and not by their value. For example, over-the-top platforms like Netflix group movies and web series into categories such as “thriller,” “animation,” “documentaries,” “drama,” and so on for ease of user recommendation and access.
Consider a problem where a retail company wants to segment its customer base for targeted marketing campaigns. They can analyze the buying patterns of the customers to create tailored discounts. If one customer is a frequent buyer of high-end clothing and the other likes to purchase electronics, then the company can provide special offers on clothing for the first customer and discounts on electronics for the second customer. This can result in increased sales and greater customer satisfaction. If you like to watch thriller movies, instead of searching for the next one yourself, the platform can easily suggest other movies with the same genre. This creates a win-win situation for the user and the platform.
In this article, we will discuss three major types of data clustering techniques - partition-based, hierarchical-based, and density-based along with some of their real-world applications across industries such as anomaly detection, healthcare, retail, image segmentation, data mining, and other applications.
What is Data Clustering?
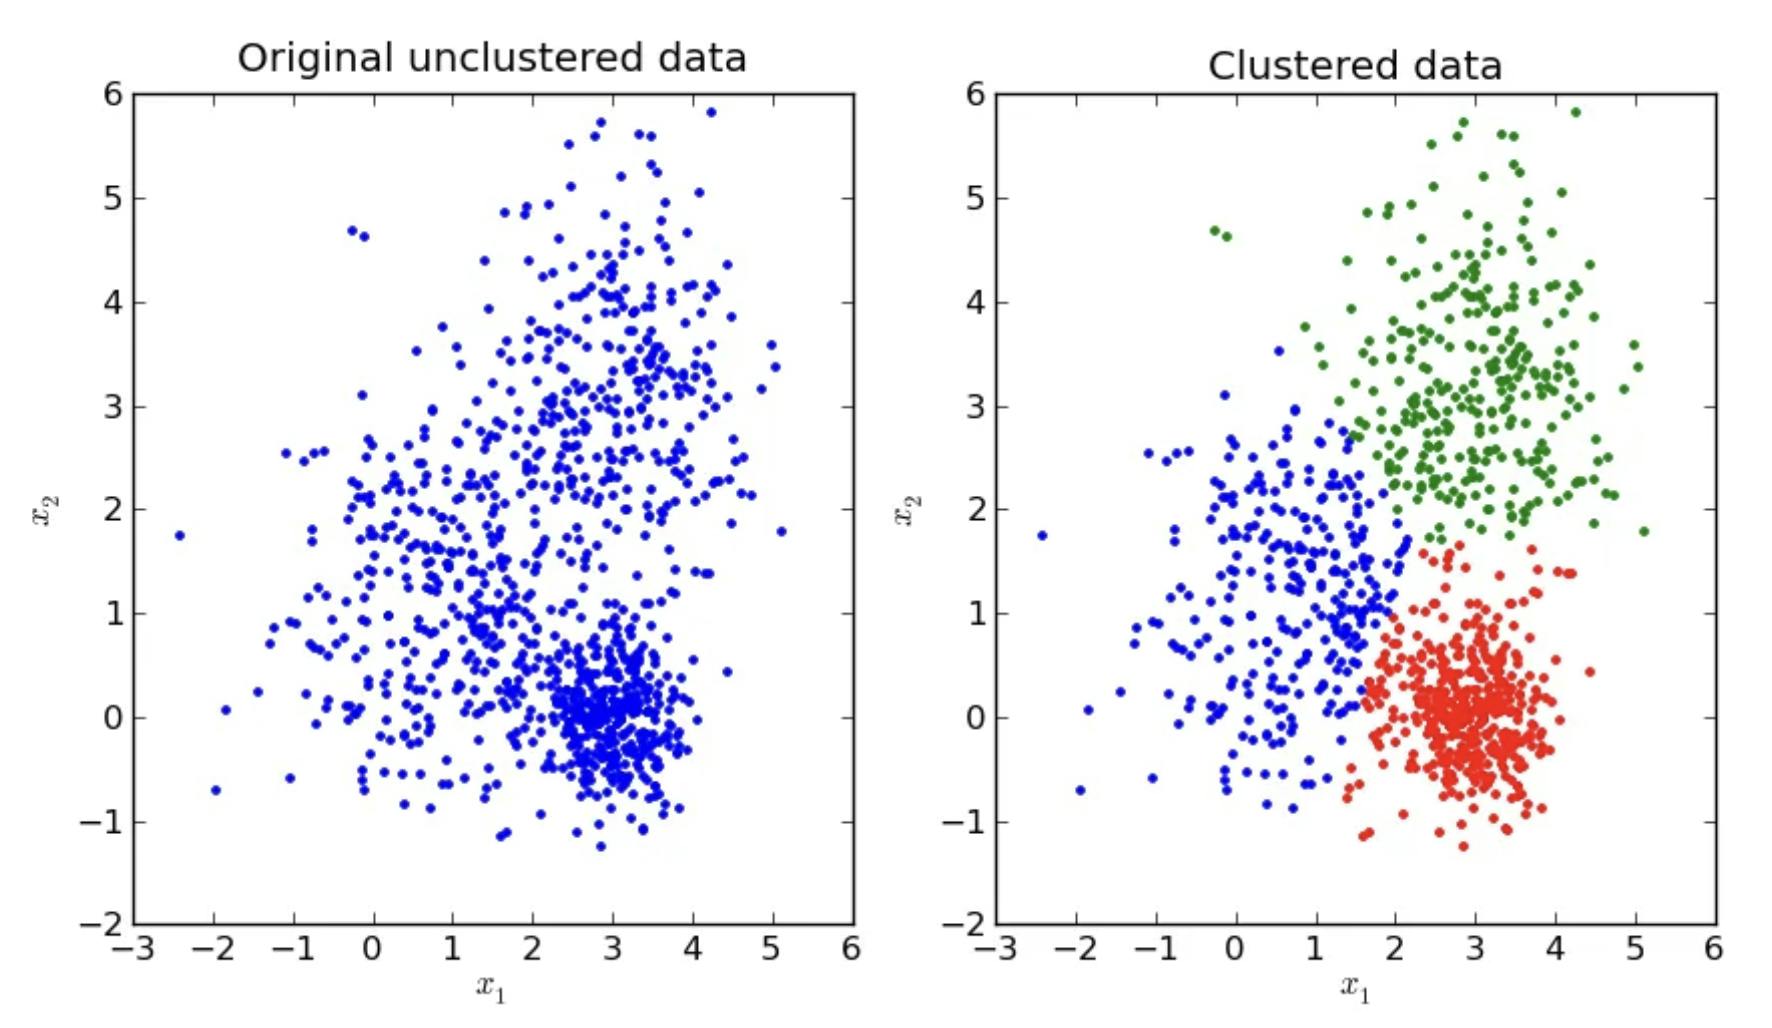
In machine learning, tasks fall into two main categories: supervised learning, where data comes with explicit labels, and unsupervised learning, where data lacks these labels. Data clustering is a technique for analyzing unsupervised machine learning problems to find hidden patterns and traits within the data. It's a powerful method for pattern recognition that provides useful insights about the data that may not be evident from inspecting the raw data.
At the end of the clustering process, the dataset gets segmented into different clusters. Each group contains data points with similar characteristics, ensuring the clusters contain distinctly different data points.
Types of Data Clustering Techniques
There are three main data clustering methods:
- Partitioning clustering
- Hierarchical clustering
- Density clustering
Partitioning Clustering
In partitioning clustering, each data point belongs to only one cluster. You must specify the number of clusters in advance. Common applications include image compression, document categorization, or customer segmentation. The K-means algorithm is one commonly used partition-based clustering algorithm in data science and machine learning. The main strength of this technique is that the clustering results are simple, efficient, and easy to deploy for real-world applications.
Hierarchical Clustering
Hierarchical clustering builds a tree-like structure of clusters within the dataset. This tree-like structure, represented by a dendrogram, allows each node to represent a cluster of data points. This representation does not require predefining the number of clusters, as opposed to partition-based clustering, making it more versatile to implement and extract insights.
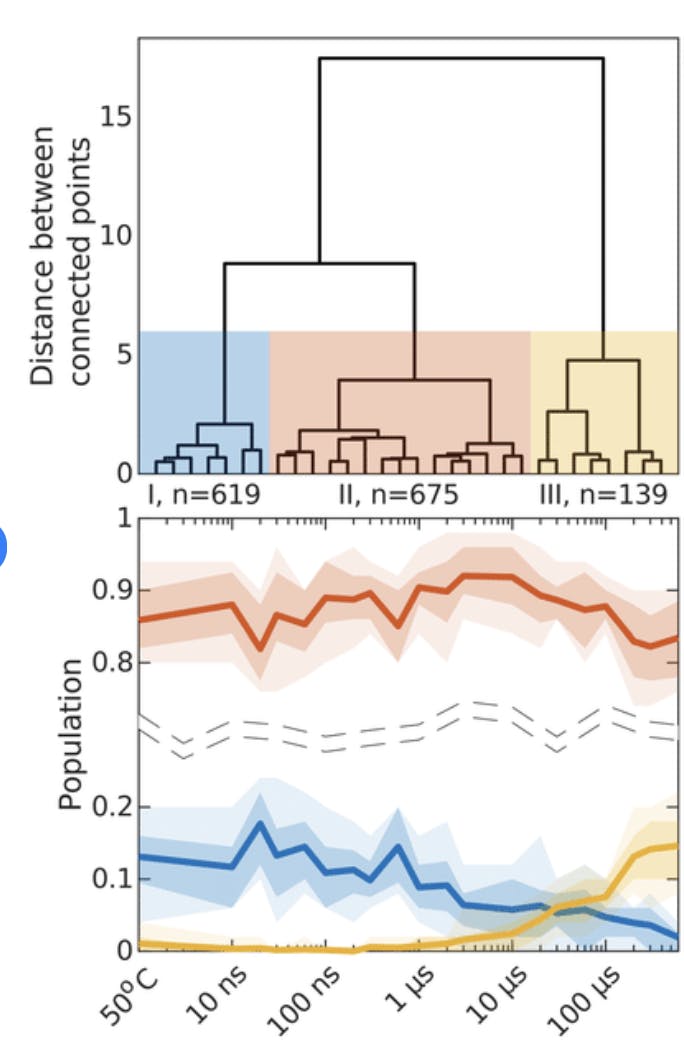
By providing a multi-resolution view, i.e., a 3-dimensional view, this technique makes it easier to explore and understand the links between the smaller clusters at different levels of granularity. Additionally, by cutting the dendrogram at a desired height, you can extract clusters at different levels. Common applications include genetic clustering, document clustering, or image processing for image segmentation. Due to the multi-resolution visualization, this method can get very computationally intensive for large datasets with high dimensionality, as the time and memory requirements will increase significantly.
Density-based Clustering
The density-based clustering approach identifies clusters based on the density of data points in a feature space. The feature space is related to the number of features or attributes used to describe the data points. Clusters in dense regions are similar to clusters present in sparse regions. The clusters can be of any arbitrary shape and not just standard spherical or elliptical shapes, making this technique robust to noise in the data and suitable for high-dimensional datasets.
DBSCAN is a notable density-based algorithm. It is popular among applications such as Geographical Information Systems (GIS) for providing location-based services by clustering GPS data and for intrusion detection by detecting cyber threats based on anomalies in network traffic data.
Data Clustering Algorithms
We will deep dive into three popular data clustering algorithms: K-means, hierarchical clustering, and DBSCAN, each of which falls under the three categories you learned above.
K-means Clustering
The k-means clustering algorithm aims to maximize the inter-cluster variance and minimize the intra-cluster variance. This ensures that similar points are closer within the same cluster, whereas dissimilar points in different clusters remain farther apart.
Steps for K-means clustering:
- The first task for the algorithm is to pre-define the number of clusters with, say, a hyperparameter ‘k’. Each of these clusters will be assigned its cluster centers randomly.
- It assigns each data point to one cluster based on the minimum distance between the data point and the cluster centroid. These distance measures are often calculated using Euclidean distance.
- Next, it updates all the cluster centroids with the mean value of all the data points within the cluster.
- It repeats steps 2 and 3 until a certain stopping criterion is met. The algorithm halts when the clusters stop changing, i.e., all points belong to those clusters whose centers are closest to them, or after a set number of iterations.
- Finally, when the algorithm converges, each data point ultimately belongs to its closest cluster.
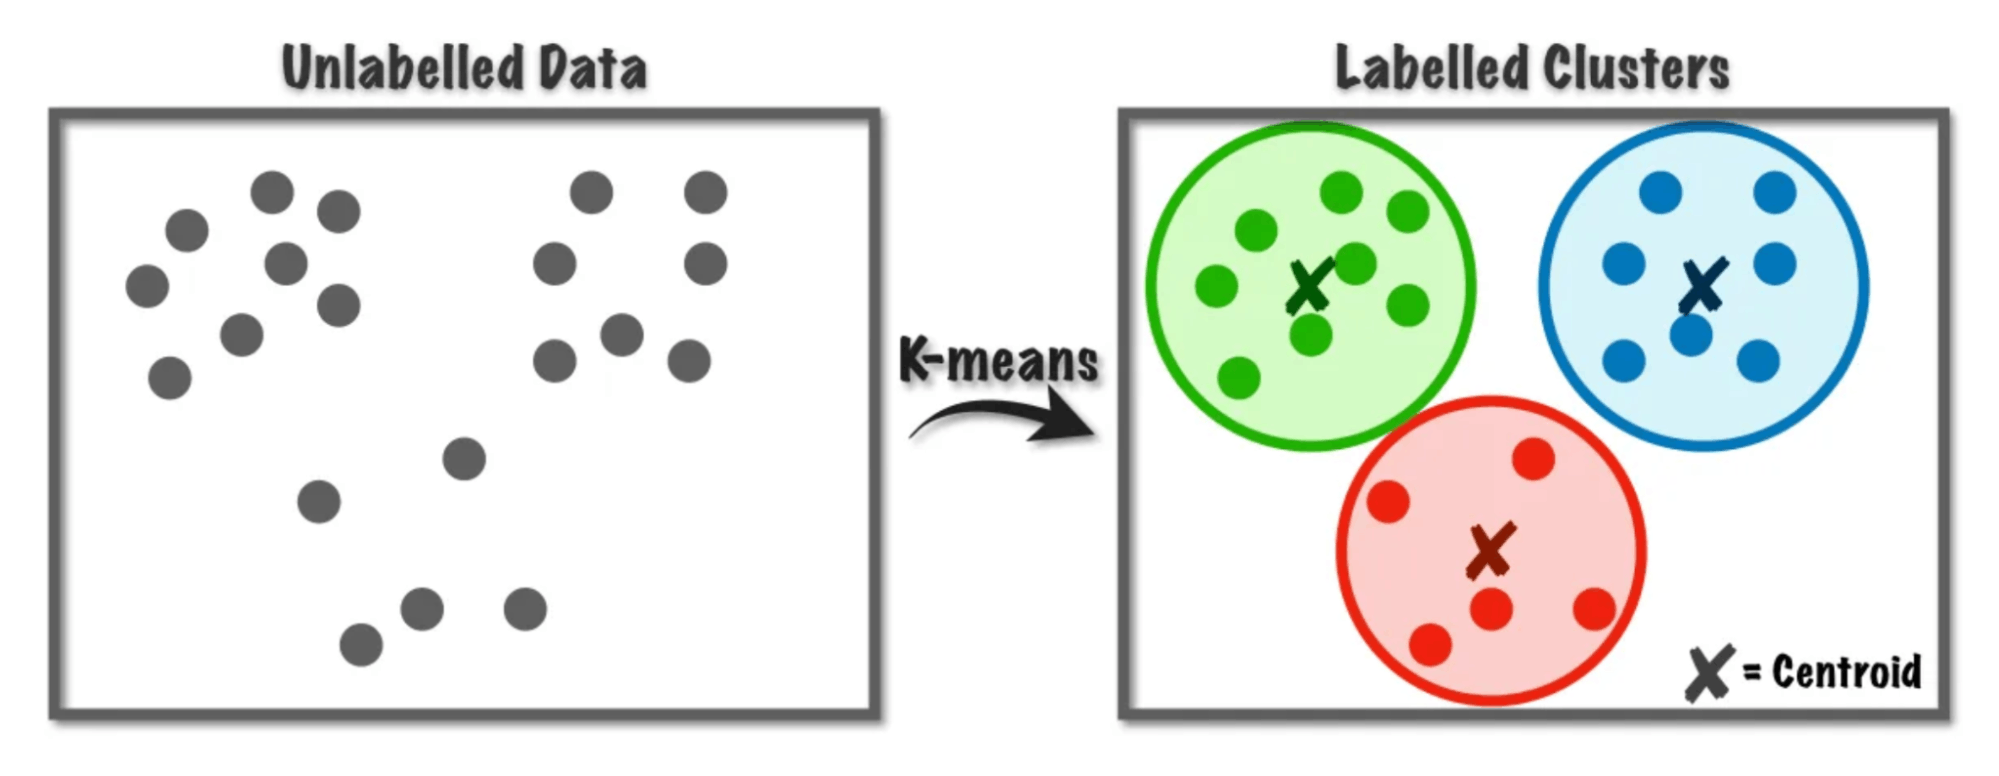
Although this algorithm seems pretty straightforward, certain aspects need to be carefully considered so that it does not converge to a suboptimal solution. Carefully initialize the number of clusters using some techniques rather than randomly. This way, you ensure that the algorithm does not fail or runs multiple times to avoid bias towards an initialization. Additionally, K-means assumes by default that cluster shapes are spherical and have equal size, which might not always be suitable.
Hierarchical Clustering
Hierarchical clustering provides a multi-level view of data clusters. As discussed previously, since this method does not require pre-specifying the number of clusters, there are two approaches to using this algorithm:
- Agglomerative clustering (bottom-up approach)
- Divisive clustering (top-down approach)
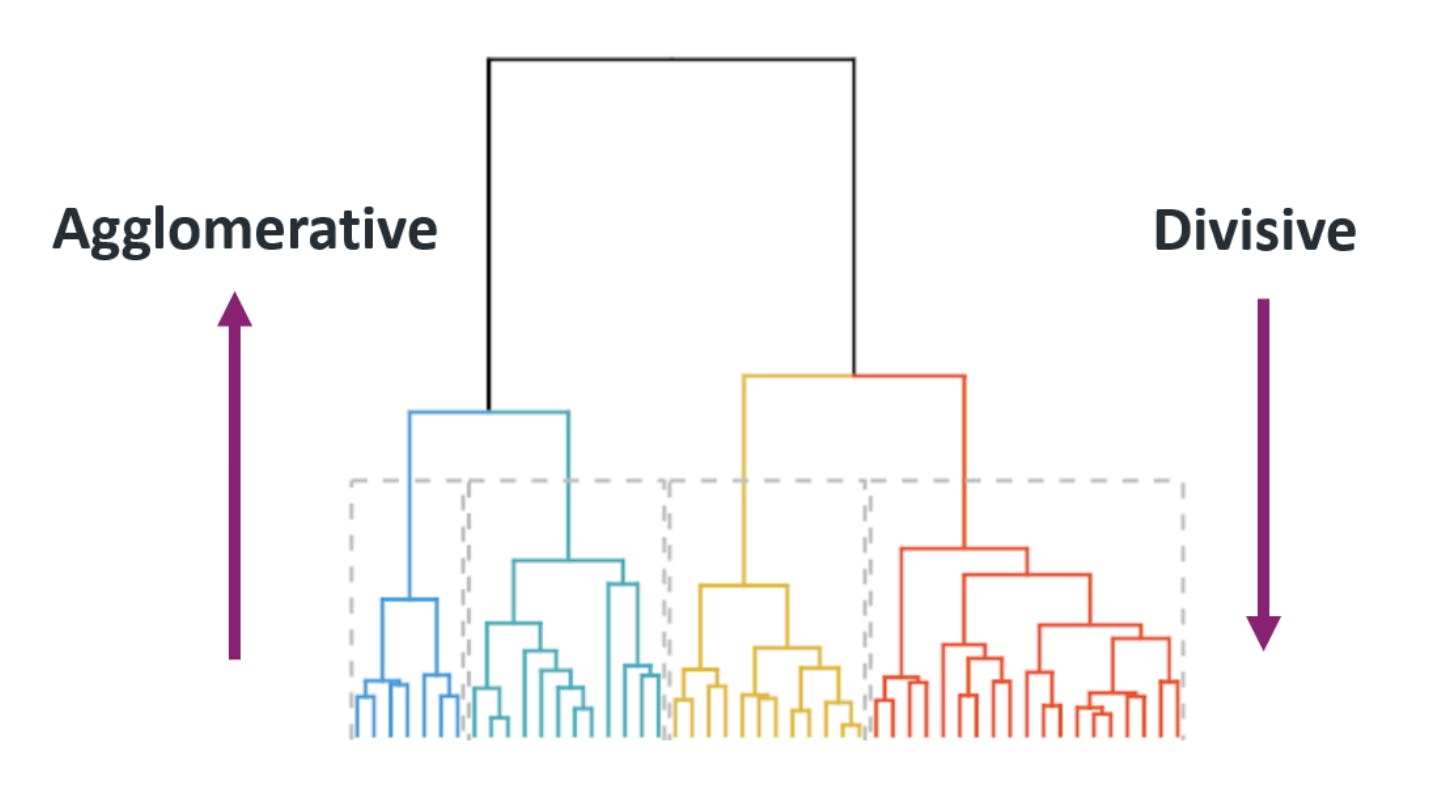
Agglomerative clustering initializes each data point as a cluster at the beginning. Next, the pairwise distance between the clusters is computed to check their similarity using linkage criteria such as single linkage, average linkage, or complete linkage. Based on the distance determined by the criteria, the two nearest clusters merge iteratively until only one remains. During the cluster merging process, a dendrogram is created that captures the hierarchical relationships of clusters. The desired number of clusters is obtained by cutting the dendrogram at a certain height, considering that clusters on the top are more general than the bottom ones, which are more specific.
Divisive clustering: all the data points start in one cluster instead of agglomerative clustering, where each data point is a single cluster. Pairwise distance similarities are calculated to split the most dissimilar clusters into two clusters. Finally, a dendrogram with a top-down view is created, which can be split at a certain height based on requirements.
DBSCAN
Density-Based Spatial Clustering of Applications with Noise (DBSCAN) is a density-centric clustering algorithm that identifies clusters of arbitrary shapes. Unlike centroid-based clustering methods, DBSCAN looks for regions where data points are densely packed and separates them from sparser regions or noise.
Here's a step-by-step breakdown of what the algorithm does:
- Selects a core point (similar to the centroid of a cluster) by looking at the neighboring data points. A data point becomes a core point if at least ‘z’ is the minimum number of points within a radius ‘r’ of a particular randomly chosen data point.
- Density-reachable points: All the points present within a radius ‘r’ from the core data point. Upon repeating the selection process for all data points, clusters of density-reachable points from core points will emerge.
- Border points: These points aren't dense enough to be core points but belong to a cluster, typically found at the cluster's edges.
- Noise points: Points that aren't core or border points are treated as noise. They're outliers, typically residing in low-density regions
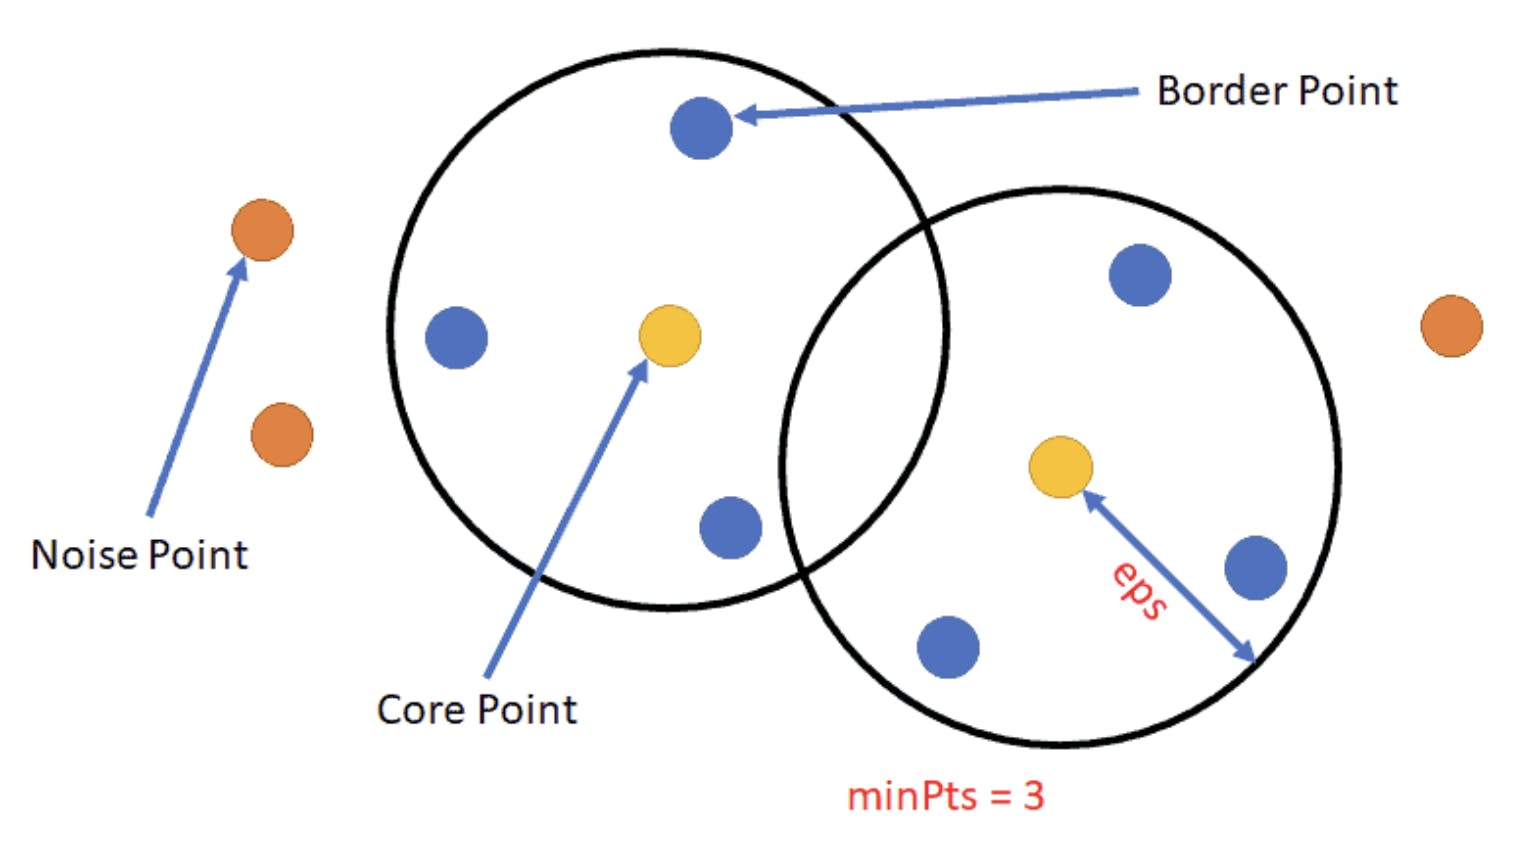
This algorithm is beneficial for obtaining clusters of varying densities with no specific shape or size. The final results depend greatly on the choice of hyperparameters, such as the radius ‘r’ and a minimum number of points ‘z’. Optimally tuning them is essential. Overall, it is an excellent technique for data exploration and analysis, specifically involving density-based real-world applications.
Real-World Applications of Data Clustering
Biomedical Domain
Clustering algorithms play a crucial role in patient analysis and advancements in medicine. One crucial example is gene expression analysis for cancer subtype classification. Like breast cancer subtypes, clustering enables the grouping of patients by similar gene expressions, leading to targeted therapies and facilitating biomarker discovery.
Social Network Analysis
Clustering algorithms identify online user communities for targeted advertising campaigns through social network analysis. By categorizing users as "travel enthusiasts," "techies," and the like, advertising content can be tailored to specific clusters, increasing click-through rates.
Customer and Market Segmentation
In e-commerce, an online retailer aiming to enhance personalization can use clustering techniques to categorize customers into “occasional buyers” or “frequent buyers” based on previous purchases and browsing history. Several benefits are associated with this segmentation, including exclusive offers for specific groups or recommending personalized products. Using these algorithms for customer segmentation creates a win-win situation for customers and retailers. Customers get reasonable recommendations tailored to their preferences, whereas retailers get more orders, an increased repurchase rate, and, ultimately, customer satisfaction.
Recommendation Engine
Streaming platforms like Amazon Prime and Netflix use clustering algorithms to group users with similar viewing habits and preferences, such as “action movie enthusiasts” or “animation lovers,” to recommend content and increase user engagement.
Image Segmentation
Image segmentation tasks are prominent in medical imaging. Such tasks require clustering algorithms for problem analysis. Given some MRI brain scans, you can apply density-based clustering techniques to group pixels corresponding to different tissue types, such as gray matter, white matter, etc. This can aid radiologists in detecting and precisely locating abnormalities such as tumors or lesions.
In summary, clustering algorithms not only assist in the procedure of medical diagnosis but also save a lot of time and effort to detect anomalies within complex images manually, ultimately providing improved healthcare services for patients.
Data Clustering: Key takeaways
- Data clustering algorithms are an essential tool to understand and derive actionable insights from the plethora of data available on the web.
- There are mainly three types of clustering: partitioning clustering, hierarchical clustering, and density clustering.
- The K-means algorithm, a partition-based technique, requires defining the number of clusters beforehand, and each data point is ultimately assigned to one cluster.
- Hierarchical clustering, represented using a dendrogram, offers two methods: agglomerative (bottom-up) and divisive (top-down), providing a detailed view of clusters at various levels.
- Density-based clustering algorithms such as DBSCAN focus on data point density to create clusters of any arbitrary shape and size.
- There are various real-world applications for clustering, ranging from recommendation engines and biomedical engineering to social network analysis and image segmentation.

Explore the platform
Data infrastructure for multimodal AI
Explore product
Explore our products
Agglomerative clustering is a bottom-up approach. Initially, each data point is treated as an individual cluster, which then merges with other clusters based on similarity metrics such as Euclidean distance or cosine similarity.
Density-based clustering techniques can be used in a variety of applications, including cancer subtype classification, location-based services using GIS, and identifying cyber crimes based on anomalies in network traffic data.
The primary hyperparameter for the K-means algorithm is 'K', denoting the number of initial clusters. The second hyperparameter is the distance metric used to compute the similarity between data points.
The onboarding process at Encord involves an initial overview of the products you've purchased, setting timelines and milestones, and organizing sessions to familiarize you with essential information about the platform and how to effectively utilize its features.
When logging into Encord, users are greeted with a landing page where they can access all relevant portions of the platform. The data is organized into folders that mirror the structure of uploaded files, making it easy to navigate through images or videos.
Encord provides advanced filtering and clustering capabilities to improve data organization and retrieval. This helps users manage complex data sets more effectively and ensures that relevant data can be easily accessed and utilized.
Yes, Encord's platform is designed to handle clustering of search queries and data chunks, which is particularly beneficial for teams looking to organize and analyze large datasets efficiently.
