How to Analyze Failure Modes of Object Detection Models for Debugging

Developing models that consistently perform well across various real-world scenarios is a formidable challenge in computer vision. These models often encounter errors and inaccuracies that significantly impact their effectiveness and reliability. Identifying and debugging these errors is a complex process requiring a nuanced understanding of the model's behavior, making it time-consuming and intricate.
Computer vision engineers and researchers grapple with errors that can degrade performance, facing a labor-intensive debugging process that demands a deep dive into model behaviors. The stakes are high, as inefficiencies in this process can impede applications critical to safety and decision-making.
The inability to efficiently debug and analyze model errors can lead to suboptimal model performance, impacting critical applications such as autonomous driving, security surveillance, and medical diagnostics. This not only diminishes the value of the technology but can also have serious implications for safety and decision-making processes based on these models.
Encord Active is a debugging toolkit designed to solve these challenges. It allows a more focused and effective approach to model evaluation and debugging in the computer vision domain. It gives insights into model behavior and makes finding and fixing errors easier through an intuitive and complete set of features.
In this article, you will learn how to use Encord Active to automatically identify and analyze the failure modes of computer vision models. By incorporating Encord Active into your model development process, you have a more efficient debugging process that can help build robust computer vision models capable of performing well in diverse and challenging real-world scenarios.

Why are Traditional Model Metrics no Longer Enough?
One critical concern we see with data and ML teams is figuring out how to detect where their model is struggling and fix the failure patterns to shore up performance problems. They often train a model and perform regular metric calculations (like recall, precision, F1-score, and accuracy). However, these metrics alone cannot detect edge cases or test the model’s robustness for real-world applications.
Taking a more data-centric approach to debugging the model's performance has enabled most computer vision teams to fix errors and deploy robust models.
Let’s see how to find and fix model errors in a data-centric way using Encord Active.
Analyzing Model Errors with Encord Active
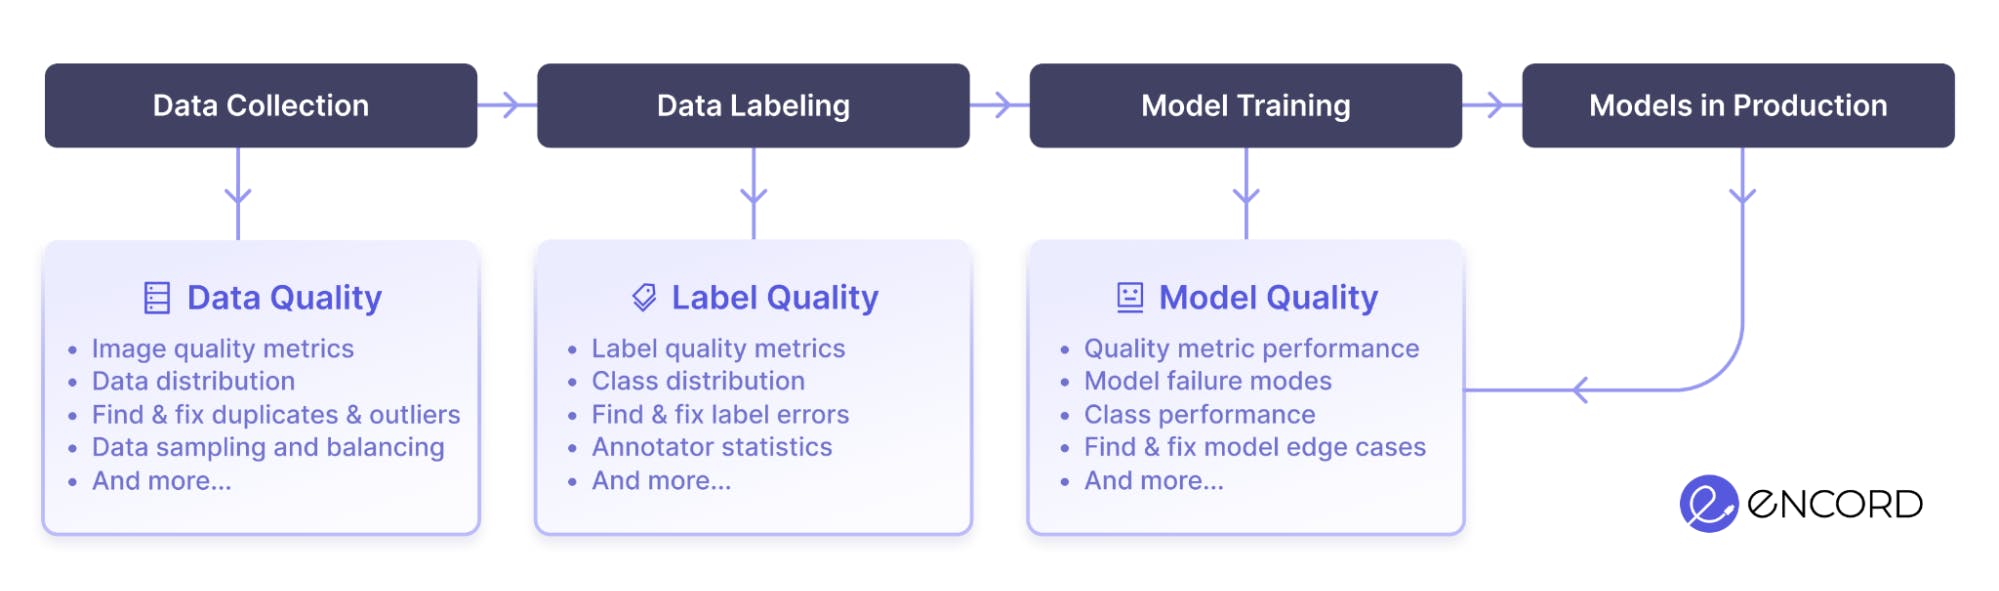
Encord Active helps you understand and improve your data, labels, and models at all stages of your computer vision journey. Beyond finding and fixing label errors through data exploration, it lets you visualize the important performance metrics for your computer vision mode.
Encord Active is available in two versions: Encord Active Cloud and Encord Active OS. Active Cloud and Encord Annotate are natively integrated, with Encord hosting both services. Encord Active OS is an open-source toolkit that you can install on a local computer or server.
Here are the steps we will practically walk through to analyze the model errors in this guide.
- Step 1: Import your Project and Predictions
- Step 2: Evaluate Model Performance
- Step 3: Error Categorization
- Step 4: Quantitative Analysis
- Step 5: Data Distribution Analysis
Step 1: Import your Project and Predictions
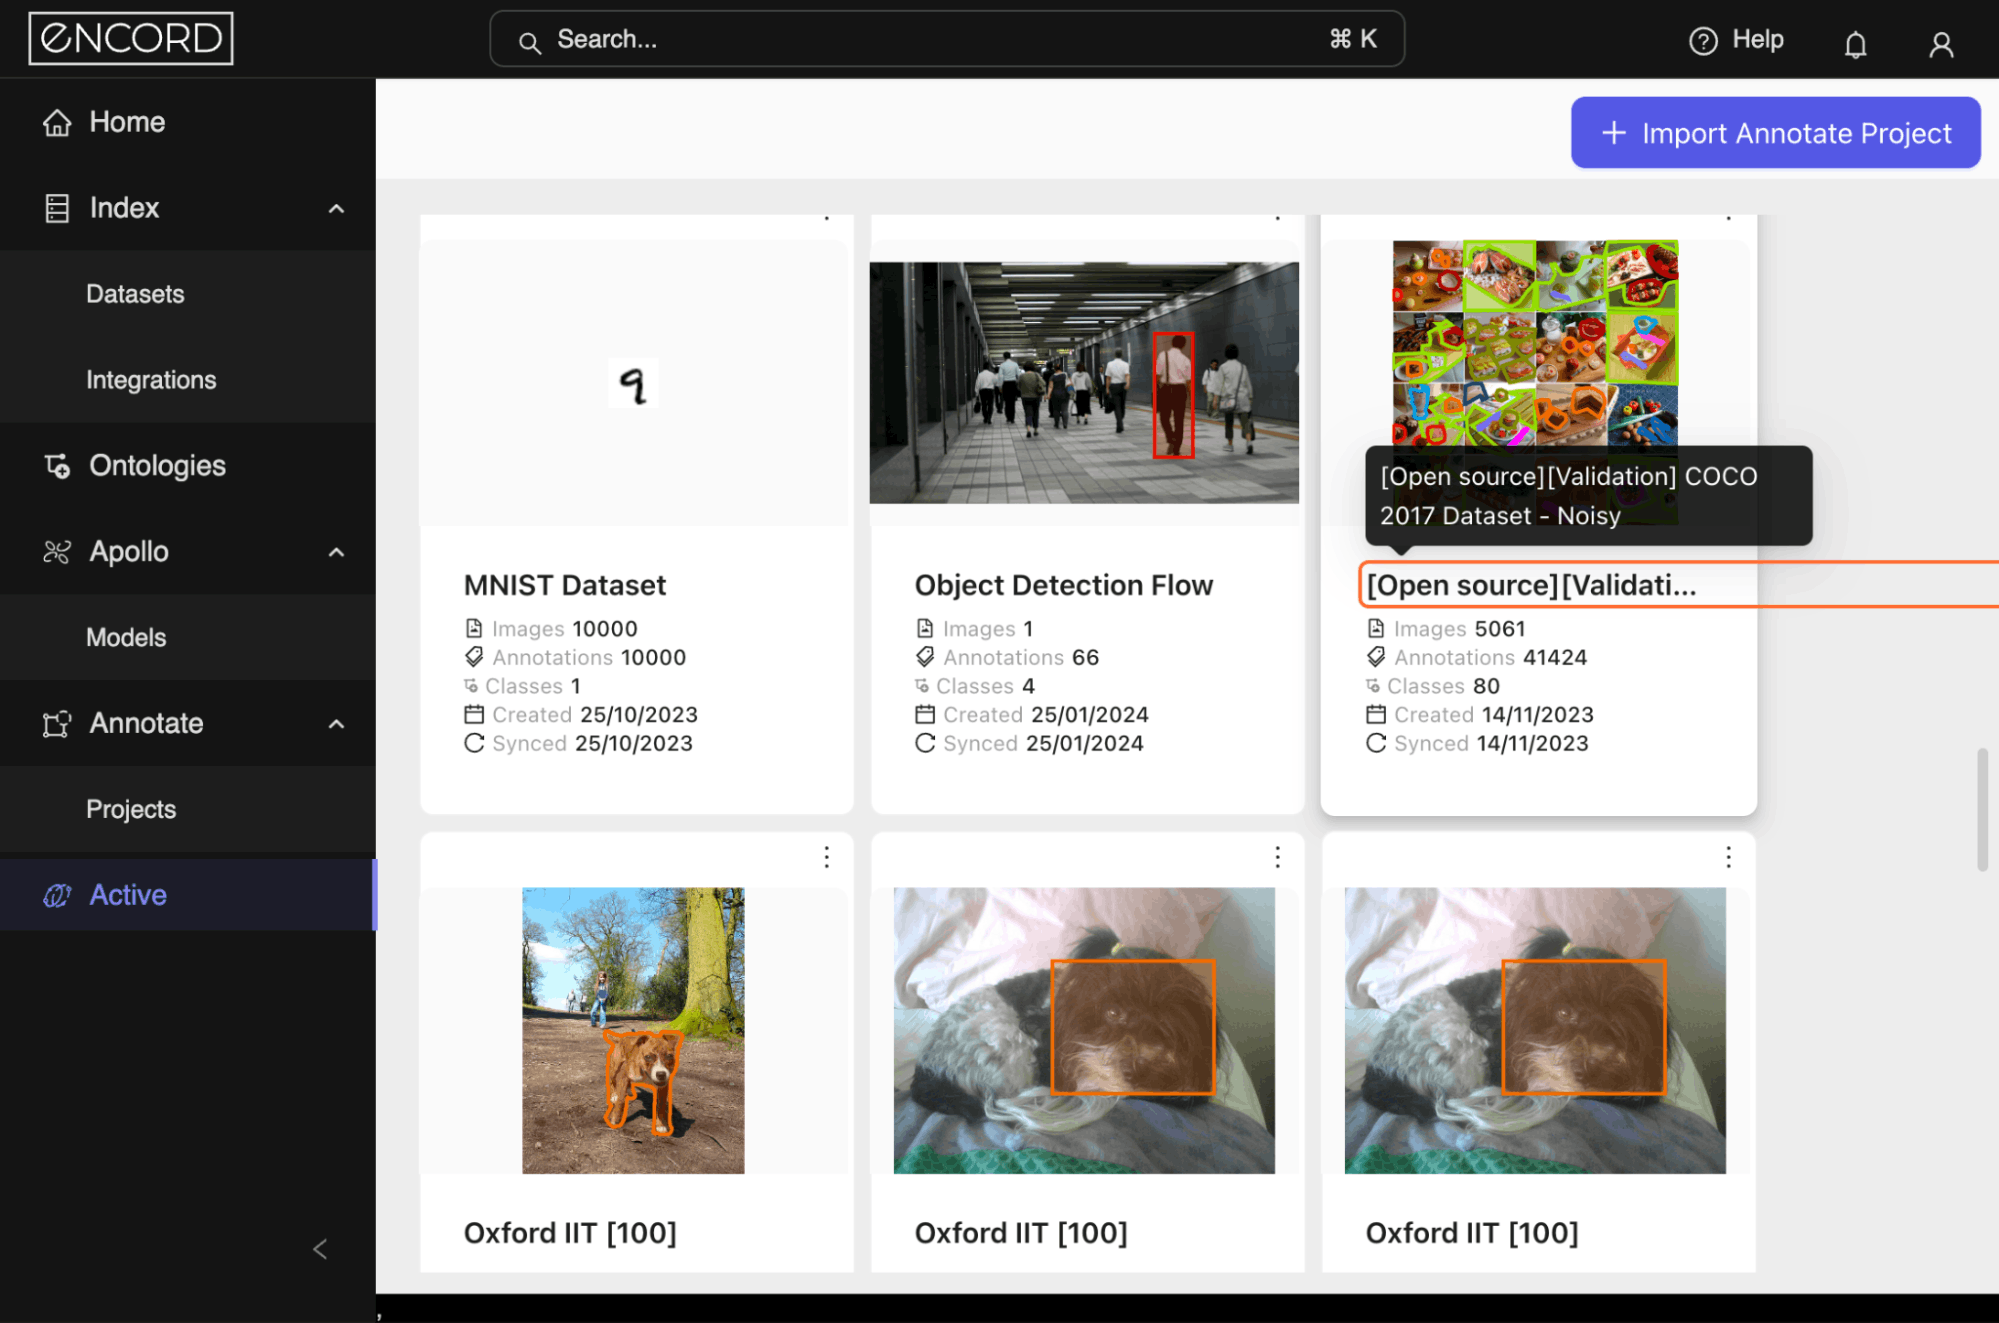
The dataset we use for this guide is COCO 2017. A good place to start using Active is Importing an Annotate Project. From Annotate, you can configure the dataset and ontology for your Project. Once that is done, move to Active.
Select your project to head to Explorer.
Great! The next step is to import your model predictions to Encord Active to analyze model errors. It will automatically provide visualizations to evaluate your model, detect label errors, and provide valuable insights to improve the overall performance of your model.
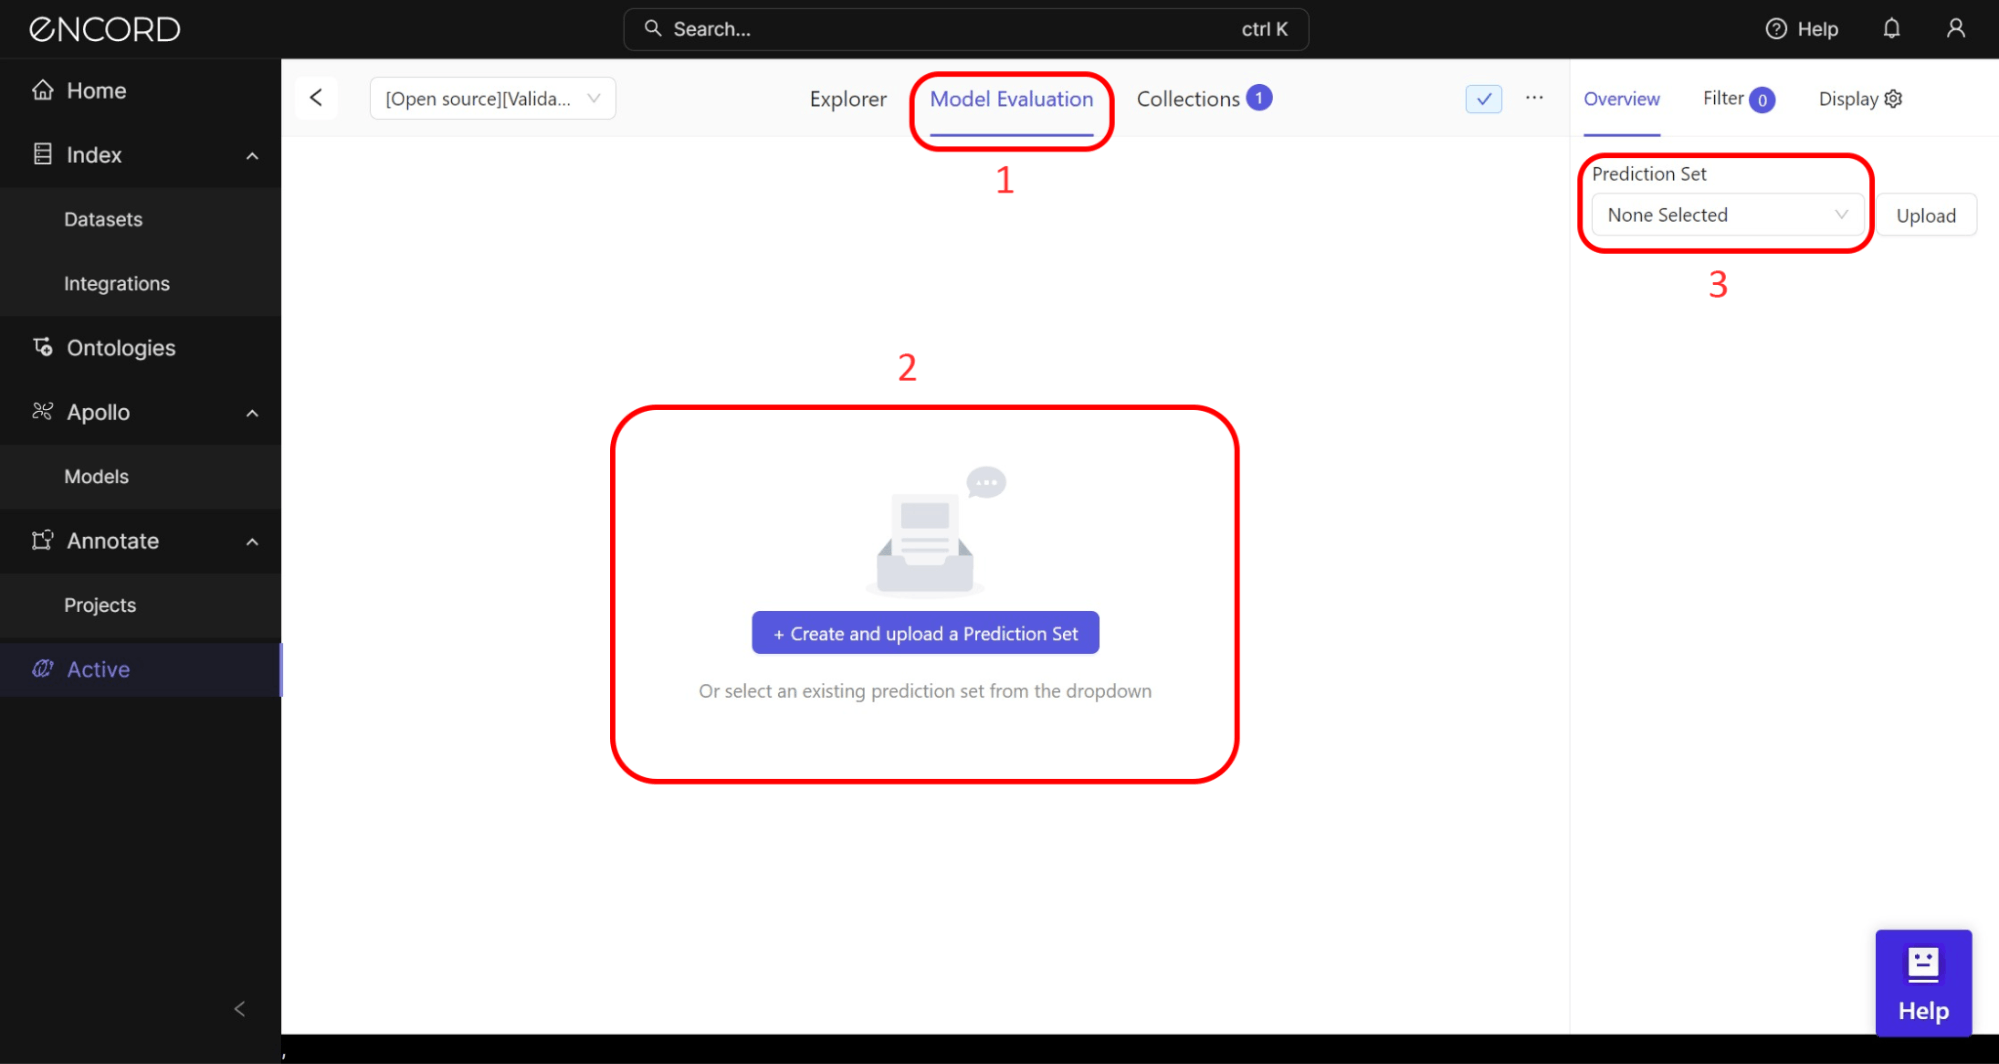
We have trained a Mask-RCNN model for this guide and imported the Predictions file (JSON format). Let’s see how to use the Model Evaluation page to navigate the model's performance and analyze the errors.
Pro tip here? Use your object detection model to make predictions on a validation subset of the dataset. Ensure this subset is diverse and covers various categories, object sizes, and scenes to get a comprehensive view of the model's performance.
Step 2: Evaluate Model Performance
The next step is to evaluate the model's performance using standard object detection metrics such as mean Average Precision (mAP) and Intersection over Union (IoU). These metrics will help us identify overall performance issues but not specific errors.
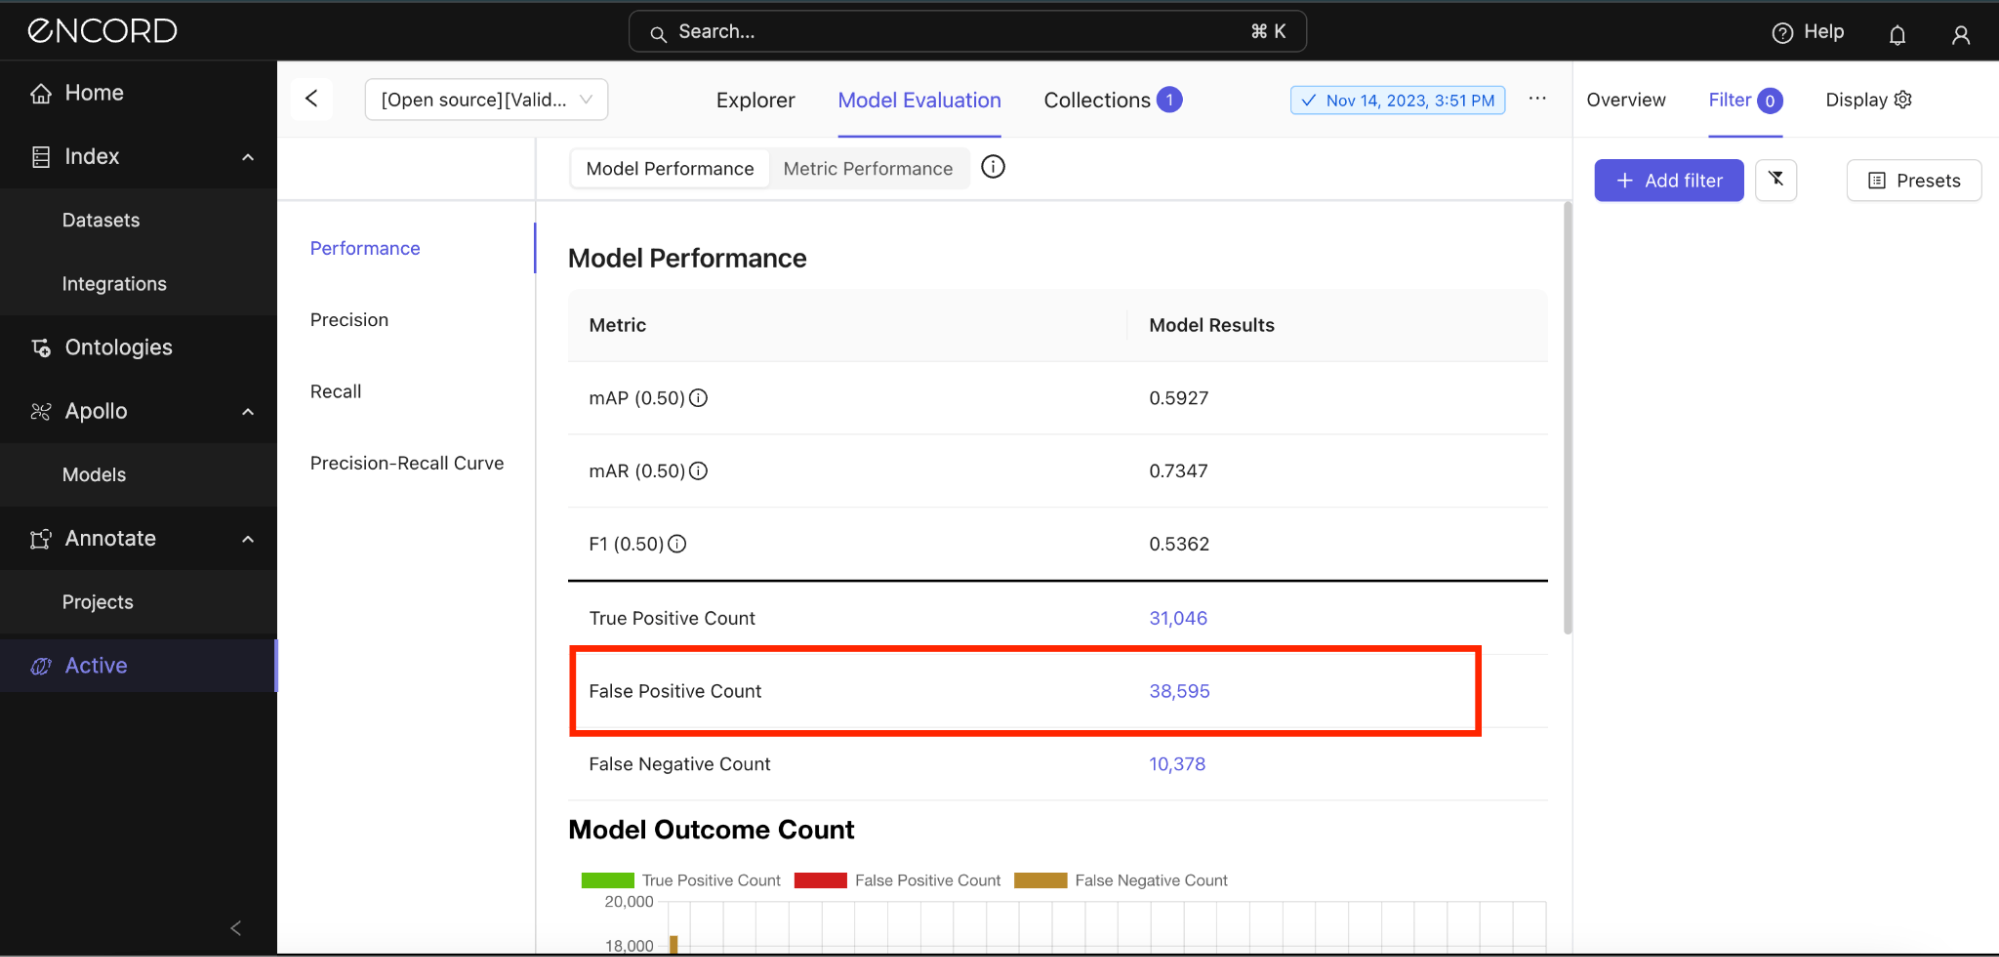
On the Explorer, navigate to the Model Evaluation tab → Model Performance → Performance to see the standard metrics:
[Optional] Interpreting the Standard Metrics
See those metrics and model results? Let’s interpret them:
A mean Average Precision (mAP) of 0.5927 (or 59.27%) at an IoU threshold of 0.5 indicates the model has moderate accuracy in detecting objects on this dataset. Although the model is relatively effective at identifying objects, it has room for improvement, especially in achieving higher precision and recall across all classes. We’ll look at the precision and recall scores in the next section.
A mean Average Recall (mAR) of 0.7347 (or 73.47%) at the same IoU threshold of 0.5 indicates the model's ability to detect a proportion of all relevant instances across all classes. A higher mAR suggests the model is quite good at identifying most of the objects it should, but there might still be missed detections (false negatives) affecting its overall recall.
This should cause you to think back to what your goal for the real-world application is. Would it be appropriate to miss detection if it identifies most objects in the grand scheme? Remember that mAP says the model is only moderately effective at identifying the objects. This is reflected in the F1 score.
An F1 score of 53.62% indicates that, despite the model's relatively high ability to detect pertinent objects (as suggested by mAR), its precision, or the accuracy of these detections, is lower, which lowers the F1 score. The model might be generating too many false positives. We’ll confirm that in the error categorization section.
Step 3: Error Categorization
Based on your observations, classify errors into categories such as:
False Positive and Negative Counts
Still on the Model Performance tab, notice the False Positive Count for this model is 38,595 predictions. No wonder the precision was that low! This implies that our model may have learned incorrect features indicative of certain classes.
This could be due to noise in the training data or an imbalance leading the model to err on the side of making detections too readily. Under Model Outcome Count, let’s see the classes in which the model incurs the most false positive predictions:
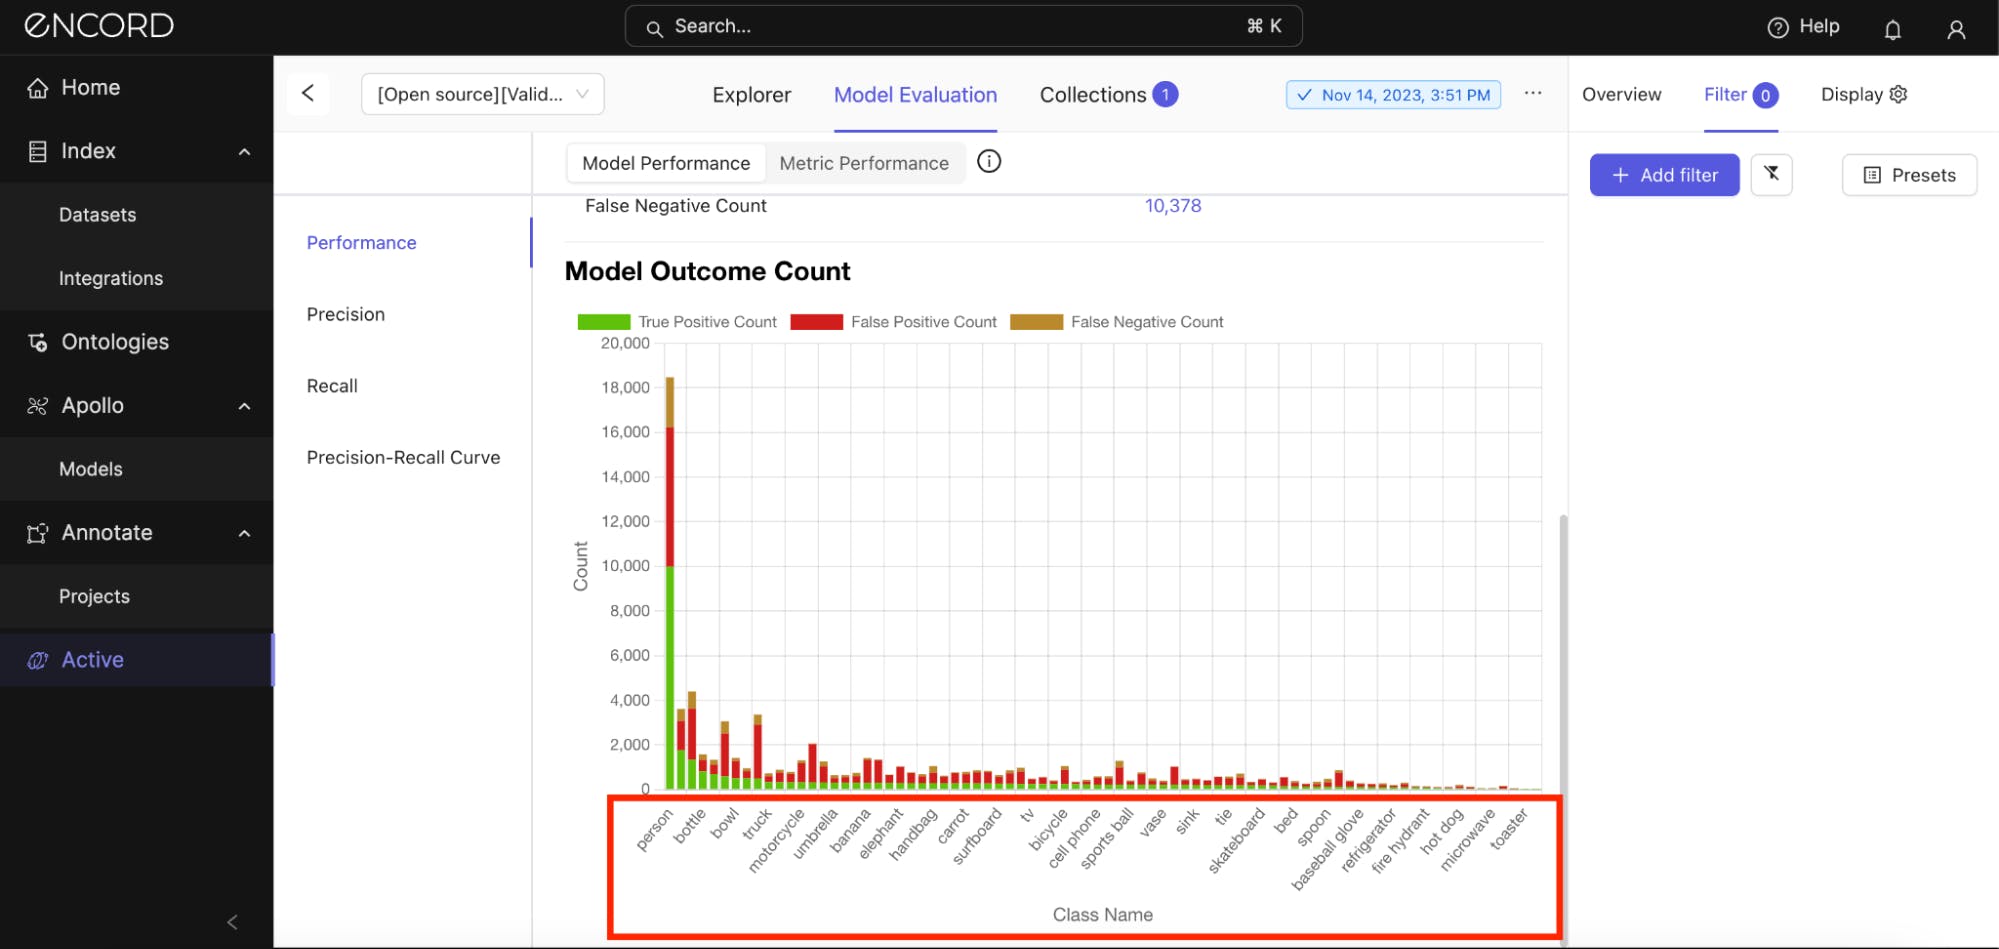
Encord Active suggests that the model incurs the most false positives with the “person” class, but this is expected due to the proportion of the prediction count compared to other classes. So, if you expect your model to perform better in a certain class, you might have to zoom in on that and inspect it.
Under Model Performance → Click False Positive Count → Predictions tab → Add filter → Choose the Class and Prediction IOU (adjust to 0.5) filters:
Great! Manually inspect the predictions alongside their ground truth annotations. Take note of the incorrect classifications (wrong annotations). Click Select Class under the Filter tab to choose a class to inspect specifically.
Use the quality metrics to filter the dataset further: Under Prediction → Choose a quality metric to filter the predictions with:
The goal for you here is to look for error patterns. Are certain object sizes (Absolute Area), classes, or scenarios (e.g., occlusions, varying lighting conditions) more prone to errors? What about duplicates? Is the model likely to detect the same object more than once in an instance? This analysis can help pinpoint specific weaknesses in the model.
When you conclude, repeat the same process for the False Negative Count metric if you are optimizing to identify predictions that the model missed detections of objects that are present. Filter by the Missing Objects metric.
Localization Errors (Correct class but incorrect bounding box position or size)
Here, you are looking for instances (predictions) where the model correctly identifies the presence of an object but inaccurately predicts its bounding box. This can mean the box is too large, small, poorly positioned, or improperly shaped relative to the object.
There are metrics to check for localization errors within EA:
- Border Proximity: Rank annotations by how close they are to image borders.
- Broken Object Tracks: Identify broken object tracks based on object overlaps.
- Inconsistent Object Classification: Looks for overlapping objects with different classes (across frames).
- Label Duplicates: Rank labels by how likely they are to represent the same object.
- Object Classification Quality: Compare object annotations against similar image crops.
- Polygon Shape Anomaly: Calculate potential outliers by polygon shape.
Let’s use two metrics: Under Prediction → Choose Inconsistent Object Classification and Track → Sort by Descending Order → Expand one of the instances to inspect the error:
Such errors suggest issues with how the model perceives object boundaries. This might be due to inadequate feature extraction capabilities that fail to capture the precise contours of objects or a mismatch between the scale of objects in the training data and those in the validation or real-world scenarios.
Also, check for:
- Classification Errors: Errors that arise when the model detects an object but assigns it an incorrect label.
- Confusion with Similar Classes: Errors observed when the model confuses objects between similar classes, mislabeling them in the process.
Step 4: Quantitative Analysis
If you need more help identifying which classes are most problematic, use error analysis features such as the metric impact on the model’s performance, precision and recall by metric chart, and precision-recall curves for each class within EA.
First off, the metric impact on model performance.
Visualizing the Impact of Metrics on Model Performance
Encord Active applies quality metrics to your data, labels, and model predictions to assess their quality and rank them accordingly. EA uses these metrics to analyze and decompose your data, labels, and predictions.
It ships with pre-built quality metrics, but you can also define custom quality metrics for indexing your data, labels, and predictions.
Navigate to the Model Evaluation tab → Metric Performance:
The longest orange bar indicates that the confidence metric impacts the model's performance the most. This indicates that the confidence scores the model assigns to its predictions are strongly correlated with the precision of those predictions.
Zoom into a specific metric (say, height) you want to assess using the Precision By Metric chart. Under Metric → Label/Height and Label/Width:
The visualization shows a drop in precision once the model starts to predict instances with heights and widths > 500 pixels. Toggle on the Show Model Outcome Count option for a nuanced view with error categorizations (True Positive Count, False Negative Count, and False Positive Count).
Switch to Recall to analyze the average recall of the model by the quality metrics.
Precision and Outcome Count Chart
Under the Model Evaluation tab → Toggle back to the Model Performance tab → Precision. We have looked at the mean Average Precision (mAP) earlier, but here, you can inspect the average precision per class and the model outcome count:
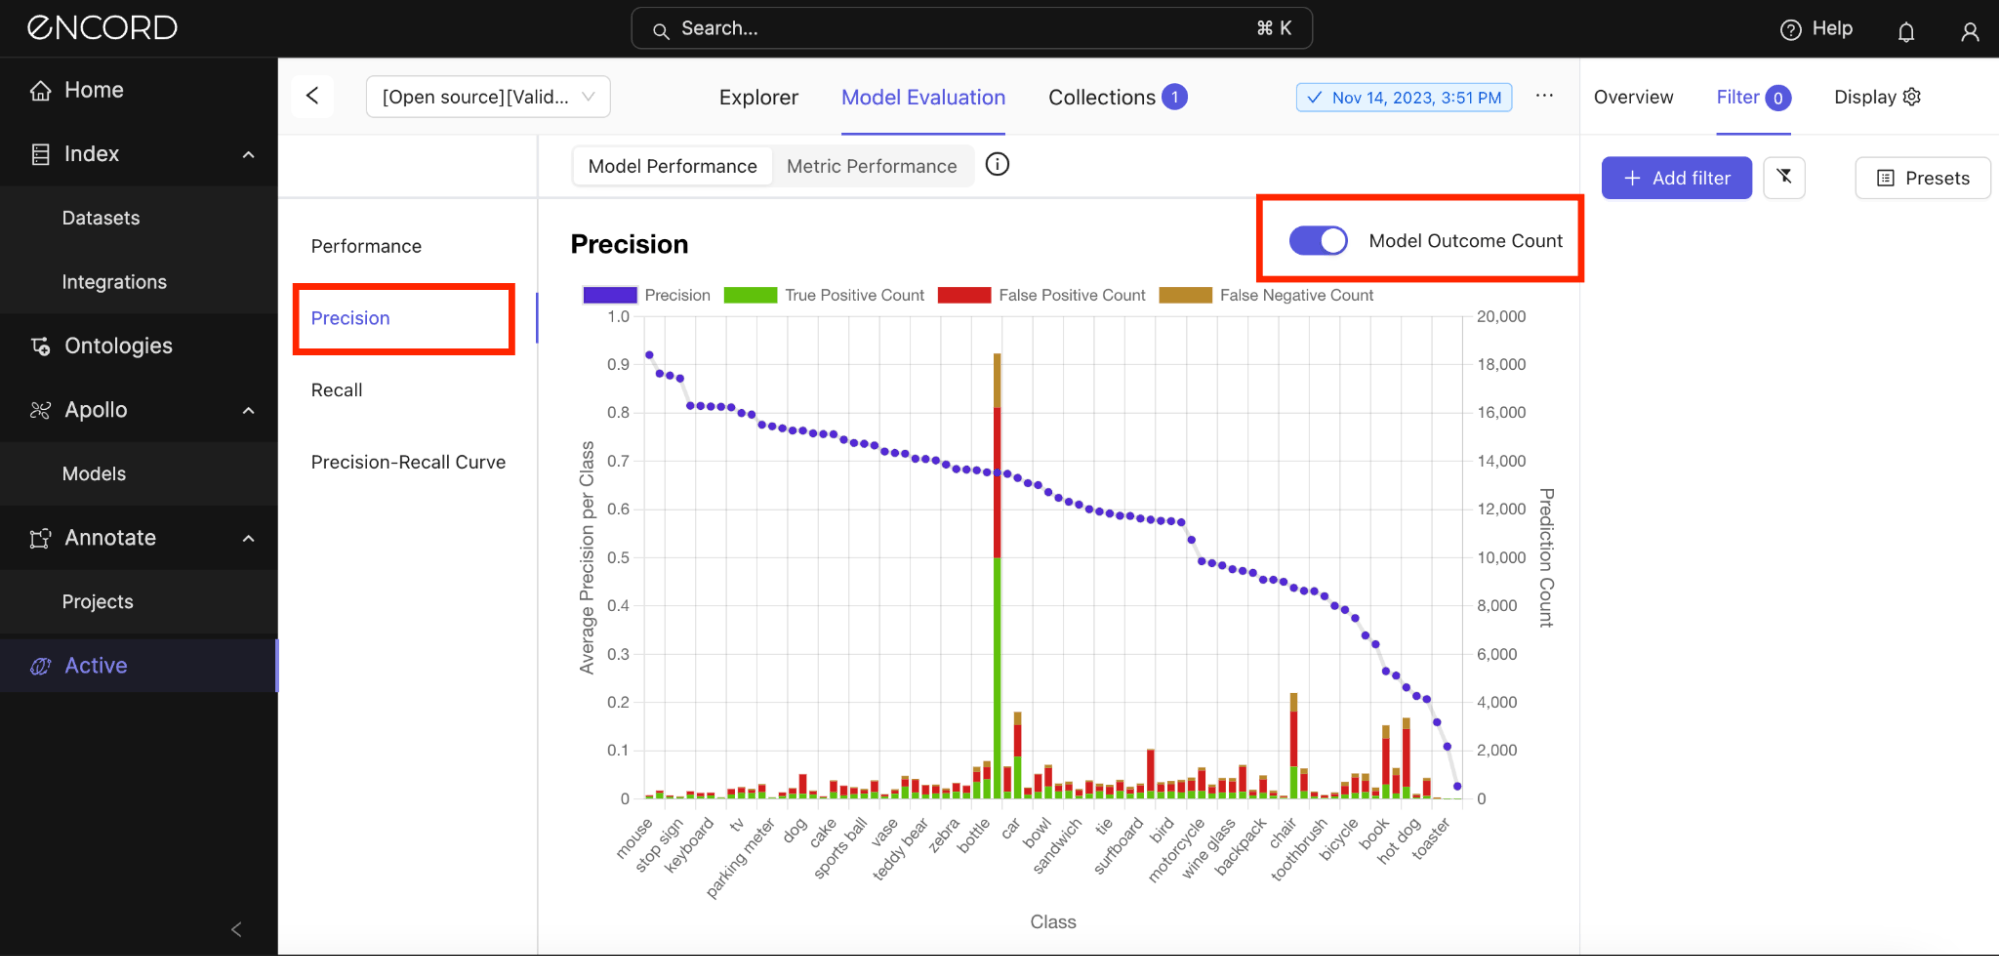
There is a notable variance in precision across classes, which indicates that the model's performance is not uniform. From all indications, this, in part, is due to a class imbalance in the training data, varying difficulty distinguishing certain classes, and the different amounts of training data available for each class.
Check the same analysis under the Recall tab:
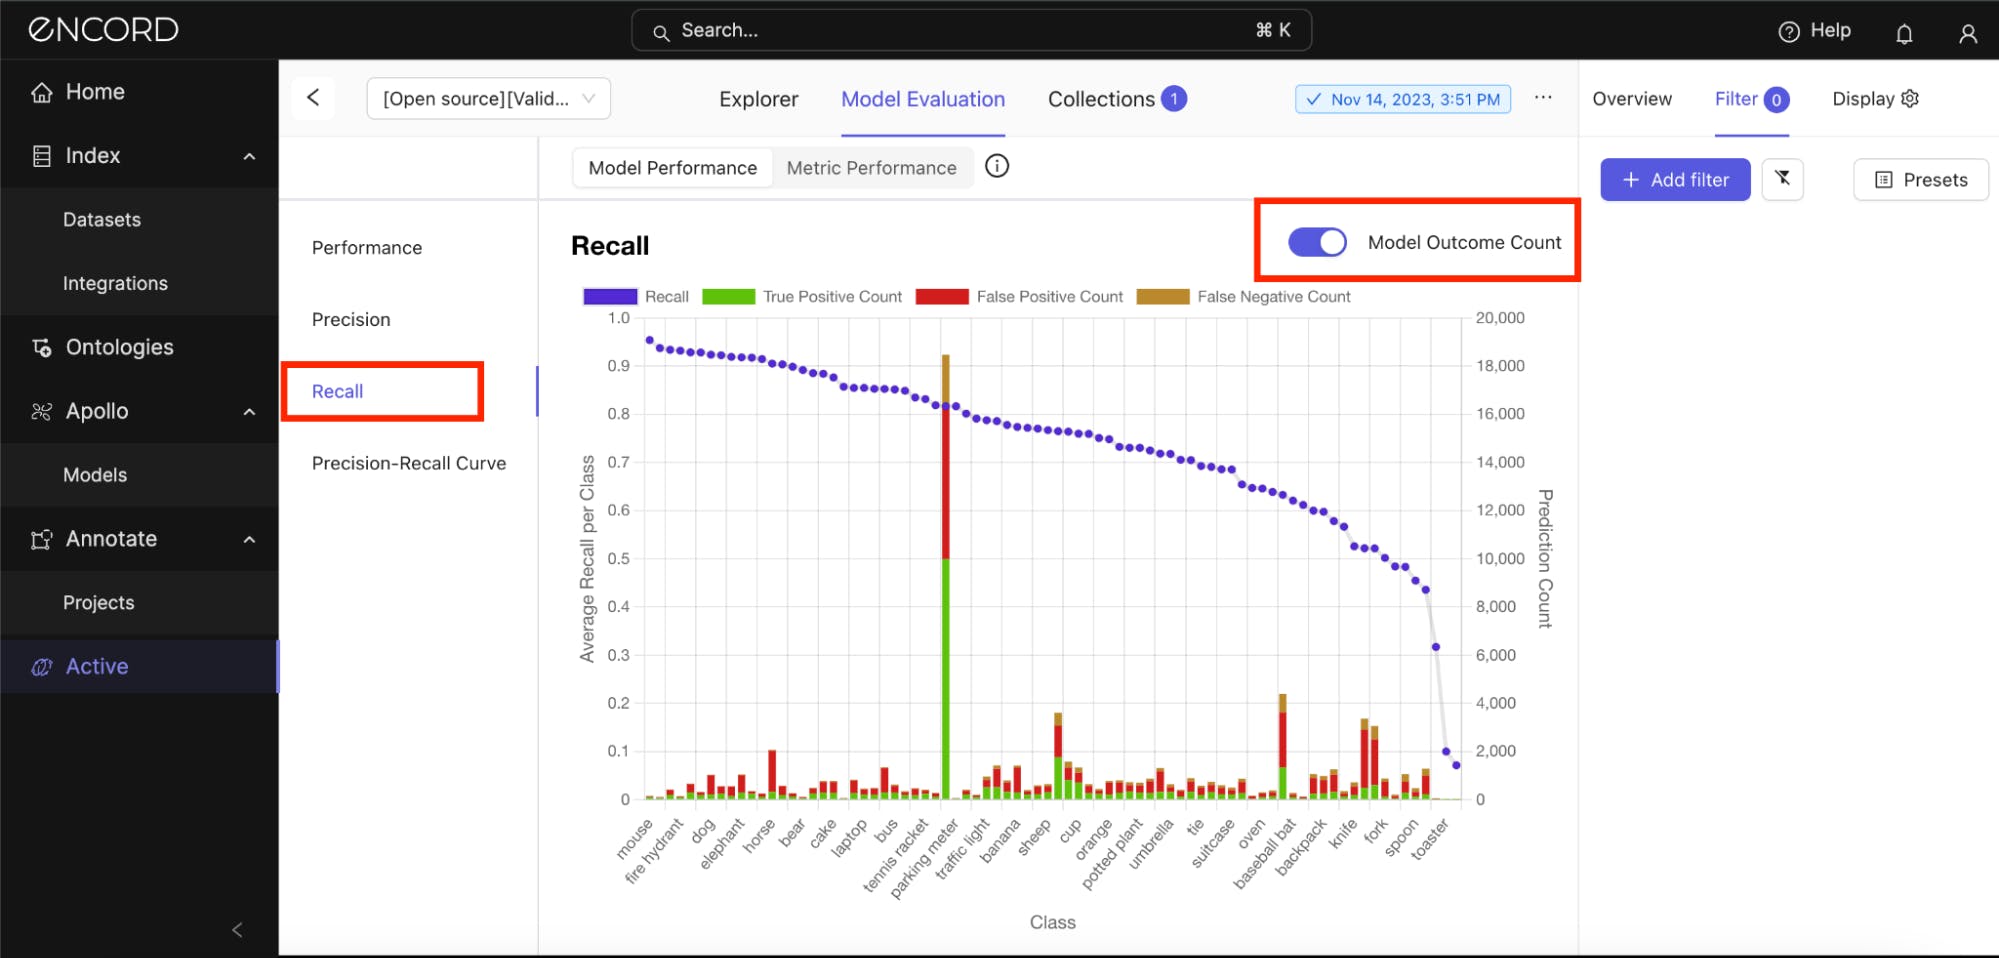
The blue line is close to 1 for many classes, indicating that the recall across most classes appears quite high. This suggests that the model is generally effective at detecting instances of these classes when they are present in the data.
The blue line dipping near the bottom of the chart indicates that "scissors," "toaster," and "hairdryer" are some of the classes with a very low recall (close to 0). This means the model is missing most instances of these classes, a significant concern for model performance.
Precision-Recall Curves
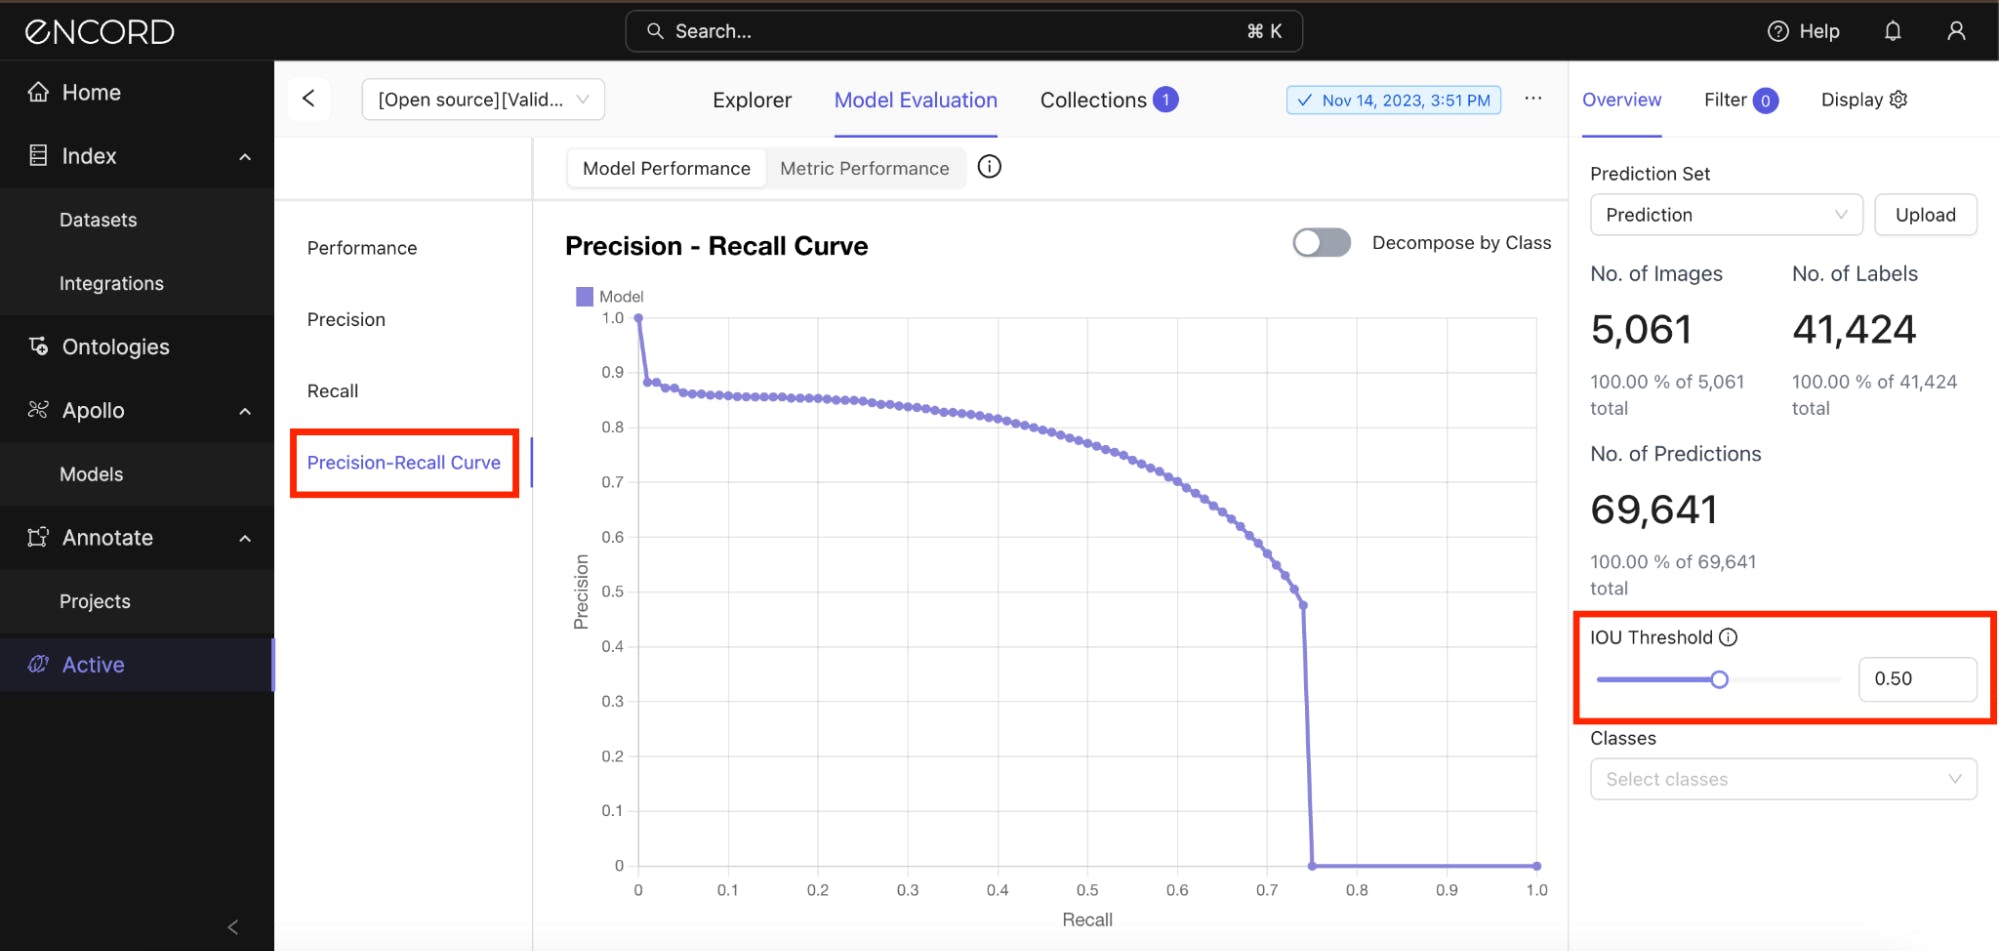
Precision-recall curves for each class reveal the trade-off between precision and recall at various IOU threshold settings. Analyzing these curves class by class can highlight which classes are harder for the model to detect with high confidence.
Under Model Performance tab → Precision-Recall Curve → Use the slide to set the IOU Threshold value:
You can also analyze the precision-recall trade-off for all the classes. Toggle the Decompose by Class option on and adjust the slider to balance between leniency and strictness on spatial accuracy:
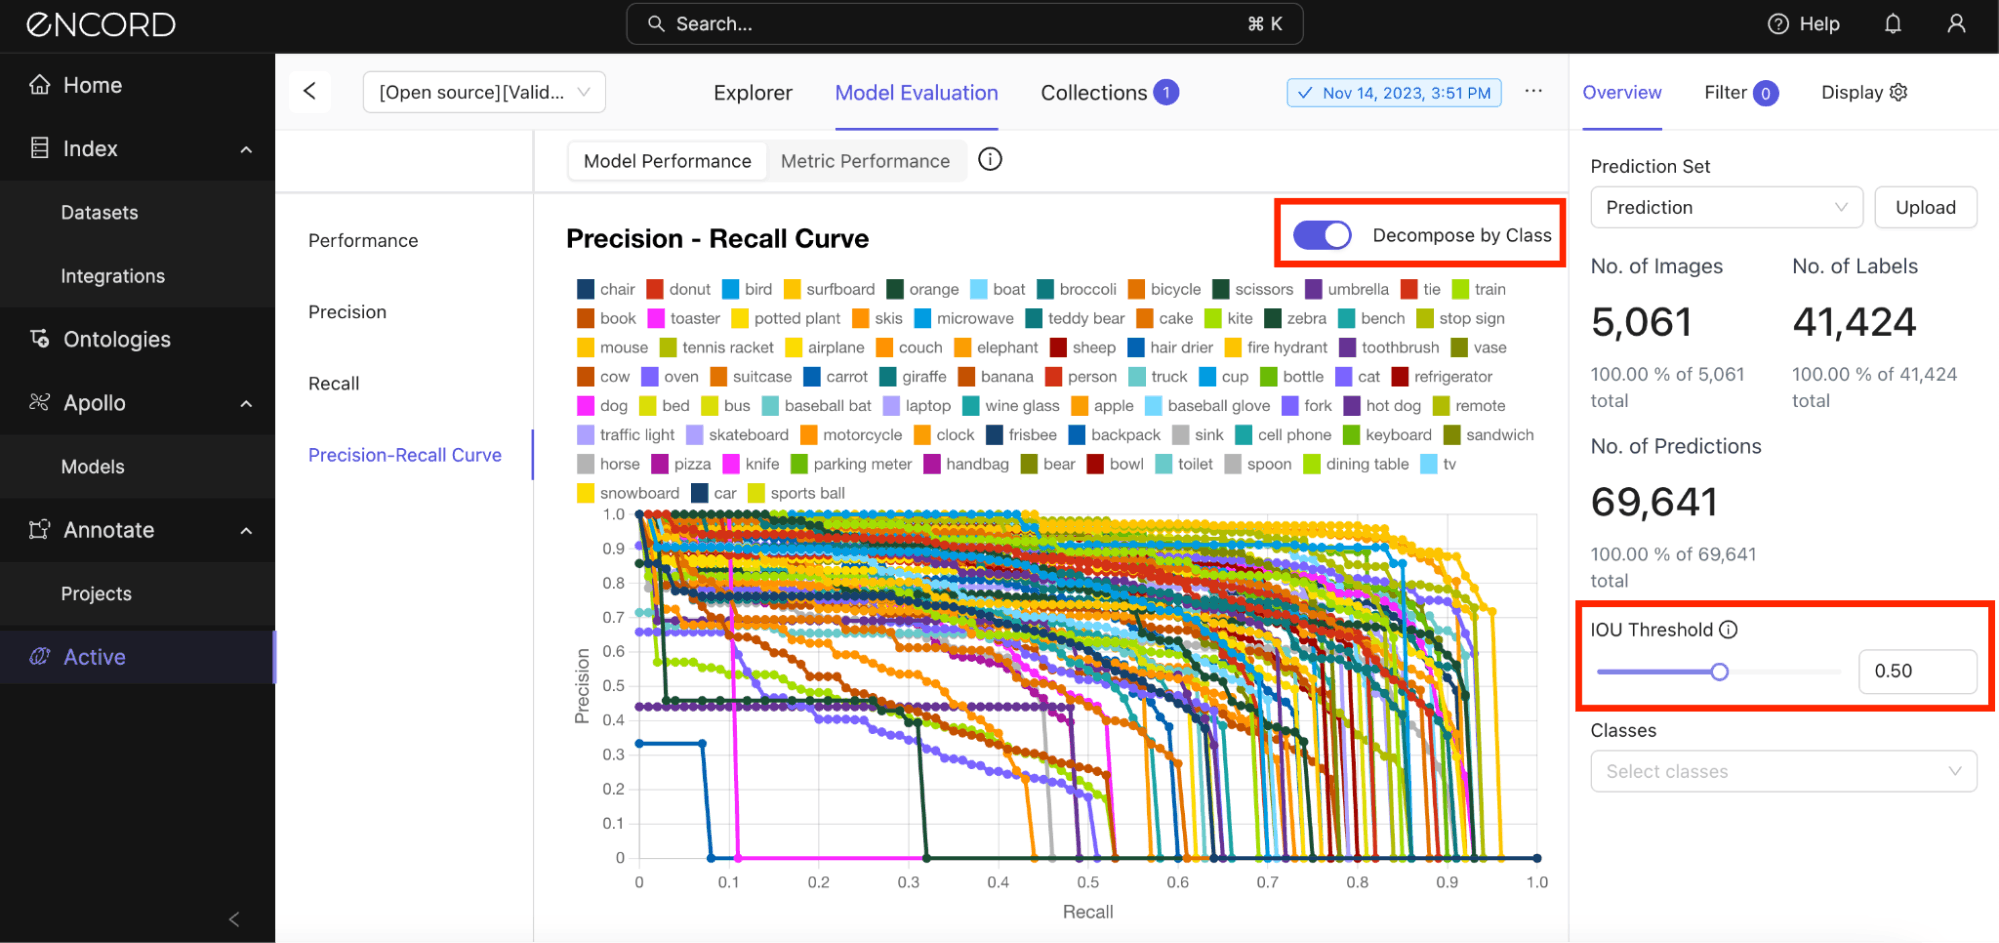
If there are specific classes you want to analyze, you can select them under the Classes dropdown box → Toggle on Decompose by Class:
Use the insights from these curves to guide how you optimize the class-specific detection thresholds. This way, you can improve overall model performance by balancing precision and recall according to the specific requirements of each class.
Step 5: Data Distribution Analysis
You can also analyze the distribution of classes, object sizes, and scenarios in your training data. Imbalances or insufficient representation of certain cases can lead to higher error rates for those categories.
Navigate to the Explorer tab → Data view → Filter → Add filter → Class:
Here are other analyses you could carry out here:
- Size Inclusion in Training: Ensuring the training data includes a variety of object sizes and implementing multi-scale training techniques can improve detection across different object sizes.
- Variety in Object Conditions: Objects can appear in various conditions, such as different lighting, occlusions, and backgrounds. A lack of diversity in these scenarios can lead to a model that performs well only under the specific conditions it was trained on.
- Understanding Context: The context in which objects appear can provide additional cues for accurate detection. For example, certain objects are more likely to be found indoors versus outdoors, and some objects are typically found in proximity to others.
A holistic data distribution analysis can uncover biases and gaps in the training dataset that may lead to certain prediction errors your model makes.
Next Steps: Troubleshooting the Errors
Now that you have diagnosed the model issues with the potential fixes we discussed earlier, what do you do next? Here are some steps:
- Focus on Problem Areas: Once you’ve identified error patterns, focus on these areas for further analysis. For example, if small objects are often missed, inspect how such objects are represented in the dataset and whether the model’s architecture can detect small features.
- Formulate Hypotheses: Based on your analysis, formulate hypotheses on why certain errors occur. This could involve feature representation, anchor box sizes, or training data quality.
- Experiment: Make targeted changes based on your hypotheses, such as adjusting the model architecture, re-balancing the training data, re-training the model on the data segment it performs poorly on, or using specific data augmentation techniques.
- Validate Changes: Re-evaluate the model on the validation subset to see if the changes have reduced the specific errors you identified.
- Iterative Improvement: Finding and fixing errors in object detection models is an iterative process. Repeating the steps of error identification, hypothesis testing, and validation can improve model performance.
Debugging with Encord Active
Encord Active (EA) is a data-centric debugging platform that offers a wide range of features to assist computer vision teams with efficiently debugging their models. Here are some key capabilities of EA:
- Interactive Debugging: Encord Active provides visualization tools, an explorer, and model-assisted features for interactive debugging where you can explore model predictions step by step. You can inspect the model's errors, see how it performs on data segments, and use quality metrics to assess how well the models generalize at the class level.
- Explainability: EA computes metric performance and importance for model predictions, so you can get insights into why the model made a specific decision
- Anomaly Detection: Encord Active can automatically detect anomalies and outliers in your data, helping you identify data quality issues that may affect your model's performance.
- Collaboration: Encord Active supports collaboration among team members, enabling multiple stakeholders to collaborate on identifying model errors and getting insights to improve machine learning models.
- Integration with Encord Annotate: EA natively integrates with Encord Annotate, the computer vision data annotation tool many computer vision teams use. Easily sync your project to Annotate and directly edit images within Annotate without moving across platforms or tools.
Key Takeaways:
In this guide, we identified and analyzed the failure modes of an object detection model based on its prediction errors. We trained a Mask R-CNN model on the COCO 2017 dataset and validated it on a subset of that dataset. We went through five analysis steps and potential fixes to the model errors.
Debugging in machine learning is an intricate process, much like detective work. It's critical for making your models work correctly and for various strategic and technical reasons.
Here's a recap of the error analysis steps we discussed in this guide:
- Step 1: Import your Project and Predictions
- Step 2: Evaluate Model Performance
- Step 3: Error Categorization
- Step 4: Quantitative Analysis
- Step 5: Data Distribution Analysis
Frequently asked questions
Yes, Encord is equipped to help improve the accuracy of ball and player detection models through robust data labeling and model training capabilities. The platform supports iterative model improvements by allowing teams to gather feedback and refine their models based on real-world performance.
Encord provides tools to investigate specific metrics impacting model performance, such as vertical location and object count. Users can drill down to analyze areas where performance dipped, helping to identify and rectify issues effectively.
Yes, Encord includes a module for model evaluation that helps teams understand failure modes and identify areas causing poor model performance. This feature is crucial for improving model accuracy and reliability in real-world applications.
Encord includes features for comparing different versions of model predictions against ground truths, enabling users to identify areas where models perform well or poorly. This helps teams to continuously improve their AI models.
Encord provides advanced damage detection models tailored for automotive applications. These models can identify major body damage, dents, and scratches, helping dealerships effectively communicate repair needs to customers.