Exploring the RarePlanes Dataset

RarePlanes is an open-source machine learning dataset that incorporates both real and synthetically generated satellite imagery. The RarePlanes dataset is built using high-resolution data to test the value of synthetic data from an overhead perspective.
This dataset showcases the value of synthetic data and how it aids computer vision algorithms in their ability to automatically detect aircraft and their attributes in satellite imagery. Before we discuss the RarePlanes dataset and build the aircraft detection model, let’s have a look at the importance of synthetic data in computer vision.

Importance of Synthetic data
Building a computer vision algorithm requires a large amount of annotated data. However, developing such datasets is often labor-intensive, time-consuming, and costly to create.
The alternative approach to manually annotating training data is to either use platforms that automatically annotate the data or to create computer-generated images and annotations.
These computer-generated images and annotations are known as synthetic data. Synthetic data has become increasingly important in the field of computer vision for numerous reasons:
- Data Scarcity: One of the biggest challenges in computer vision is the availability of sufficient training data. Synthetic data can be generated quickly and in large quantities, providing researchers and developers with the data they need to train and test their models.
- Data Variety: Real-world data can be limited in terms of its variety and diversity, making it difficult to train models that are robust to different scenarios. Synthetic data can be generated to include a wide variety of conditions and scenarios, allowing models to be trained on a more diverse range of data.
- Data Quality: Real-world data can be noisy and contain errors, which can negatively impact model performance. Synthetic data can be generated with a high level of precision and control, resulting in cleaner and more accurate data.
- Cost-effectiveness: Collecting real-world data can be time-consuming and expensive, particularly for complex tasks such as object detection or semantic segmentation. Synthetic data can be generated at a fraction of the cost of collecting real-world data, making it an attractive option for researchers and developers.
So, we see that synthetic data has become an important tool in computer vision, enabling researchers and developers to train and test models more effectively and efficiently, and helping to overcome some of the challenges associated with real-world data.
Pairing synthetic data with real datasets helps to improve the accuracy and diversity of the training data, which in turn can improve the performance and robustness of machine learning models. Additionally, using synthetic data can help to overcome limitations and biases in real-world data, and can be particularly useful in cases where real data is scarce or expensive to collect. One such example is the RarePlanes dataset. It is made up of both synthetic and real-world datasets.

Let’s analyze the RarePlanes dataset and know more about it! We will use Encord Active to analyze the dataset, the labels, and the model predictions. In the end, you will be able to know how to analyze a dataset and how to build a robust computer vision model.
RarePlanes Dataset
RarePlanes is the largest open-source very-high-resolution dataset from CosmiQ Works and AI.Reverie. It incorporates both real and synthetically generated satellite imagery.
A large portion of the dataset consists of 253 Maxar WorldView-3 satellite scenes spanning 112 locations and 2,142 km^2 with 14,700 hand-annotated aircraft. The accompanying synthetic dataset contains 50,000 synthetic images with ~630,000 aircraft annotations.
The aircraft classes that both the synthetic and real datasets contain are:
- aircraft length
- Wingspan
- Wing-shape
- Wing-position
- Wingspan class
- Propulsion
- Number of engines
- Number of vertical-stabilizers
- Presence of canards
- Aircraft role.
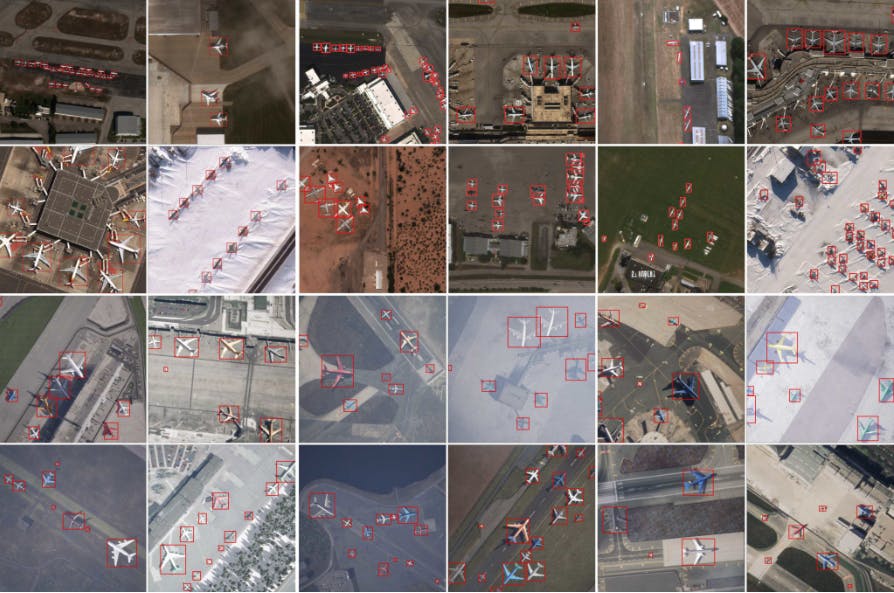
One of the unique features of the RarePlanes dataset is that it includes images of rare and unusual aircraft that are not commonly found in other aerial datasets, such as military surveillance drones and experimental aircraft. This makes it a valuable resource for researchers and developers working on object detection in aerial imagery, particularly for applications such as border surveillance, disaster response, and military reconnaissance.
About the Dataset
- Research Paper: RarePlanes: Synthetic Data Takes Flight
- Authors: Jacob Shermeyer, Thomas Hossler, Adam Van Etten, Daniel Hogan, Ryan Lewis, Daeil Kim
- Dataset Size: 14,707 real and 629,551 synthetic annotations of aircraft
- Categories: 10
- License: CC-4.0-BY-SA license
- Release: 4 June 2020
- Github: Rareplanes
- Webpage: RarePlanes webpage link, RarePlanes public user guide
Downloading the Dataset
So, let’s download the dataset using the instruction from the Rareplanes webpage. It mentions that the dataset is available for free download through Amazon Web Services’ Open Data Program. In this, we will download the RarePlanes dataset using Encord Active!
Installing Encord Active
You can find the installation guide for Encord Active on the documentation page.
In order to install Encord, you have to first make sure you have python3.9 installed on your system. Now, follow through the following commands to install Encord Active:
$ python3.9 -m venv ea-venv
$ # On Linux/MacOS
$ source ea-venv/bin/activate
$ # On Windows
$ ea-venv\Scripts\activate
(ea-venv)$ python -m pip install encord-active
To check if Encord Active has been installed, run:
$ encord-active --help
Now, that you have Encord installed, let’s download the dataset by running the command:
$ encord-active download
The script will ask you to choose a project, navigate the options ↑ and ↓ to select the RarePlanes dataset and hit enter.
Easy! Now, you got your data. In order to visualize your data in the browser run the command:
cd /path/to/downloaded/project
encord-active visualise
The image below shows the webpage that opens in your browser showing the data and its properties. Let’s analyze the properties we can visualize.
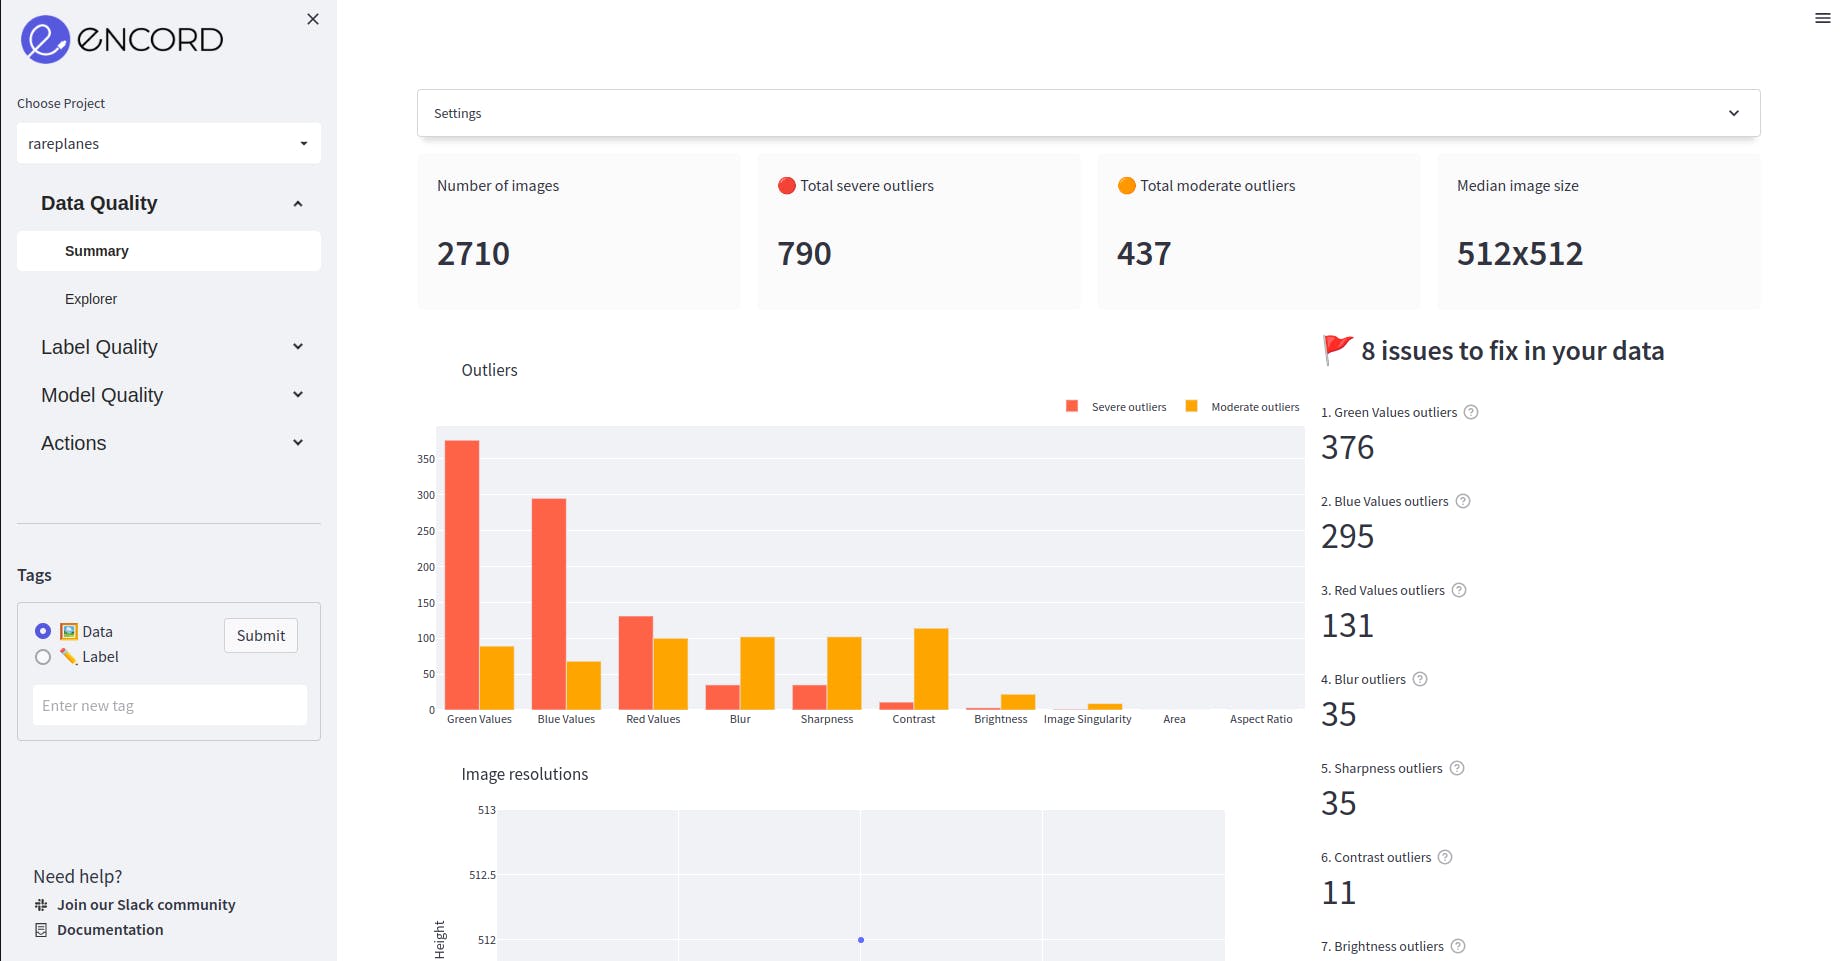
Fig: Visualize the data in your browser
Preliminary Analysis of the Dataset
The Encord Active platform has features for you to analyze the data quality and the label quality. Let’s analyze the dataset.
Understanding Data Quality
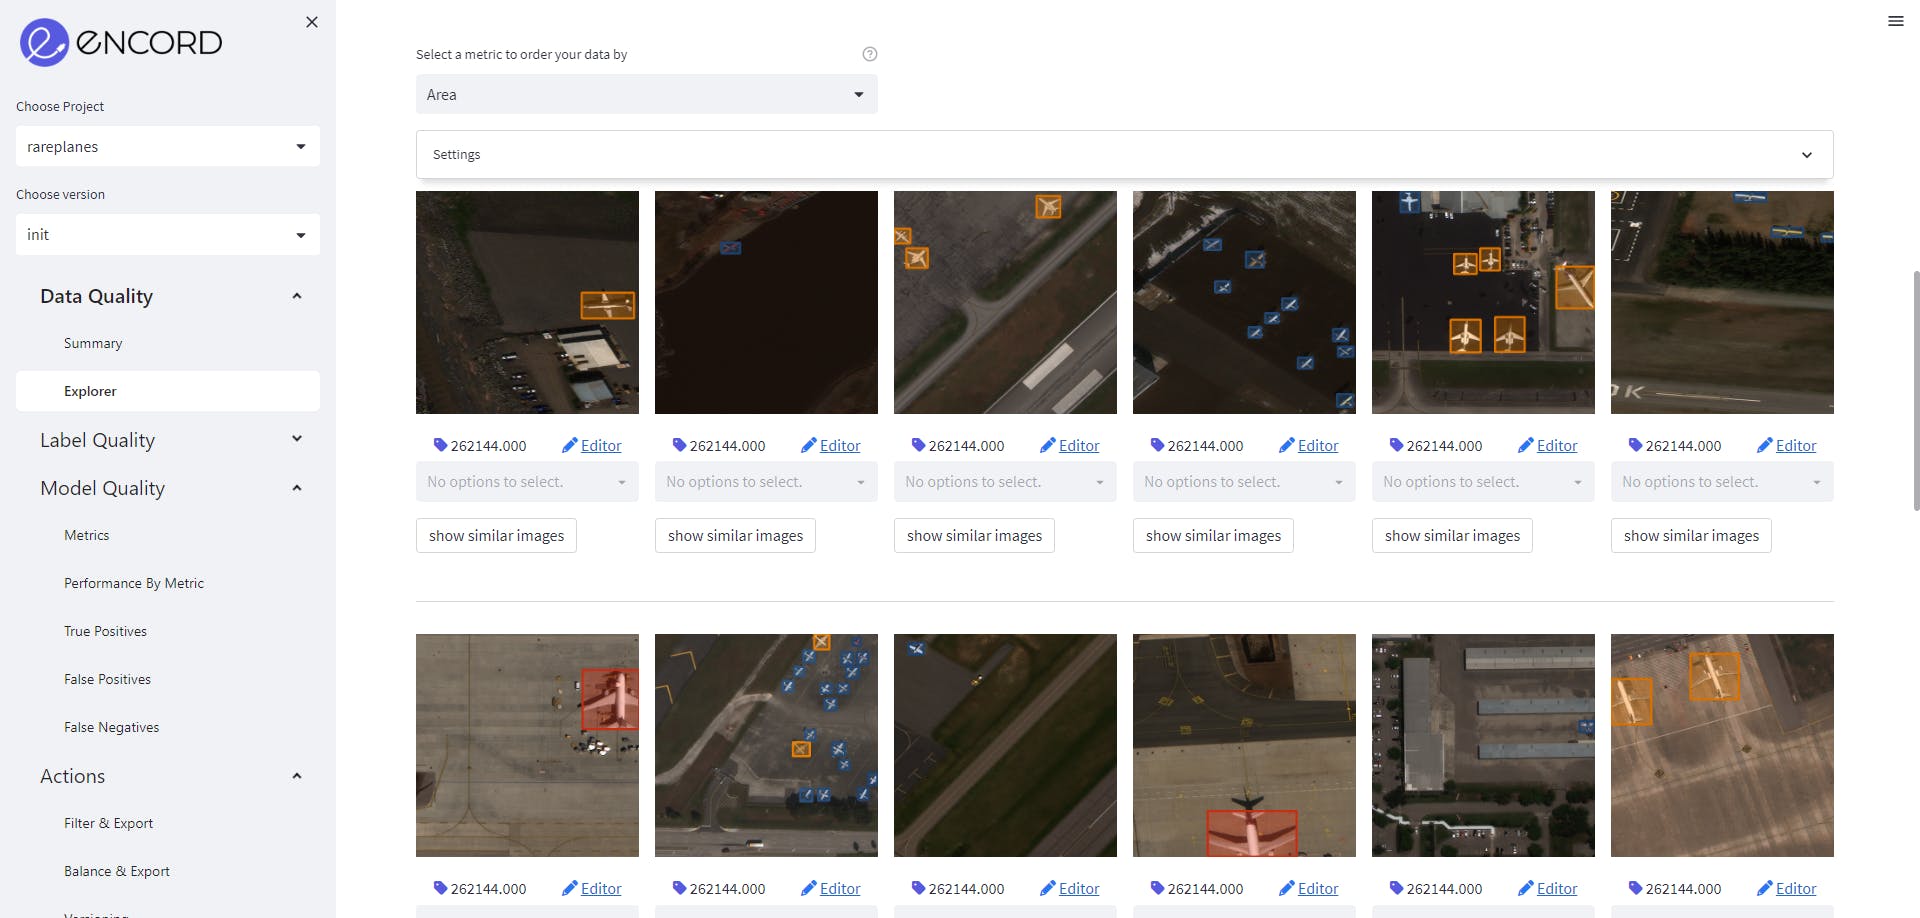
First, we navigate to the Data Quality →Explorer tab and check out the distribution of samples with respect to different image-level metrics.
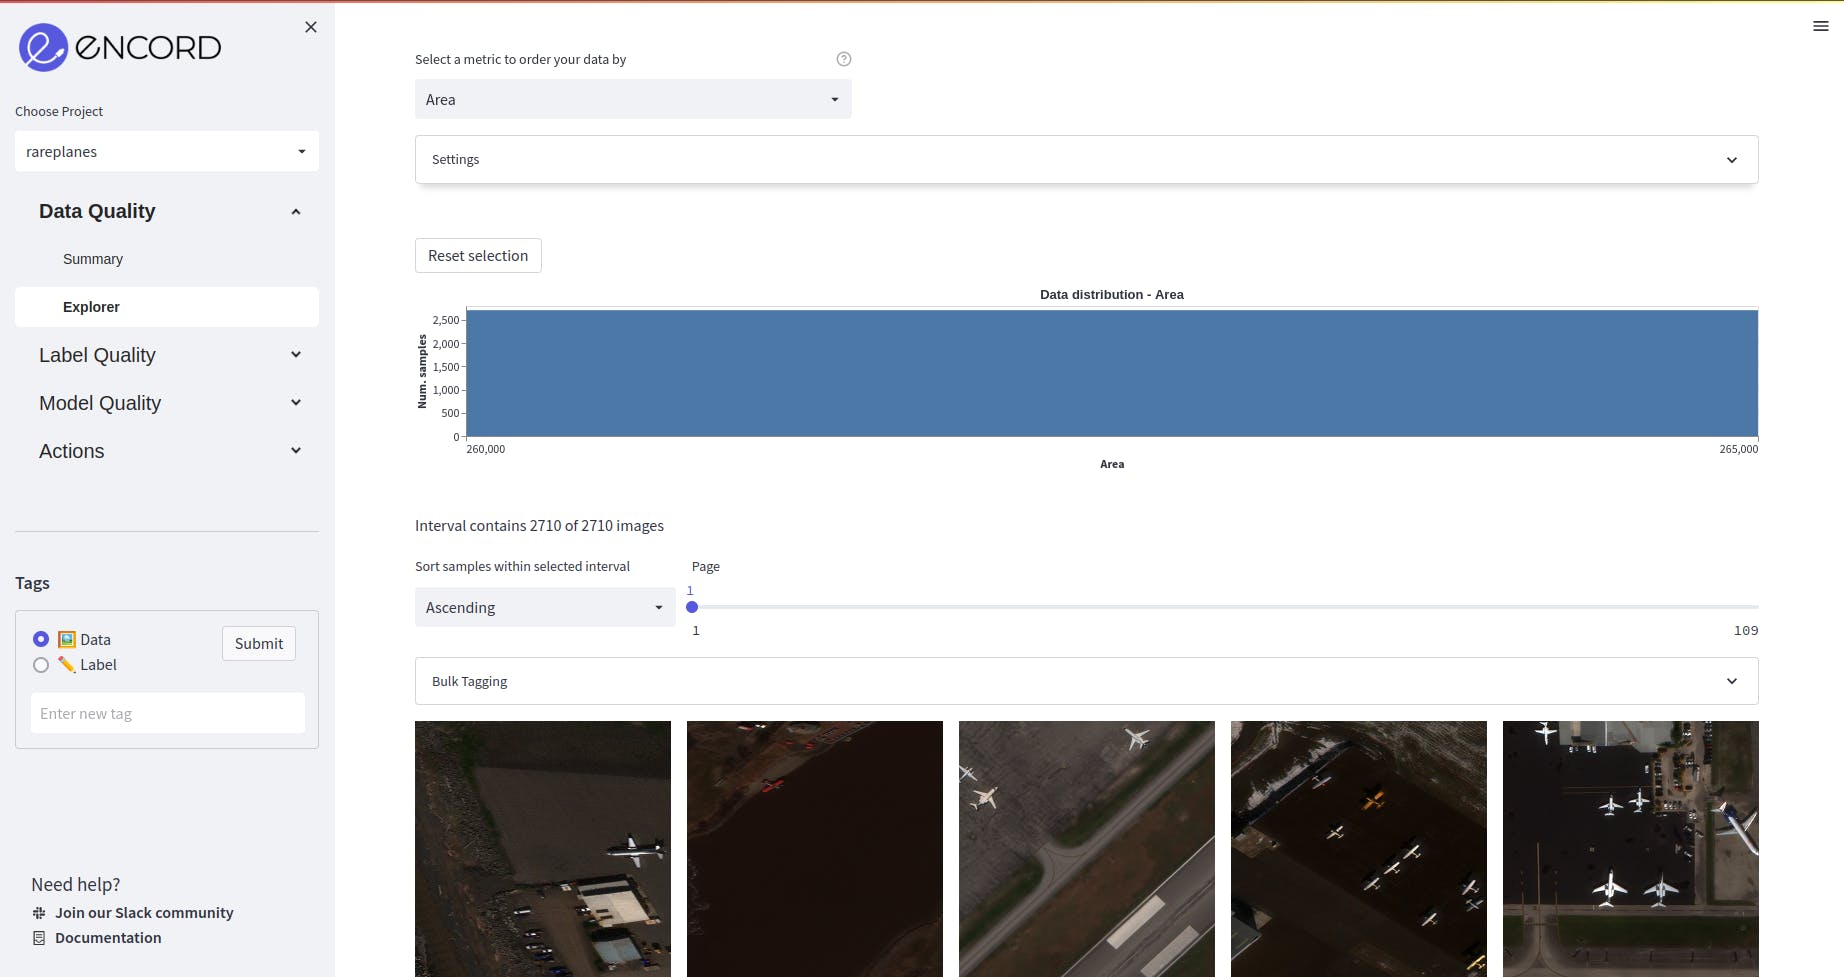
Fig: Explorer tab of Data quality
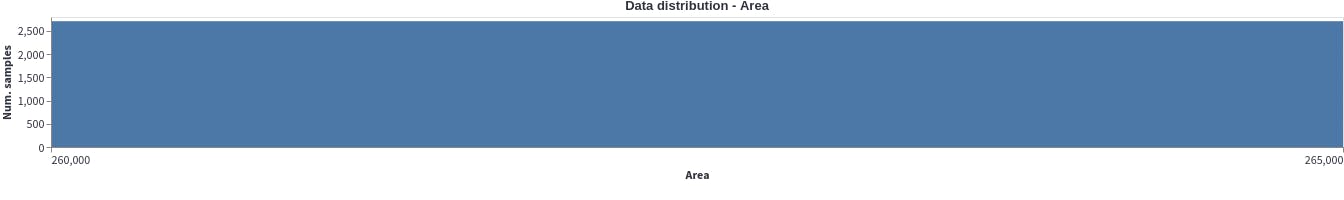
Area
The distribution of area of the images in the dataset is even and constant since a large percentage of the dataset is generated synthetically. Hence, this would not require much attention during the data pre-processing.
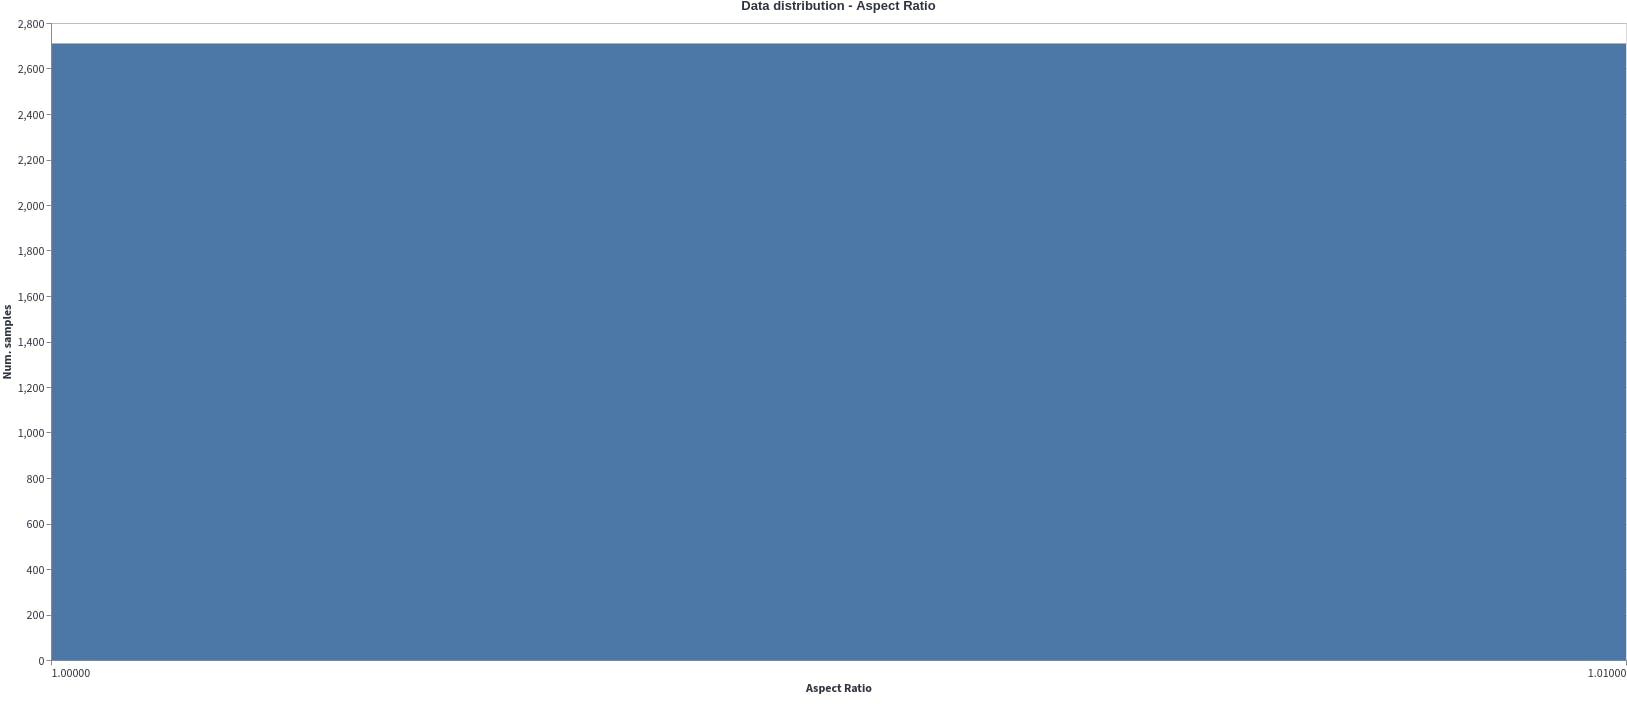
Aspect Ratio
The aspect ratio of the dataset varies from 1 to 1.01 which means there isn’t much variation in the size of the image throughout the dataset. The aspect ratio of the images is computed as the ratio of image width to image height. Since it is very close to 1, it means the images are square in shape. Since the images are constant, it is very likely that all the images in the dataset have been taken from a single source. So, the images don’t need to be resized during the data preparation process.
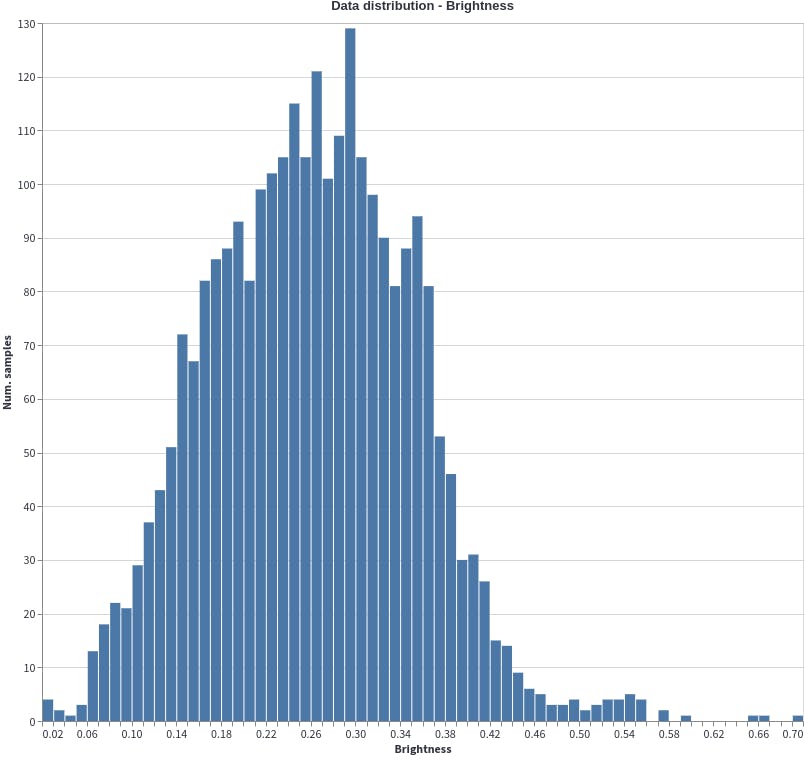
Brightness
The brightness of the images is evenly distributed with the median being at 0.3 brightness. In the data distribution plot below, it can be seen that there are a few outliers from 0.66-0.69. These must be investigated to check their quality and then decide if they are needed during data preparation. Even distribution of the dataset ensures that the detection model will learn to recognise these objects in a wide range of brightness levels. This is necessary when dealing with real-world dataset where the brightness of the surrounding is not controlled. Since the distribution is even, the model will be able to detect the airplanes even when it is very sunny or shadowed because of clouds.
Understanding Label Quality
Understanding the label quality of an annotated dataset is crucial when building a machine learning model. Investigating the label quality of an annotated dataset refers to the accuracy and consistency of these labels. The accuracy of the computer vision model is highly dependent on the label quality. Having a clear understanding of the label quality and identifying issues earlier allows the team to avoid bias and save time and cost in the long run. Let’s have a look at a few of the quality metrics which can be used to understand label quality:
Label Quality
To analyze label quality with Encord Active, Go to the label Quality→Explorer tab and analyze the object-level metrics here:
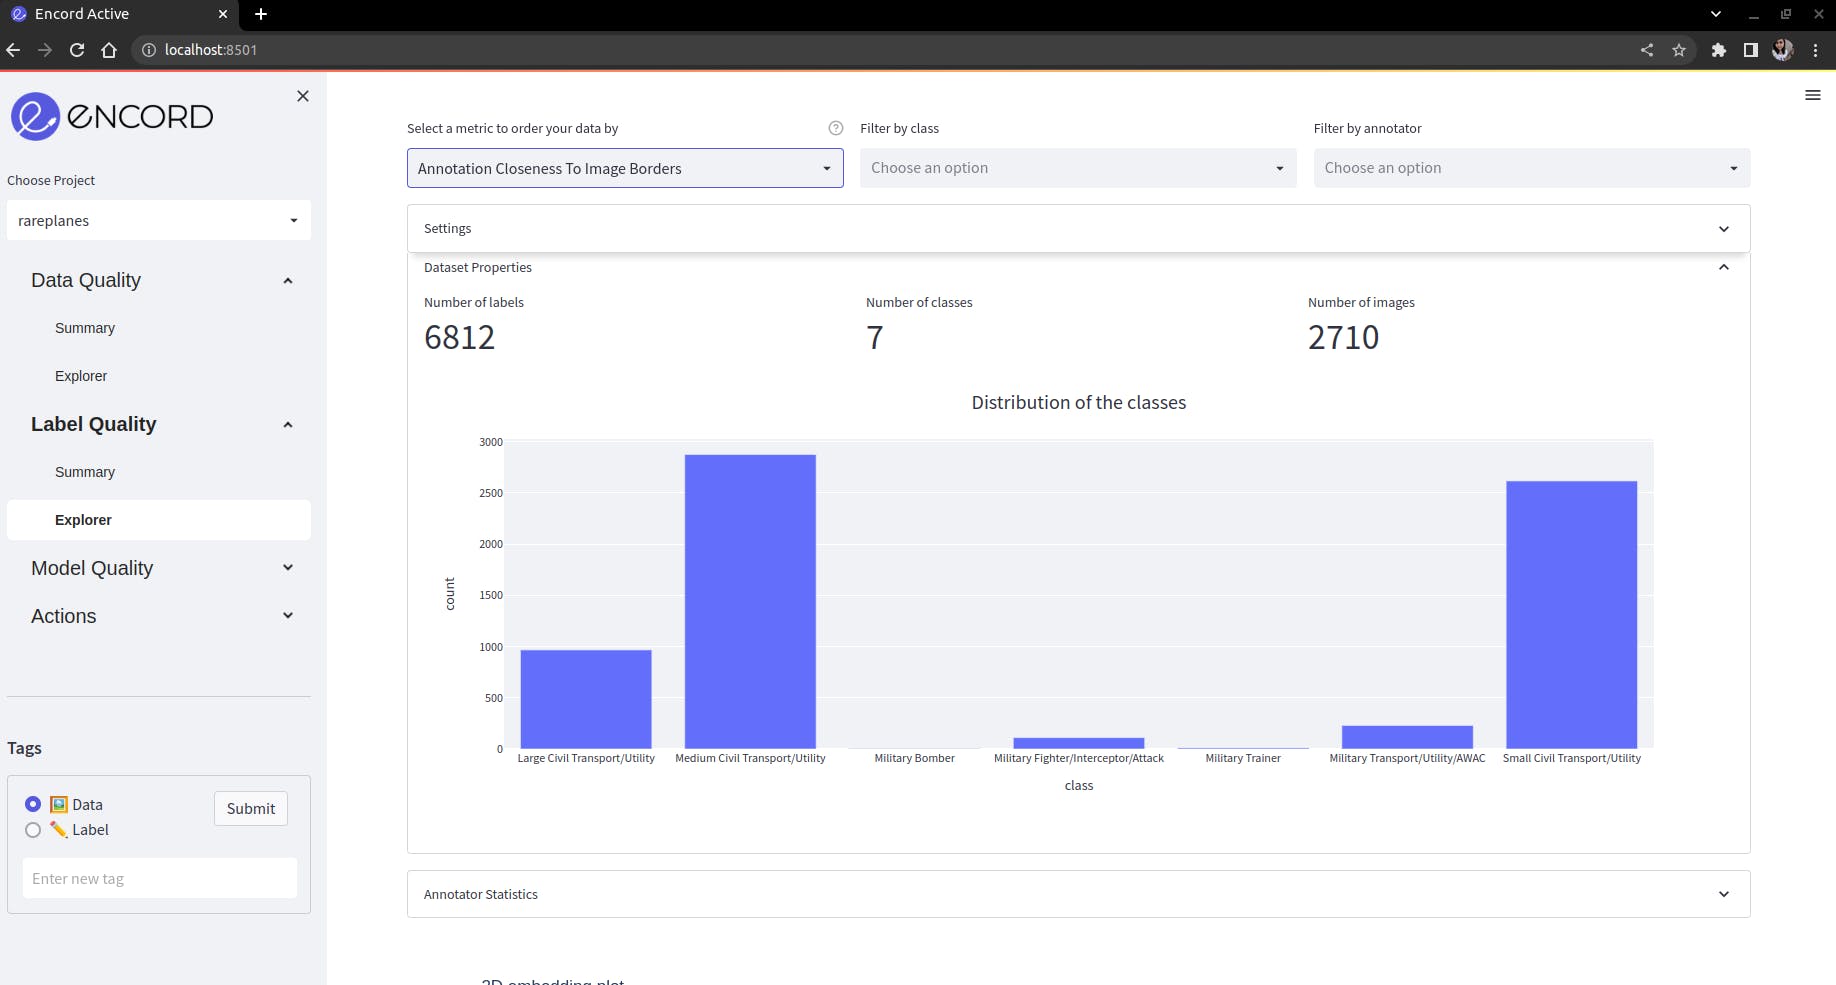
Class Distribution
In total, there are 6812 annotations for 7 classes. It is clear that there is a high class imbalance with 2 classes having only 10 annotations while two of them have more than 2500 annotations.High class imbalance should be resolved because it can lead to biased and inaccurate detection model. The model will learn to overfit to the majority class and will not be able to detect the minority classes. Additionally, high class imbalance can result in reduced model interpretability and transparency, making it difficult to identify and mitigate potential errors or biases.
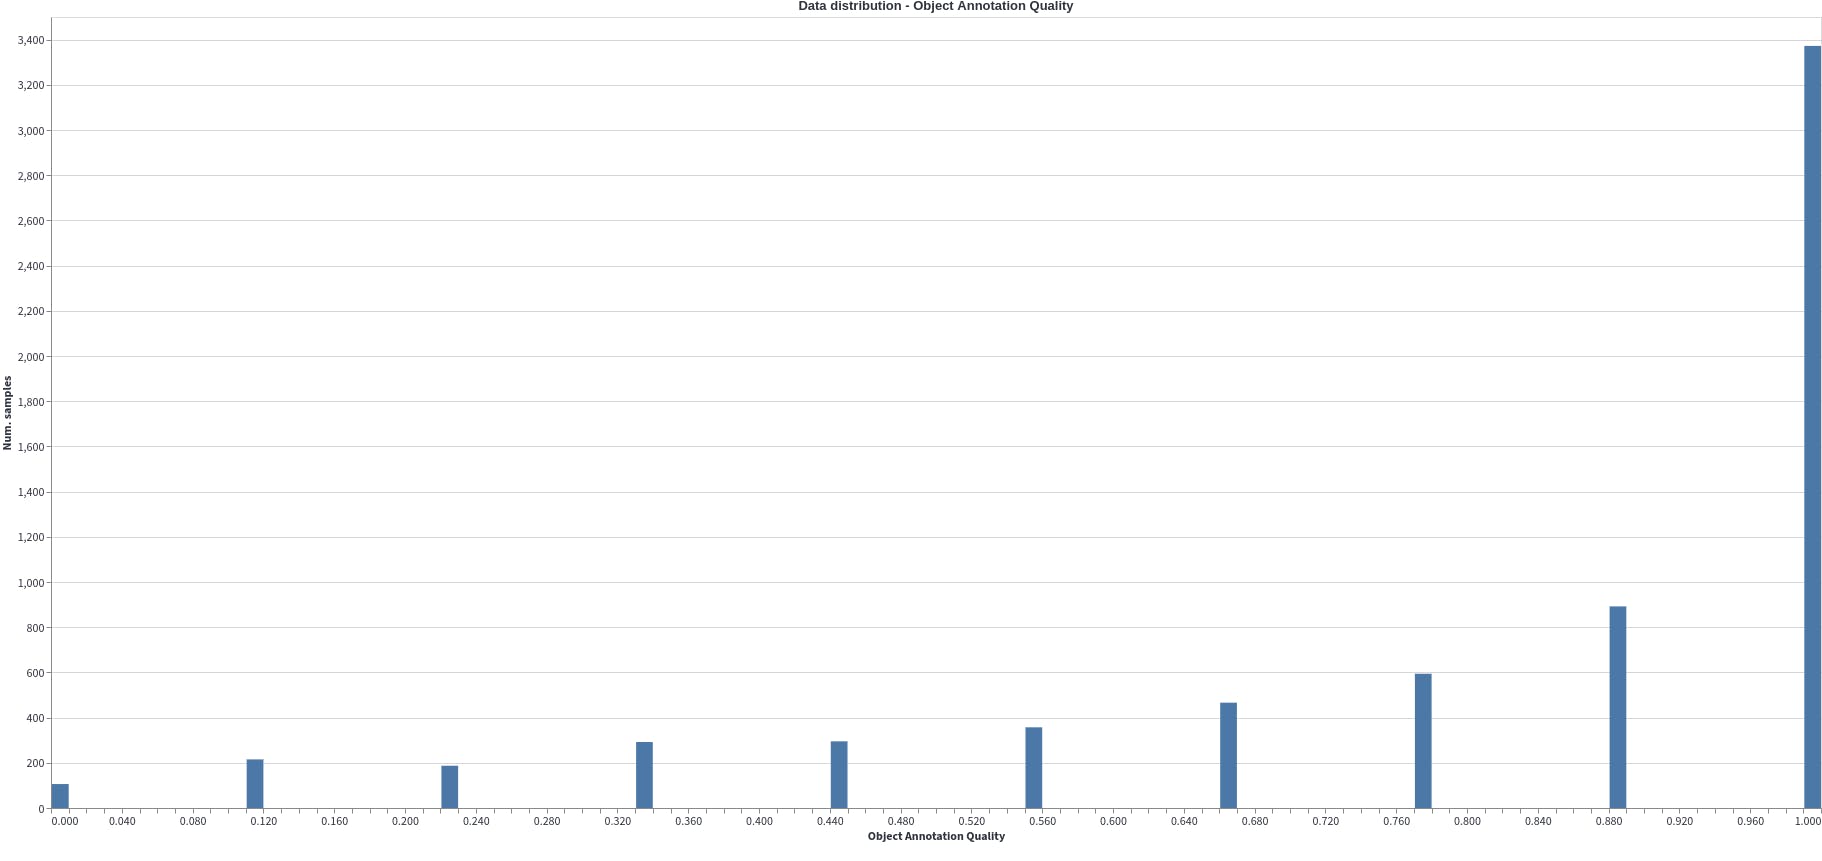
Object Annotation Quality
This quality metric assigns a score to each item based on its closest embedding space neighbors. The annotation's quality will be poor if the nearby neighbors have different labels.
We note half of the dataset has high-quality annotation while the quality of the rest of the data degrades to 0. This could indicate a number of things, such as annotation mistakes or that many object classes are semantically highly similar to one another, bringing them closer together in the embedding space.
Prior to model training, these should be examined, corrected, and cleaned.
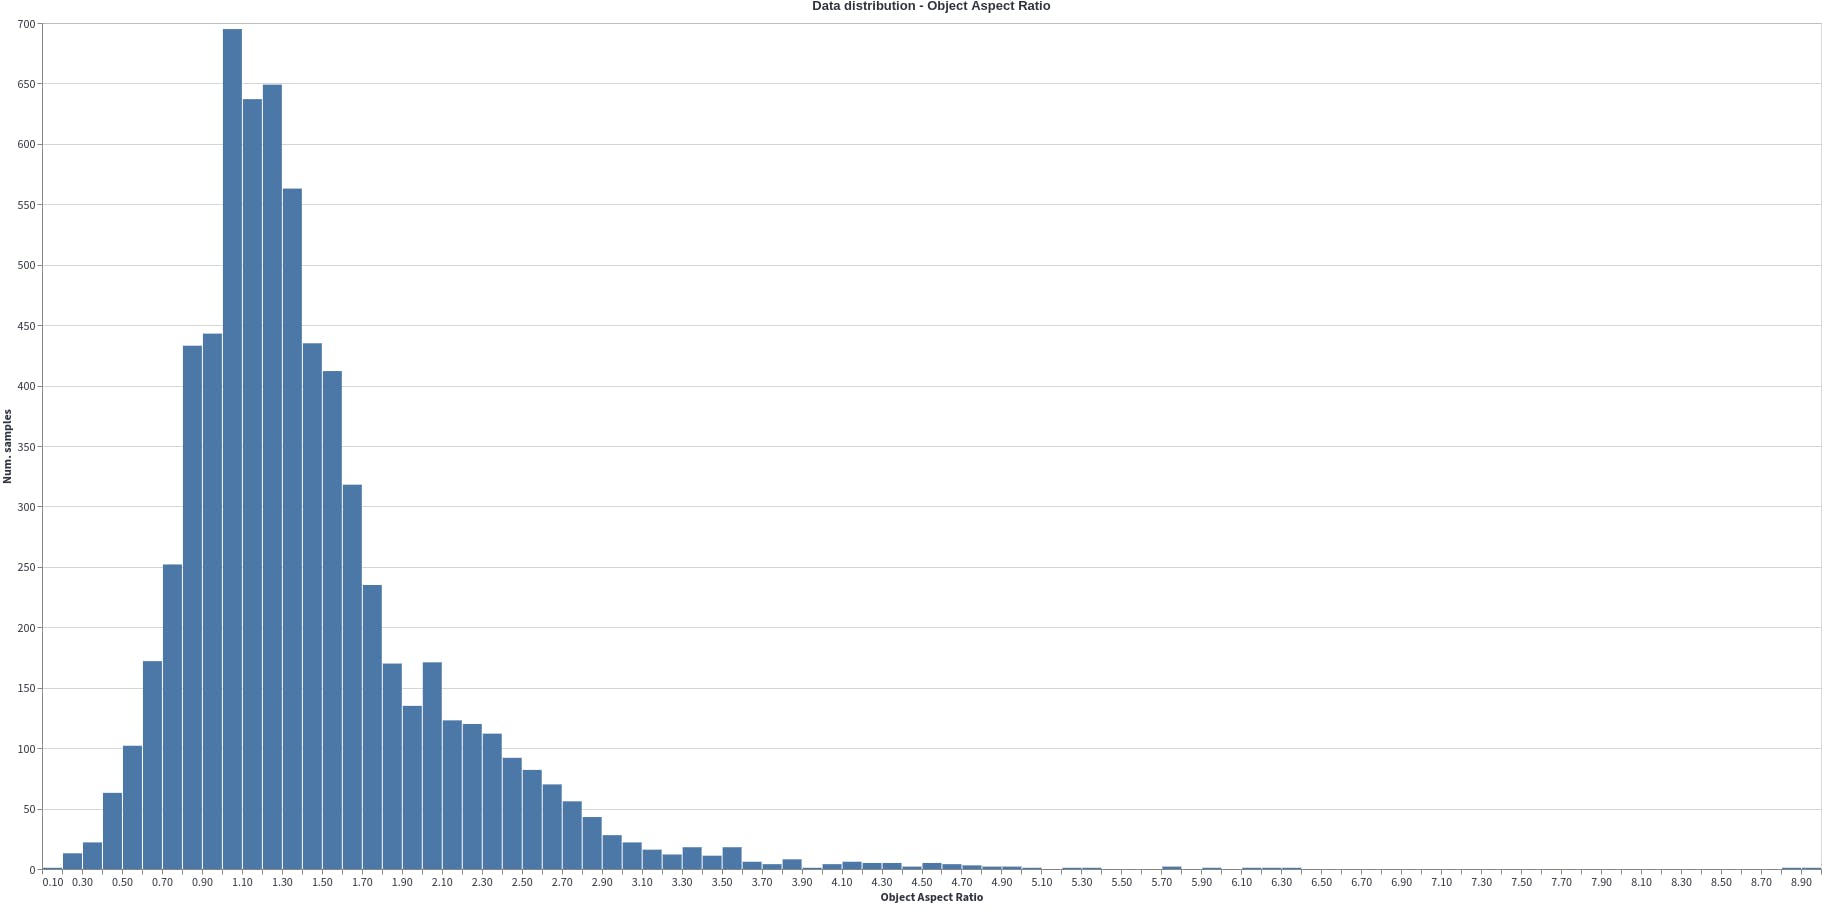
Object Aspect Ratio
The object aspect ratio computes the aspect ratios (width/height) of the objects. In this case, the object's aspect ratio varies greatly from 0 to 9. Even if we eliminate the outliers from 3, there is still great variability. This can cause scale imbalance (box-level scale imbalance) while training. Scale imbalance occurs because a certain range of object size is over or under represented. For example, here the objects with aspect ratio close to 1 (0.5-1.3) are overly represented. So the trained model will have Region of Interest biased towards these over-represented objects. This can be solved by including a feature pyramid network in the architecture. This will help in taking in account the diversity of bounding boxes’ scales.
Preparing Data for Model Training
The first step for preparing data for model training is selecting the appropriate machine learning model.
Based on which machine learning model we choose, the data needs to be pre-processed and clean accordingly. Here we will be using a Mask-RCNN architecture to train an airplane detection model. For this, we need our data and annotations in COCO annotations format.
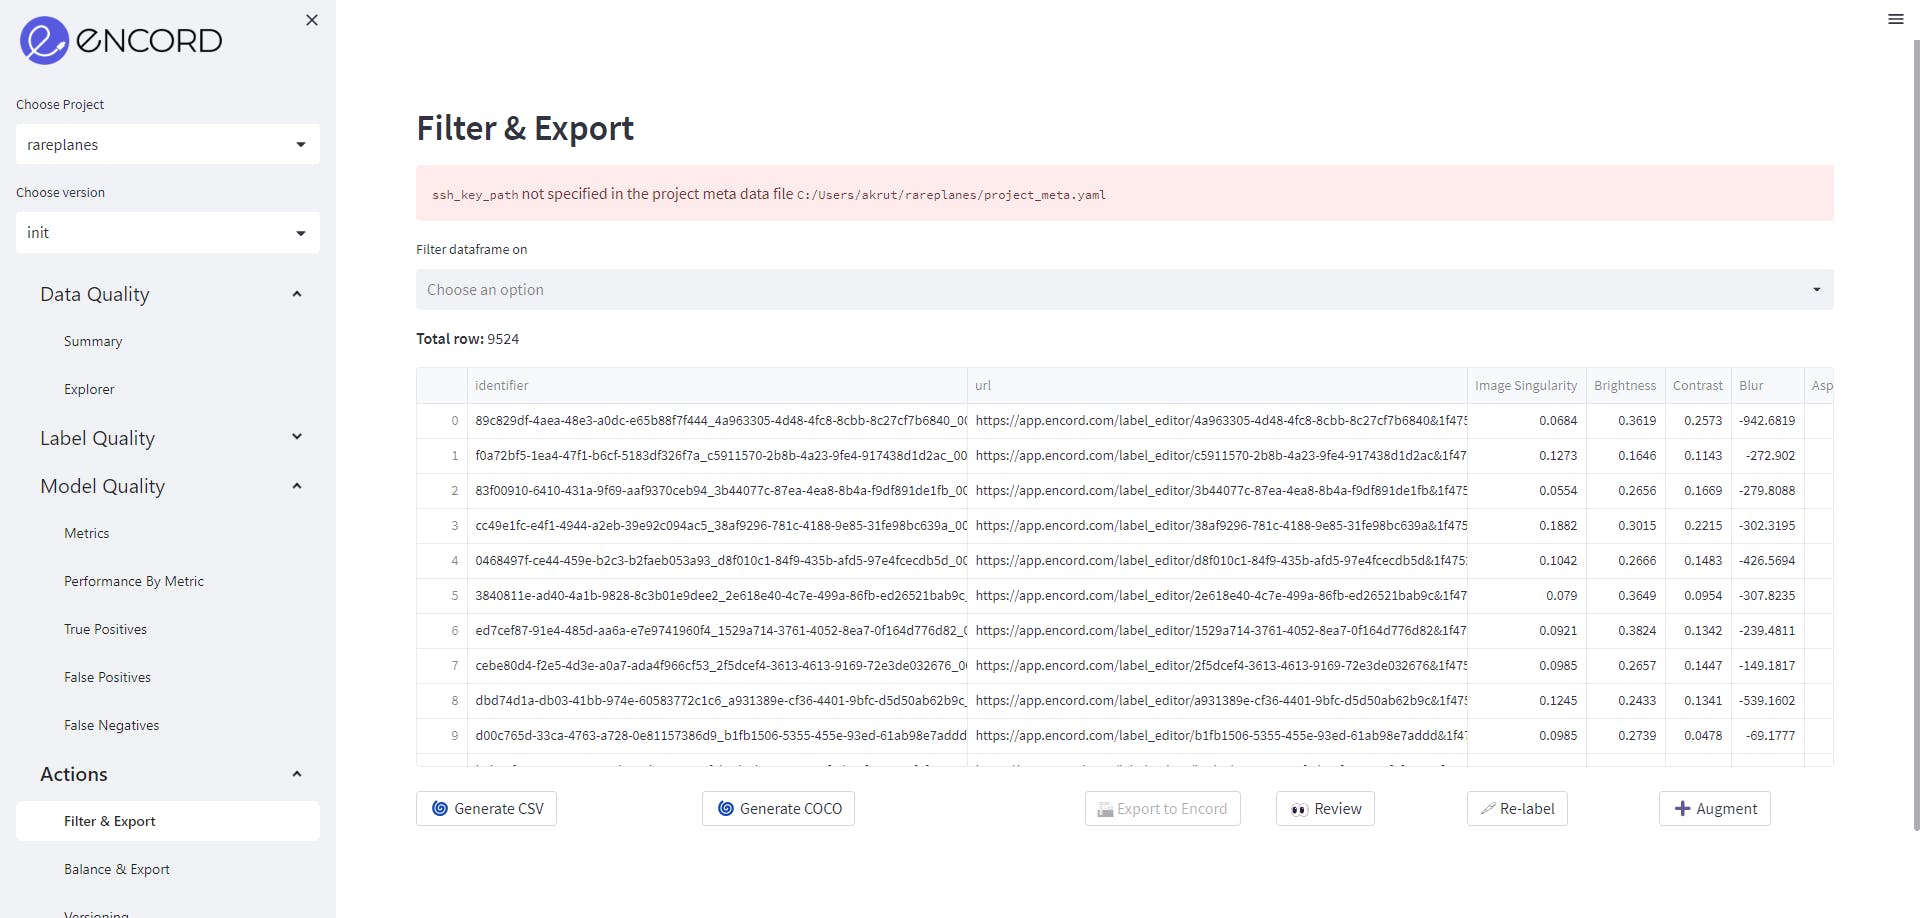
In Encord Active, we can filter and export the data in COCO format. We want to generate COCO annotations from Encord Active so that the attributes are compatible with Encord Active, so when we train our model using Encord Active and then import the predictions back, images can be matched.
To download the dataset, follow the steps:
- Go to Actions→Filter & Export. Do not filter the data.
- Click on Generate COCO file, when COCO file is generated, click Download to download COCO annotations.
Now you have your annotations for your dataset. The next step before training is to split the dataset into train, validation and test dataset. Splitting the dataset ensures that the model can generalize well to new, unseen data and presents overfitting. The train set is used to train the model, the validation set is used to tune hyperparameters, and the test set is used to evaluate the final performance of the model.
Now that our data is ready, let’s train our model using Encord Active!
Training A Model
We will use the instructions provided by Encord Active for end-to-end training and evaluation for Mask-RCNN in Pytorch.
Pre-requisites
- Anaconda: If you don’t have Anaconda installed, please follow the instructions in the Anaconda Documentation.
- Download the environment.yml and save it in the folder you want to build your project.
Installation
- Create a new conda virtual environment using the following command
# inside the project directory
conda env create -f environment.yml
- Verify that the new environment is installed correctly:
conda env list
You should see the encord-maskrcnn in the environment list.
- Now activate this with command:
conda activate encord-maskrcnn
Training
- Create config.ini by looking at the example_config.ini. For training, only the [DATA], [LOGGING] and [TRAIN] sections should be filled.
All set!
- You can start the training, simply run the command in your conda environment:
python train.py
You can check the training progress on the wandb platform. Model checkpoints are saved to the local wandb log folder so that they can be used later for inference.
There you go! We have trained an airplane detection model using simple steps with Encord Active. You can infer your predictions and check the quality of the model you have built by:
Inference
- Get the wandb ID from the experiment that you want to use for inference.
- In your config.ini file, fill out the [INFERENCE] section similar to the example_config.ini
- Run the command to generate the pickle file with Encord Active attributes:
python generate_ea_predictions.py
- Run the command to import the predictions onto Encord Active. If you want to look for more details, please check here.
encord-active import predictions /path/to/predictions.pkl -t /path/to/project
Now you can see the model performance on the Model Quality tab!
Understanding Model Quality
With a new trained model, we definitely want to jump into checking its performance! After uploading your predictions into Encord Active, it automatically matches your ground truth labels and predictions and presents valuable information regarding the performance of the model. For example:
- mAP performance for different IoU thresholds
- Precision-Recall curve for each class and class-specific AP/AR results
- Which of the 25+metrics have the highest impact on the model performance
- True positive and false positive predictions as well as false negative ground truth objects
Quality Metrics
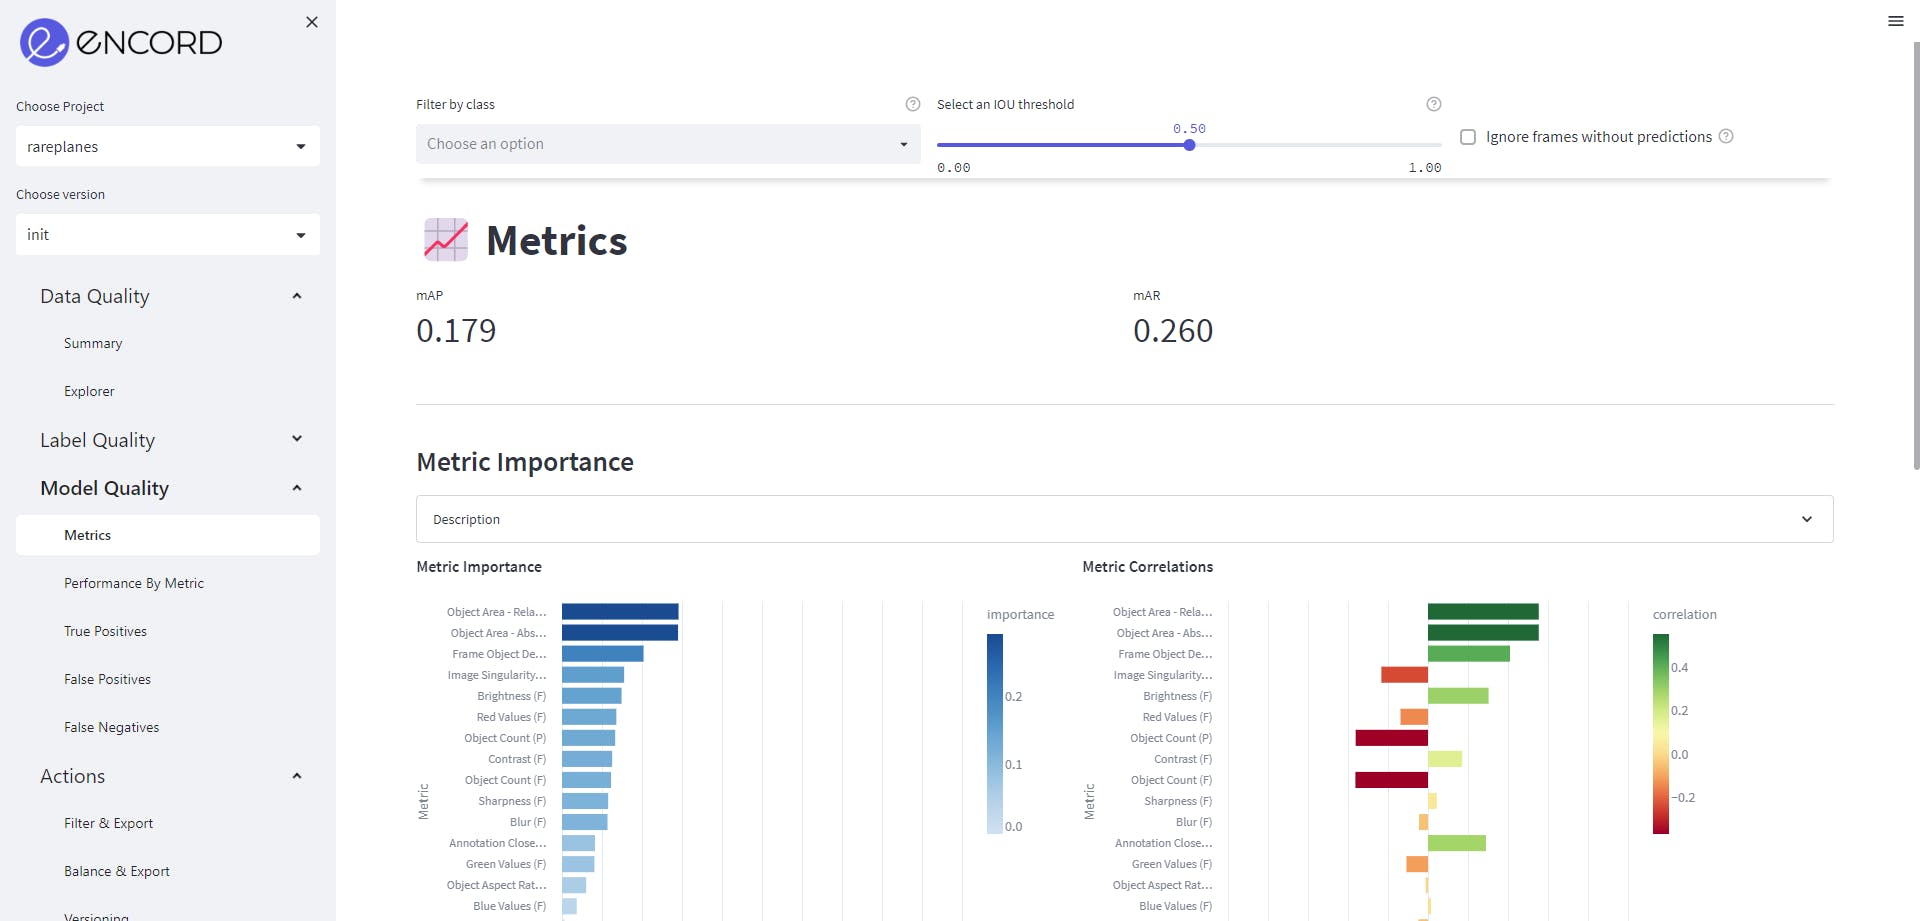
We can go to Model Quality→Metrics, to get an insight on the quality metrics. We want to check its impact on model performance. The metric importance graph shows the features like Object Area, frame object density and object count are most important metrics for the model performance. High importance for a metric implies that a change in that quantity would strongly affect model performance.
Stay tuned for part two of this analysis in the coming weeks…
Conclusion
Understanding a new dataset can be a daunting task and can end up being time consuming. In this blog, we explored the RarePlanes dataset. Using the Encord Active platform, we analyzed the model and label quality. After a clear understanding of the dataset, we trained a Mask-RCNN model with simple steps. We also inferred and analyzed the model quality and its performance as well.
This model can serve as a baseline model. If you want to know how to improve your computer vision model, please read this blog. The steps followed throughout the article for dataset analysis and model training can be adapted for other datasets as well.
Want to test your own models?
"I want to get started right away" - You can find Encord Active on Github here.
"Can you show me an example first?" - Check out this Colab Notebook.
"I am new, and want a step-by-step guide" - Try out the getting started tutorial.
If you want to support the project you can help us out by giving a Star on GitHub :)
Want to stay updated?
- Follow us on Twitter and Linkedin for more content on computer vision, training data, MLOps, and active learning.
- Join the Slack community to chat and connect.
Frequently asked questions
Encord provides robust annotation tools specifically designed for lidar data. Users can create various annotation types such as bounding boxes, polylines, and points. The platform also includes features for 3D to 2D linking, interpolation, and syncing multiple views to enhance the annotation process.
Encord acknowledges the complexities of lidar data, which can often be less reliable than visual data. To combat this, the platform employs pre-modeling and filtering techniques to ensure meaningful segmentation and usability of the data for logistics applications.
Yes, Encord supports multiple modalities, including LiDAR data. This allows users to explore various types of data and integrate additional services for comprehensive annotation and analysis.