Contents
What is Data Visualization?
Why Data Visualization is Essential for AI
Important Features of AI Data Visualization Tools
Data Visualisation Tools for Visualizing Unstructured Data
Data Visualisation Tools for Business intelligence with AI/ML integrations
Data Visualisation Tool for Interactive Dashboards for Collaboration
Key Takeaways
Encord Blog
Top 7 Data Visualisation Tools
5 min read
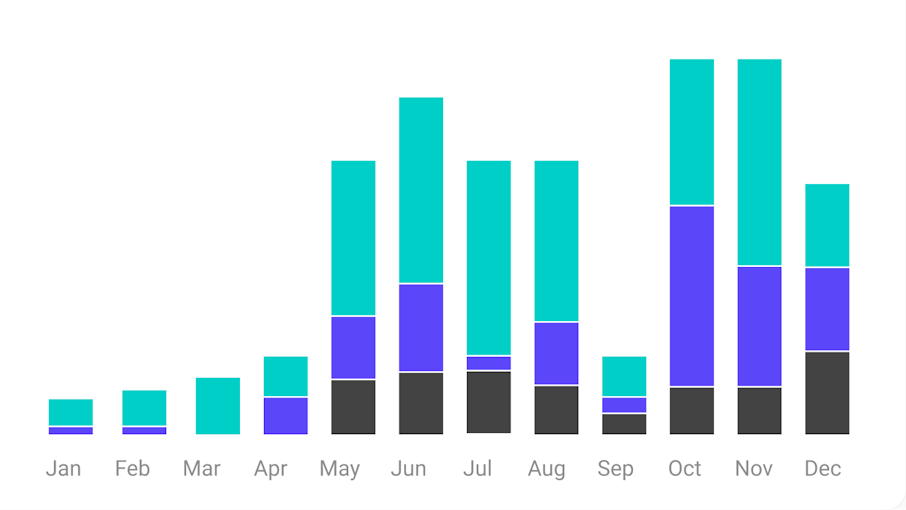
This guide to AI data visualization breaks down the essentials of understanding and improving complex datasets with examples, tools, and proven strategies to support better model development and decision-making.
When it comes to AI, large and complex datasets are a necessary evil. To build accurate and reliable AI models, it is important to truly understand the data being used. This is where data visualization becomes key. Visualization helps AI teams explore the data, spot errors or missing values, understand data distribution, and see relationships between features. Instead of just looking at raw numbers, visual tools like histograms, scatter plots, graphs and heatmaps make it easier to detect patterns and outliers.
Good data visualization is key to improving AI performance. It helps to make better choices when cleaning, labeling, or selecting features for training. Choosing the right visualization tools can make complex AI data easier to understand and guide better model development from the start.
What is Data Visualization?
In modern AI workflows, data visualization is more than just a way to make information easier to look at — it's a functional, high-leverage tool that helps teams work faster, detect errors earlier, and explain model behavior more clearly. At its core, data visualization is the graphical representation of information using elements like charts, heatmaps, scatter plots, or dashboards.
AI teams today deal with large, high-dimensional, often unstructured datasets. Visualization becomes a hands-on method for exploring, debugging, and understanding these datasets across various modalities, including tabular, image, video, and text. Rather than relying on abstract metrics or logs alone, visualizations make AI pipelines visible and interpretable, both during development and after deployment.
One of the key use cases is Exploratory data analysis (EDA), or the stage where teams evaluate the structure, quality, and distribution of their data before building models. During EDA, visualization tools help uncover trends, spot imbalances, and identify data integrity issues. For example:
- Scatter plots and histograms can reveal feature distributions and outliers.
Correlation heatmaps show how variables relate. - Interactive dashboards allow filtering, subsetting, and exploring data points in real time.
These tasks are typically handled with tools like Tableau and Looker for structured data, or FiftyOne and Encord for unstructured image and video datasets. The ability to zoom in on mislabeled objects, filter by metadata, or visually flag edge cases makes these tools crucial during the dataset curation and preparation stage.
Once model training begins, visualization continues to play a key role. Tools like TensorBoard, Encord, or integrated dashboards in BI platforms allow teams to track and interpret model behavior:
- Loss and accuracy curves visualize learning progress.
- Confusion matrices and receiver operating characteristic (ROC) curves help evaluate classification performance.
- Prediction overlays and saliency maps support visual model debugging, especially in domains like computer vision and medical imaging.
Data visualization also enhances the interpretability of AI models. Explainable AI uses visualization techniques such as feature importance plots, heatmaps, decision trees, and visual explanations generated through frameworks like SHAP and LIME.
Data visualization is essential for real-time monitoring and debugging of AI models in production environments. Visual dashboards provide continuous insights into model performance metrics, drift detection, prediction accuracy, latency, and resource consumption. It becomes easy to identify problems and diagnose issues like data drift or model degradation by visually tracking these parameters which further helps in taking corrective actions promptly.
In computer vision applications, data visualization directly helps in interpreting visual model outputs. Techniques like bounding boxes, segmentation masks, keypoint annotations, and overlays on images or videos allow to visually assess AI-driven image analysis. Similarly in NLP, data visualization helps in enhancing tasks by transforming complex textual information into easily digestible visual formats. Word clouds, sentiment analysis graphs, topic modeling visualizations (e.g., LDA visualizations), and interactive dashboards help in the interpretation of large textual datasets.
The power of visualization here isn’t just in simplifying metrics, but in bringing explainability and transparency into model development. Rather than treating the model as a black box, visual outputs give teams insight into why a model behaves a certain way — whether it's overfitting, misclassifying, or biased.
As models move to production, visualization supports another critical layer: monitoring and communication. Teams need ways to summarize results, flag anomalies, and share insights with stakeholders. Here, visualization tools help package AI outputs into intuitive dashboards and reports, enabling business, product, and operations teams to act on AI-driven insights.
Ultimately, data visualization in AI is not a luxury — it’s a requirement for responsible, explainable, and high-performing AI systems. Whether you're cleaning data, interpreting models, or explaining predictions to executives, the right visualization tool makes these tasks clearer, faster, and more collaborative.

Data Visualization in TensorBoard (Source)
Why Data Visualization is Essential for AI
AI relies on large amounts of data and complex algorithms to spot patterns, make predictions, and provide useful insights. But without clear visualization the AI systems seem like mysterious "black boxes" which are hard to understand or explain. Data visualization turns complicated data into easy-to-understand visuals which help to make better decisions. Data visualization is a key part of building and using AI effectively. Following are the reasons why visualization matters so much for AI.
Enhanced Data Understanding
Before AI models are built it is important to understand the data. Data visualization makes this easier by turning complex datasets into clear, visualization formats like charts, graphs, and heatmaps. Tools like scatter plots, histograms, and correlation matrices help to quickly spot trends, patterns, and oddities in the data. For example, visualizing data can show imbalances, missing values, or unusual outliers which helps in cleaning and preparing the data properly. Without good visualization hidden problems in data might go unnoticed which can lead to inaccurate or biased AI models. Better data understanding through visualization leads to stronger and more reliable AI.
Model Interpretability
AI models can be hard to understand because of their complexity. Data visualization helps to understand these AI models. Tools like feature importance charts, decision trees, and heatmaps show how and why an AI model makes certain choices. For example, in medical imaging, a heatmap can highlight which parts of an X-ray led the AI to detect a disease which helps doctors and patients understand the reasoning behind the result. By turning complex AI logic into visual explanations, data visualization builds trust and makes AI more transparent for everyone.
Communication of Insights
The main goal of AI is to turn data into useful insights to help make better decisions and achieve better results. Visualization is a great way to share these insights clearly even to those who are from non-technical background. Things like interactive dashboards, easy-to-read charts, live visual updates, and simple summaries help explain complex AI results in a way that is easy to understand. This makes it easier to make quick decisions. For example, a sales forecasting dashboard can show future sales in a visual way which helps to see trends and decide how to use resources wisely.
Data visualization plays a key role in the success of AI projects. It helps to understand the data better and makes AI results more transparent and easier to explain. Data visualization improves how insights are shared. It helps represent complex data and model results into easy to understand visuals.
Important Features of AI Data Visualization Tools
Data visualization tools for AI must have capabilities to handle complex, multimodal, and dynamically changing data. Effective visualization not only simplifies complex data but also enhances AI model interpretability, collaboration, and communication of insights. Following are the critical features of a robust AI data visualization tool.
Interactive Visualizations
Interactivity is one of the most essential features. An AI visualization tool should enable users to explore data dynamically through interactive dashboards, filters, zoom-in and zoom-out capabilities, drill-down options, and real-time manipulation of data. Such interactions allow users to deeply understand complex AI outcomes, customize views, and answer specific questions without requiring additional analysis.
Real-time Data Integration
An effective AI visualization tool should be able to integrate with real-time data streams and dynamically update visualizations accordingly. Real-time integration ensures that the visualized data remains current and reflects live model outputs and predictions. This is especially critical for use cases like predictive maintenance, anomaly detection, IoT monitoring, or real-time sentiment analysis.
Scalability and Performance
Visualization tools must efficiently handle large datasets of AI projects without performance degradation. Important features include optimized data rendering, fast-loading visuals, and efficient processing of massive data volumes. Scalability ensures that tools remain responsive even with high-dimensional data or millions of data points to maintain user productivity and insight clarity.
Advanced Visualization Techniques
Data visualization tools for AI must support advanced visualization techniques such as heatmaps, scatter plot matrices, 3D plots, hierarchical visualizations, dimensionality reduction visualizations (PCA, t-SNE, UMAP) etc. These sophisticated visualizations are essential for accurately representing high-dimensional data, complex relationships, clustering outcomes, and feature importance in AI models.
Explainability and Model Interpretation
Data visualization tools for AI should offer features that enable easy interpretation of AI model decisions. This includes visualization of metrics like confusion matrices, mAP, ROC curves and many others. These capabilities promote transparency, trust, and regulatory compliance by clearly demonstrating how AI systems arrive at specific decisions.
Ease of Use and Customization
A good AI visualization tool should be both powerful and easy to use. Data visualization tools should make it easy to label data accurately, set up training workflows, and organize datasets without needing deep technical knowledge. Clear instructions, visual tools, and documentation can help speed up the process and reduce errors. This allows teams to focus more on building great AI models and less on dealing with complicated tools.
Collaboration and Sharing
Collaboration and sharing are important when multiple users or teams are working on the same dataset for an AI model where users can easily share and label data, and track changes in one place. Visualization plays a key role in collaboration. It helps teams clearly see the progress of labeling, training results, and model performance. Visual dashboards and charts make it easier to understand what’s happening and make decisions together, even if not everyone has a technical background.
Good visualization tools for AI should provide a balance between powerful features and easy-to-use design. It should support interactive use, work well with large amounts of data and should also be able to help explain AI results clearly. It should also make it easy for teams to work together.

Encord: A Multimodal Data Visualization Tool (Source)
Data Visualisation Tools for Visualizing Unstructured Data
Encord
Encord is a powerful data development platform designed to manage, curate, and annotate multimodal data including images, videos, audio, documents, text, and DICOM files for AI model training and fine-tuning. Following are the features of Encord related to data visualization for AI.
- Interactive Visualizations: Encord offers interactive dashboards and visualization tools that enable users to explore and analyze large datasets effectively.
- Real-time Data Integration: The platform supports integration with various data sources, allowing for real-time data synchronization. This ensures that the most current data is available for analysis and model training.
- Scalability and Performance: Encord is built to handle large-scale datasets and support the management of large amounts of data files across different modalities. Its architecture ensures efficient performance even with extensive data volumes.
- Advanced Visualization Techniques: The platform provides advanced visualization techniques, such as embedding plots, which allow users to visualize high-dimensional data in two dimensions. This aids in understanding complex data structures and relationships.
- Explainability and Model Interpretation: Encord Active, an open-source toolkit within the platform that enables users to test, validate, and evaluate models. It offers model explainability reports, helping users understand model decisions and identify areas for improvement.
- Ease of Use and Customization: Encord provides an intuitive interface with customizable annotation workflow which makes it accessible for users with varying technical expertise.
- Collaboration and Sharing: Encord offers collaborative tools that enable multiple users to work simultaneously on data curation and annotation tasks.

Data Embedding Plot in Encord
FiftyOne
FiftyOne is an open-source tool developed by Voxel51 to enhance the management, visualization, and analysis of computer vision datasets. Following are an overview of its key features related to data visualization.
- Interactive Visualizations: FiftyOne offers dynamic interfaces that allow users to visualize datasets, including images and videos, along with their annotations. Users can filter, sort, and query data. These changes are reflected instantly in the visual interface which helps in efficient data exploration and analysis.
- Real-time Data Integration: The platform supports integration with various data sources to enable real-time data synchronization.
- Scalability and Performance: Designed to handle large-scale datasets, FiftyOne can manage millions of data samples across diverse formats and modalities, including images, videos, and 3D point clouds.
- Advanced Visualization Techniques: FiftyOne provides advanced visualization techniques, such as embedding projections which allow users to visualize high-dimensional data in lower dimensions.
- Explainability and Model Interpretation: The platform includes tools for evaluating and analyzing model performance. Users can compute detailed metrics, visualize predictions alongside ground truth labels and explore failure cases to improve model performance.
- Ease of Use and Customization: FiftyOne features a rich user interface and a powerful Python API, allowing users to programmatically control and manipulate data.
- Collaboration and Sharing: The platform supports collaboration that enable multiple users to work simultaneously on data curation and annotation tasks.

Data Visualisation Tools for Business intelligence with AI/ML integrations
ThoughtSpot
ThoughtSpot is an AI analytics platform which is designed to explore and analyze data through natural language queries and interactive visualizations. Following are its key features in relation to data visualization.
- Interactive Visualizations: ThoughtSpot's Liveboards offer real-time, interactive dashboards that allow users to visualize and explore data.
- Real-time Data Integration: The platform connects with various data sources, including cloud data warehouses like Snowflake, Google BigQuery, and Amazon Redshift and many more.
- Scalability and Performance: ThoughtSpot is built to handle large-scale data environments and provide fast query responses even with extensive datasets.
- Advanced Visualization Techniques: ThoughtSpot offers advanced visualization through features like SpotIQ which automatically detects patterns, anomalies, and trends in the data.
- Explainability and Model Interpretation: ThoughtSpot's AI enabled analytics provide transparent insights by allowing users to see the underlying data and logic behind visualizations.
- Ease of Use and Customization: With its natural language search interface, ThoughtSpot makes data exploration accessible to users easily. The platform also offers customization options to customize dashboards and reports to their specific needs.
- Collaboration and Sharing: ThoughtSpot facilitates collaboration by enabling users to share Liveboards and reports.
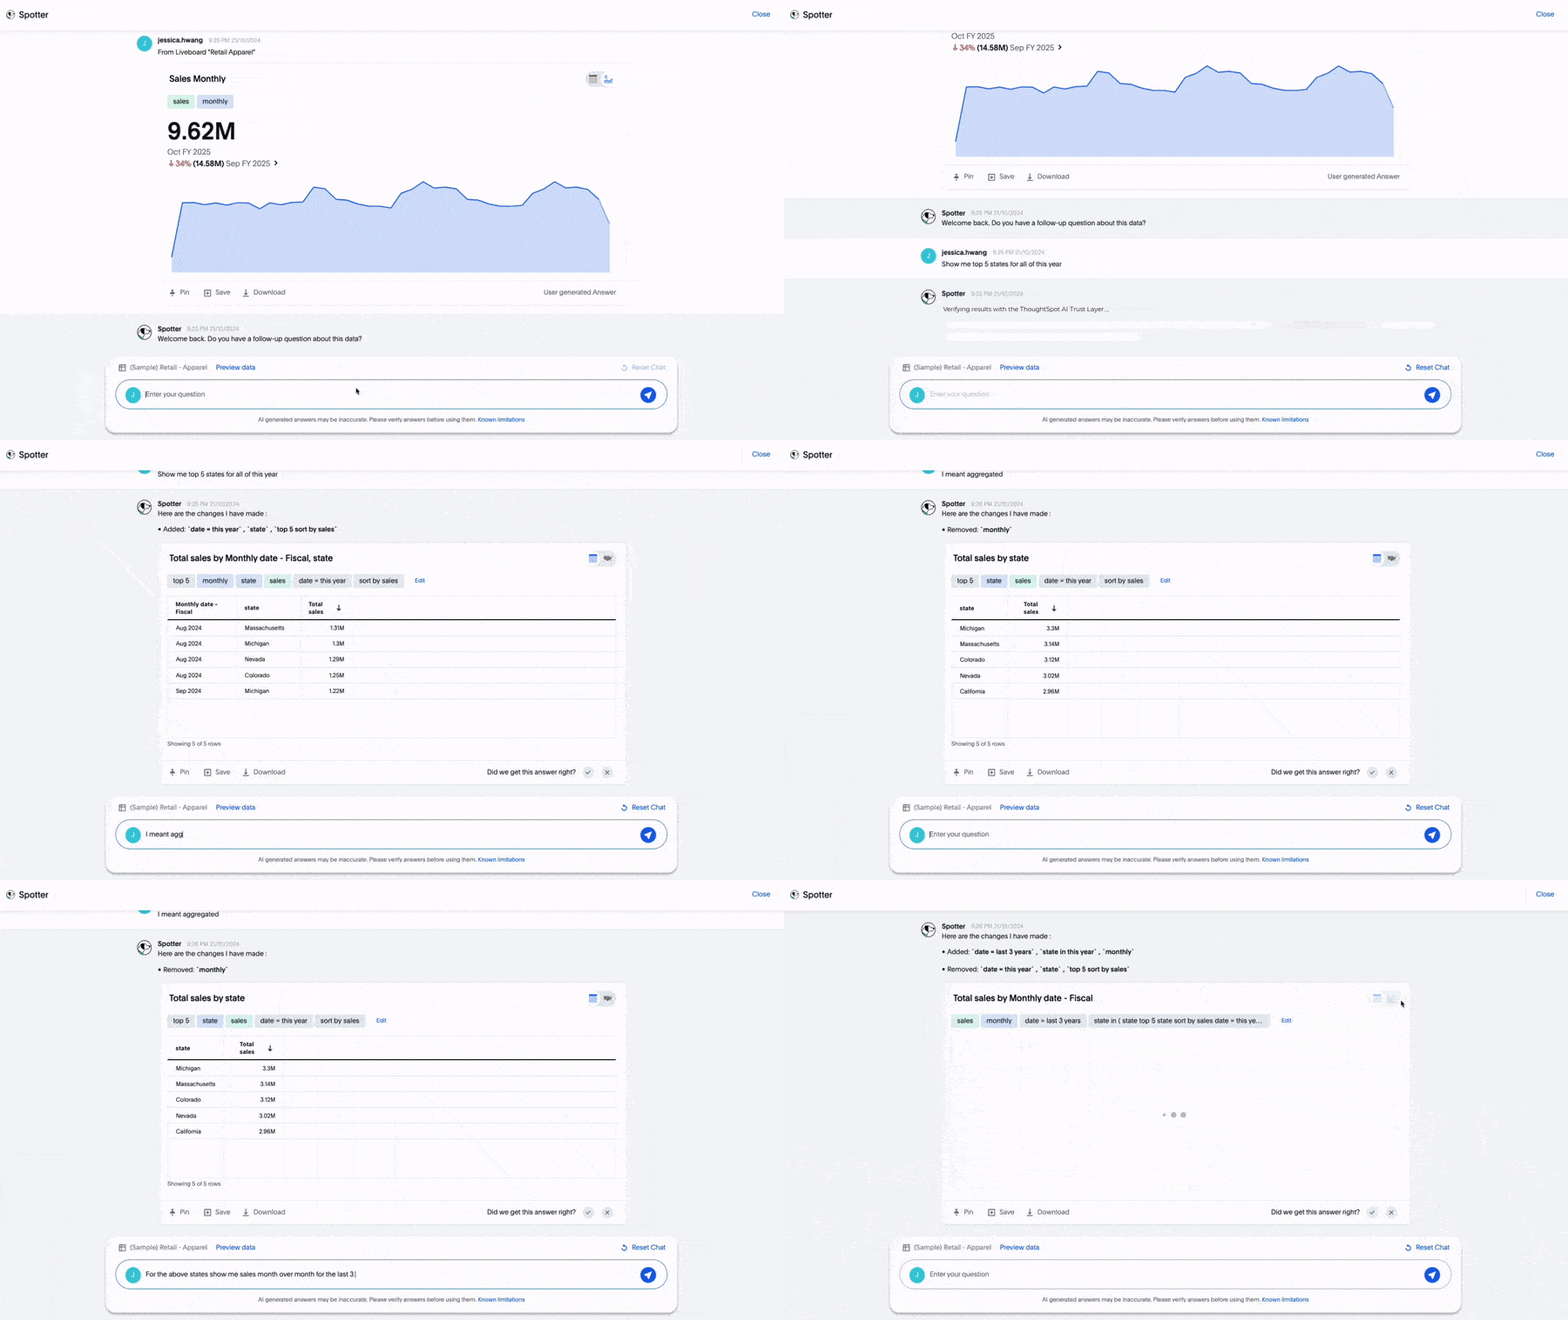
ThoughtSpot Visualization (Source)
Domo
Domo is a cloud-based business intelligence (BI) platform that supports features such as real-time data integration, visualization, and analytics capabilities. Following are its key features: in related to data visualization.
- Interactive Visualizations: Domo offers a powerful charting engine that enables users to create interactive and easy-to-use visualizations.
- Real-time Data Integration: The platform supports integration with a wide range of data sources, including databases, files, and cloud services.
- Scalability and Performance: Domo is designed to handle large volumes of data and provides a scalable solution that maintains performance as data complexity and size grow.
- Advanced Visualization Techniques: Beyond standard charts and graphs, Domo offers advanced visualization options such as interactive dashboards and custom apps. These tools help users to present complex data in an understandable and actionable format.
- Explainability and Model Interpretation: The AI capabilities of Domo such as AI Chat and AI Agents provide users with conversational interfaces to query data and receive explanations. This enhances the interpretability of data models and supports informed decision-making.
- Ease of Use and Customization:Domo provides drag-and-drop interface with customization options to allow build dashboards, reports, and apps to meet specific requirements.
- Collaboration and Sharing: Domo facilitates collaboration through features that enable users to share dashboards and reports securely within their organization

Domo data visualization (Source)
The data visualization tools (i.e. Encord, FiftyOne, Tableau, Looker Studio, ThoughtSpot, and Domo) discussed here offer robust features that can be used to visualize both source data and model outputs. They enable users to create interactive and insightful visualizations to help exploration of raw datasets, identification of patterns, and monitoring of model performance and thus assisting in enhancing data-driven decision-making processes.
Selecting the appropriate data visualization tool is crucial for effectively analyzing and presenting data. Here are a few points for consideration.
- Define Your Objectives: Determine whether the tool will be used for exploratory data analysis, explanatory presentations, or real-time monitoring. Different tools excel in different areas.
- Data Compatibility and Integration: Assess the tool's ability to connect with various data sources and ensure whether the tool can handle data size and complexity without performance issues.
- Ease of Use: The tool should have an easy to use user interface.
- Variety of Visualization: The tool should provides a wide range of visualization options to represent your data effectively.
- Collaboration and Sharing: The tool should allow to set permissions and control who can view or edit visualizations and enable easy sharing of data and visualization.
- Performance and Scalability: The tool should process and render visualizations quickly, even with large datasets.
- Security and Compliance: Ensure the tool complies with security policies and industry regulations especially if handling sensitive information.
Data Visualisation Tool for Interactive Dashboards for Collaboration
Tableau
Tableau is a leading data visualization and business intelligence tool that enables users to analyze, visualize, and share data insights across an organization. Here is an overview of its key features related to data visualization.
- Interactive Visualizations: Tableau offers a user-friendly, drag-and-drop interface that allows users to create a wide range of interactive visualizations including bar charts, line graphs, maps, and more. These visualizations enable users to explore data dynamically, facilitating deeper insights.
- Real-time Data Integration: Tableau supports connections to various data sources, such as spreadsheets, databases, cloud services, and web data connectors.
- Scalability and Performance: Tableau is designed to handle large volumes of data and maintains high performance and responsiveness.
- Advanced Visualization Techniques: Tableau offers advanced visualization options like treemaps, heatmaps, box and whisker plots, and geographic maps. These tools help users explore and find complex patterns and trends within their data.
- Explainability and Model Interpretation: Tableau provides features such as trend lines, forecasting, and integration with statistical tools like R and Python. The Aible extension for Tableau enables users to build predictive AI models.
- Ease of Use and Customization: Tableau provides an easy to use interface with drag-and-drop functionality. It offers various customization options for data visualizations and dashboards to meet specific requirements.
- Collaboration and Sharing: Tableau enables collaboration to allow users to share dashboards and reports securely within their organization.

Data Visualization in Tableau (Source)
Looker Studio
Looker Studio (formerly known as Google Data Studio) is a free, cloud-based business intelligence and data visualization tool that enables users to create interactive reports and dashboards. Following are key features of looker studio related to data visualization.
- Interactive Visualizations: Looker Studio offers a wide range of customizable charts and tables, including bar charts, line graphs, geo maps, and more. Users can create interactive reports that helps to explore data dynamically and get deeper insights.
- Real-time Data Integration: The platform supports connections to a large number of data sources, such as Google Analytics, Google Ads, BigQuery, and various databases.
- Scalability and Performance: Looker studio is designed to handle datasets of varying sizes and maintains same performance and responsiveness. Its integration with Google's infrastructure allows for efficient data processing and visualization for both small businesses and large enterprises.
- Advanced Visualization Techniques: Beyond standard visualization tools, Looker Studio provides advanced visualization options like geo maps and treemaps etc.
- Explainability and Model Interpretation: While primarily a data visualization tool, Looker Studio can integrate with platforms like Vertex AI to incorporate machine learning models into reports. Looker Studio can connect to data sources that contain the outputs of machine learning models deployed on Vertex AI.
- Ease of Use and Customization: Looker Studio offers customization options to allow users to customize visualizations and dashboards to meet specific requirements.
- Collaboration and Sharing: Looker Studio enables collaboration via team workspace that allow multiple users to edit reports simultaneously and offers flexible sharing options. It enables efficient teamwork and broad dissemination of data insights.

Data Visualization in Looker Studio (Source)
Key Takeaways
Data visualization is the graphical representation of data using charts, graphs, maps, and dashboards to make complex information easier to understand. It is essential in AI to explore datasets, identify patterns or anomalies, monitor model performance, and communicate insights clearly.
- Data visualization is essential in AI for understanding, cleaning, and exploring data effectively.
- It helps identify patterns, trends, outliers, and missing values through visual formats like charts and heatmaps.
- Visualization helps in model development by tracking training progress with tools like accuracy/loss curves and confusion matrices.
- It improves model interpretability and trust using visual explanations such as feature importance and heatmaps.
- Good visualization tools should support interactivity, real-time data integration, scalability, advanced plots, explainability, ease of use, and collaboration.
- Tools like Encord, FiftyOne, Tableau, Looker Studio, ThoughtSpot, Zoho Analytics, and Domo offer powerful visualization features for AI workflows.
- Choosing the right tool depends on your project needs, data types, performance requirements, and team collaboration preferences.
Explore the platform
Data infrastructure for multimodal AI
Explore product
Explore our products
Data visualization helps AI teams understand and interpret large, complex datasets more effectively. It supports data cleaning, feature selection, error detection, and insight communication. Without visualization, hidden issues like outliers, missing values, or class imbalances can lead to poor model performance and biased results.
During model training, visualization tools provide insight into how a model is learning. Loss curves, accuracy plots, confusion matrices, and ROC curves help teams monitor progress and spot overfitting or underfitting. For image and text models, overlays like saliency maps or bounding boxes reveal how the model interprets input data.
Tabular data (e.g., using scatter plots, heatmaps, histograms)
Image and video data (e.g., bounding boxes, segmentation masks)
Text data (e.g., word clouds, topic models, sentiment graphs)
Multimodal data (e.g., dashboards combining text, image, and structured formats)
FiftyOne and Encord for computer vision
TensorBoard for deep learning metrics
Tableau, Looker Studio, and Zoho Analytics for structured and business data
ThoughtSpot, Domo, and Sisense for interactive analytics and dashboards
Visualization techniques like feature importance plots, SHAP values, LIME explanations, decision trees, and heatmaps reveal how models make decisions. This makes AI more transparent, especially in regulated fields like finance or healthcare, where understanding why a prediction was made is as important as the prediction itself.
Encord provides tools that enable data visualization for non-technical stakeholders, ensuring they can access and understand the data insights without needing deep technical expertise. This capability fosters collaboration and allows domain experts to contribute effectively to the annotation process.
Encord features comprehensive data visualization tools that allow users to gain insights into the annotation process. This includes embedding metrics and the ability to analyze edge cases, which are crucial for improving model performance and understanding data quality.
Encord provides robust data visualization capabilities that allow users to showcase selected images to both technical and non-technical stakeholders. This feature is designed to enhance communication and understanding of data quality and relevance during presentations.
Encord includes a range of filtering tools that allow users to visualize annotated data in a detailed manner. This is particularly useful for sports analytics, where users can quickly isolate false positives or specific class types within the annotated video footage.
Encord's indexing module is designed to efficiently manage large datasets, making it suitable for projects that scale from a few stations to thousands. It helps in organizing and accessing annotated data effectively, which is crucial for comprehensive analysis.
Encord offers a user-friendly interface that allows users to browse and visualize indexed media. Users can apply filters to view specific sequences and access detailed information about each indexed entity, enhancing the overall data exploration experience.
Encord provides robust visualization tools designed to help teams identify failure modes and curate data effectively. These tools enable users to make the best use of their data, particularly in challenging environments such as roundabouts and urban areas.
Encord has made several enhancements in data recreation and visualization capabilities, focusing on providing clearer insights into model predictions. These updates aim to streamline the user experience and improve data analysis processes.
Yes, Encord can integrate with various database systems like BigQuery for indexing data. This allows organizations to organize their data sets effectively and leverage existing technologies for better data management.
Encord offers tools for data visualization and curation that streamline the process of managing datasets. This helps teams better understand their data, enabling more effective model training and evaluation.
