Data, Label, & Model Quality Metrics in Encord

Product Manager at Encord
When you’re working with datasets or developing a machine learning model, you often find yourself looking for or hypothesizing about subsets of data, labels, or model predictions with certain properties.
Quality metrics form the foundation for finding such data and testing the hypotheses.
What is a Quality Metric?
The core concept is to use quality metrics to index, slice, and analyze the subject in question in a structured way to perform informed actions when continuously cranking the active learning cycle.
Concrete example: You hypothesize that object "redness" influences the mAP score of your object detection model. To test this hypothesis, you define a quality metric that captures the redness of each object in the dataset. From the quality metric, you slice the data to compare your model performance on red vs. not red objects.
These metrics matter most as part of an ongoing curation process, not a one-time check. See our guide to what data curation involves for the full lifecycle these metrics support.
 💡 Tip: Find an example notebook for this use-case here.
 Quality Metric Defined
The best way to think of a quality metric in computer vision is:
Any function that assigns a value to individual data points, labels, or model predictions in a dataset. By design, quality metrics are a very abstract class of functions because the accompanying methodologies are agnostic to the specific properties that the quality metrics express. No matter the specific quality metric, you can:
- sort your data according to the metric
- slice your data to inspect specific subsets
- find outliers
- compare training data to production data to detect data drifts
- evaluate your model performance as a function of the metric
- define model test-cases
- and much more
All of these are possible with Encord Index and Encord Active.
Pro Tip: Try to read the remainder of this post with the idea of "indexing" your data, labels, and model prediction based on quality metrics in mind. The metrics mentioned below are just the tip of the iceberg in terms of what quality metrics can capture. Every project will have it's own specific metrics to consider and factor in. Data Quality Metrics
Data quality metrics are those metrics that require only information about the data itself. Within the computer vision domain, this means the raw images or video frames without any labels. This subset of quality metrics is typically used frequently at the beginning of a machine learning project where labels are scarce or perhaps not even existing.
Below are some examples of data quality metrics ranging from simple to more complex:
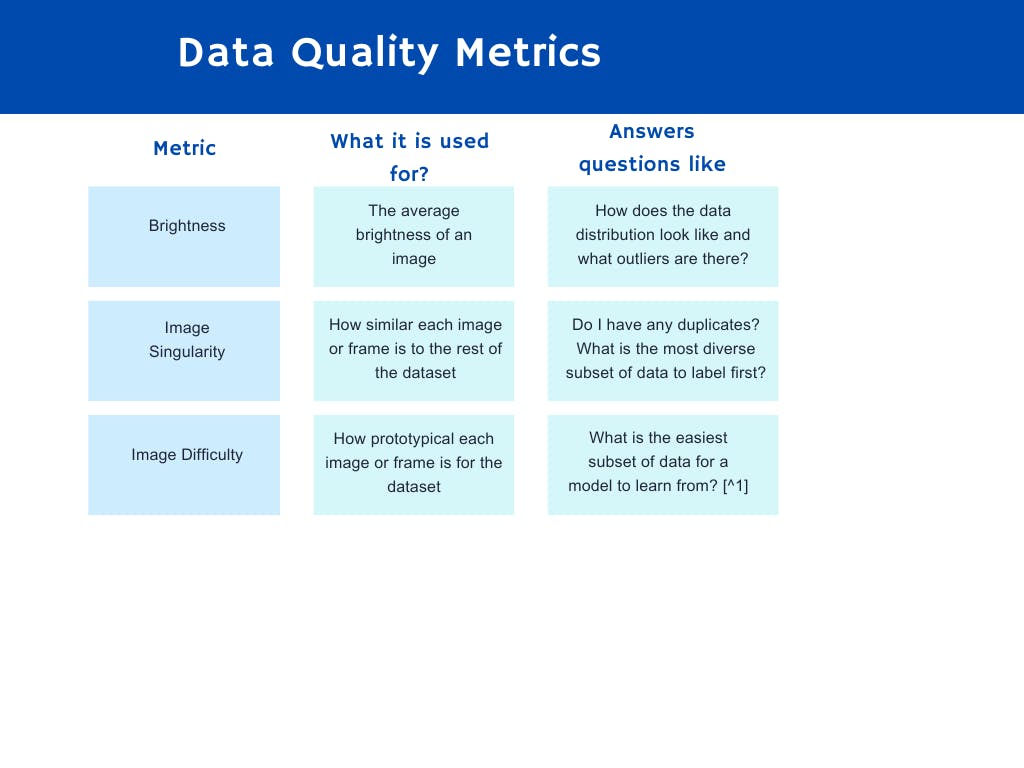
Image Brightness as a data quality metric on MS COCO validation dataset on Encord.
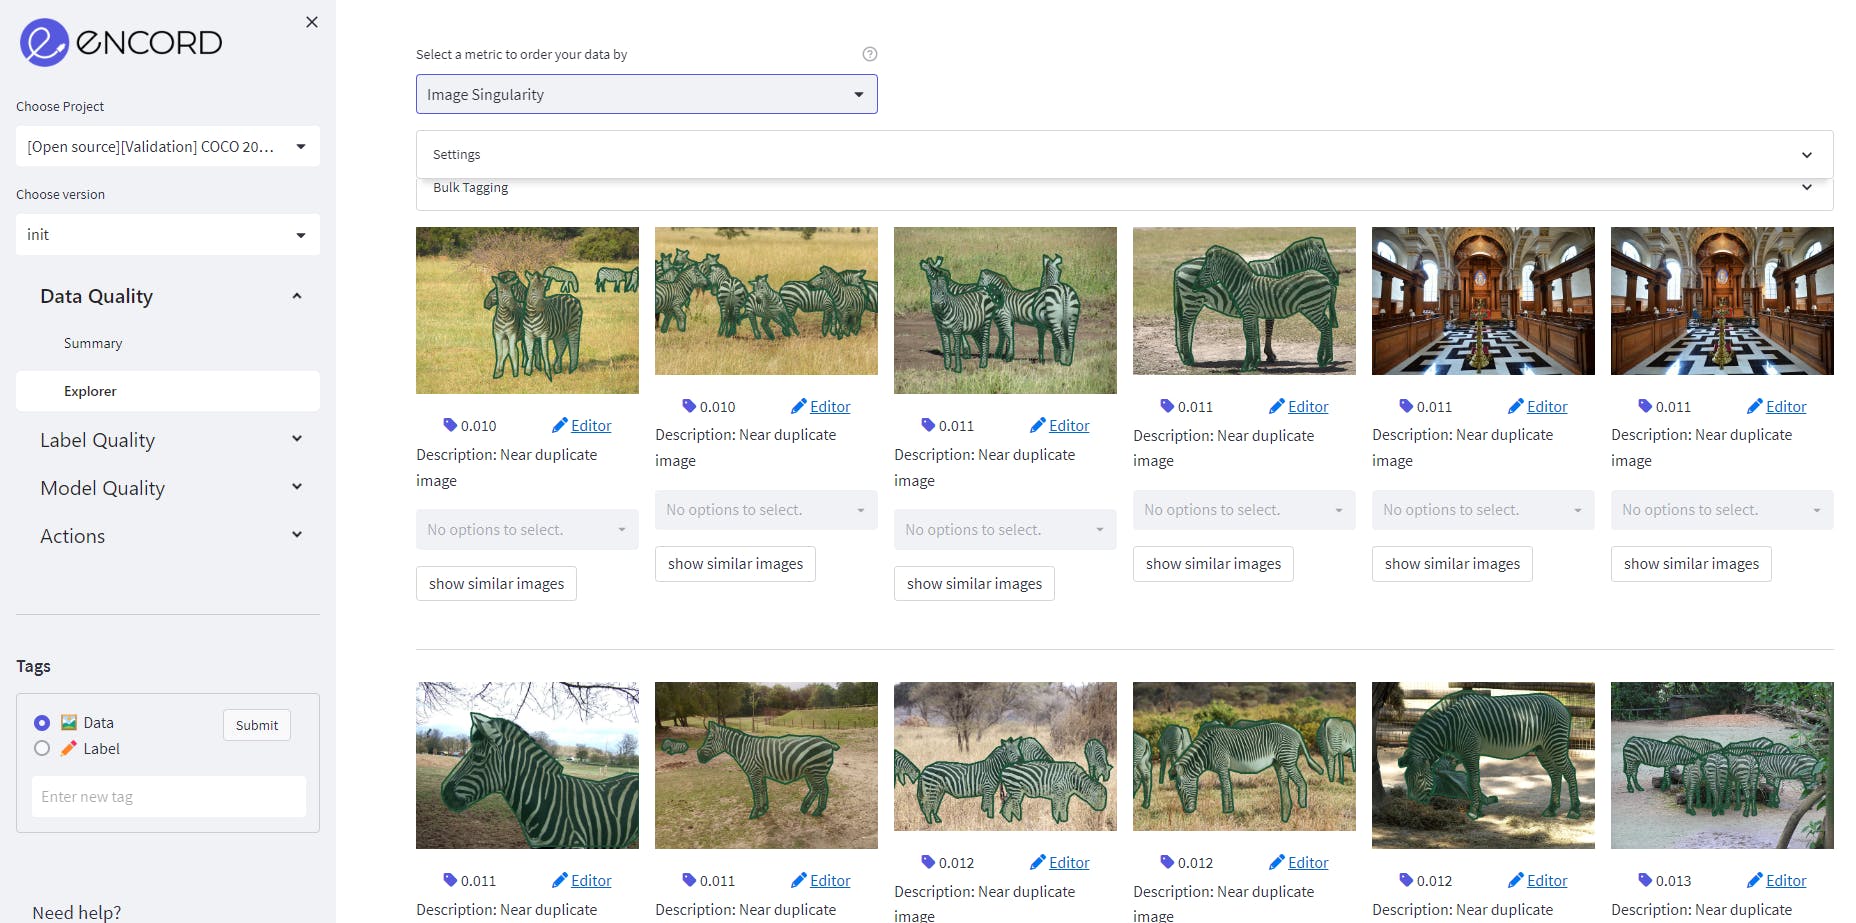
Image Singularity as a data quality metric on MS COCO validation dataset on Encord.
Label Quality Metrics
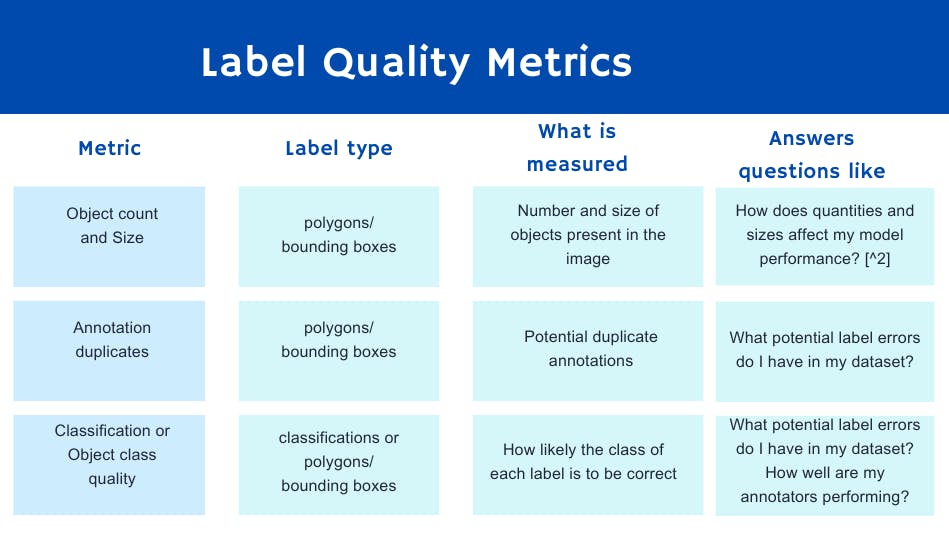
Label quality metrics apply to labels. Some metrics use image content, while others apply only to the label information. Label quality metrics serve many purposes, but some more frequent ones are surfacing label errors, model failure modes, and assessing annotator performance.
Here are some concrete examples of label quality metrics ranging from simple to more complex:
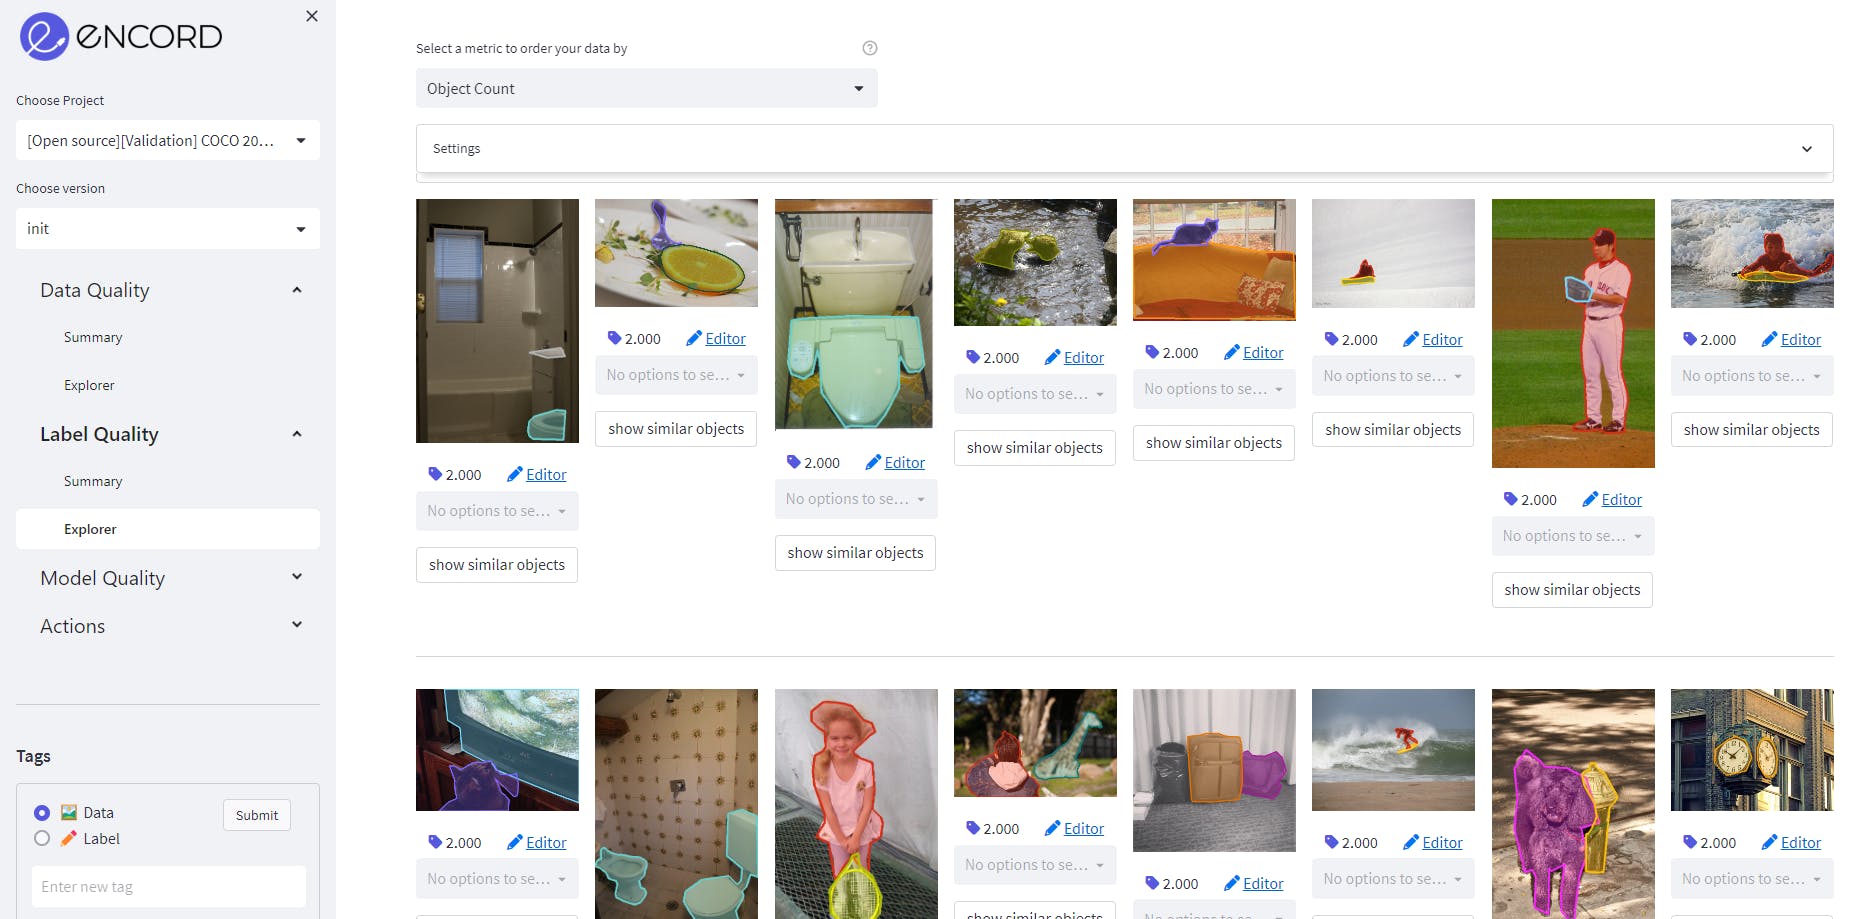
Object count as a label quality metric on MS COCO validation dataset on Encord.
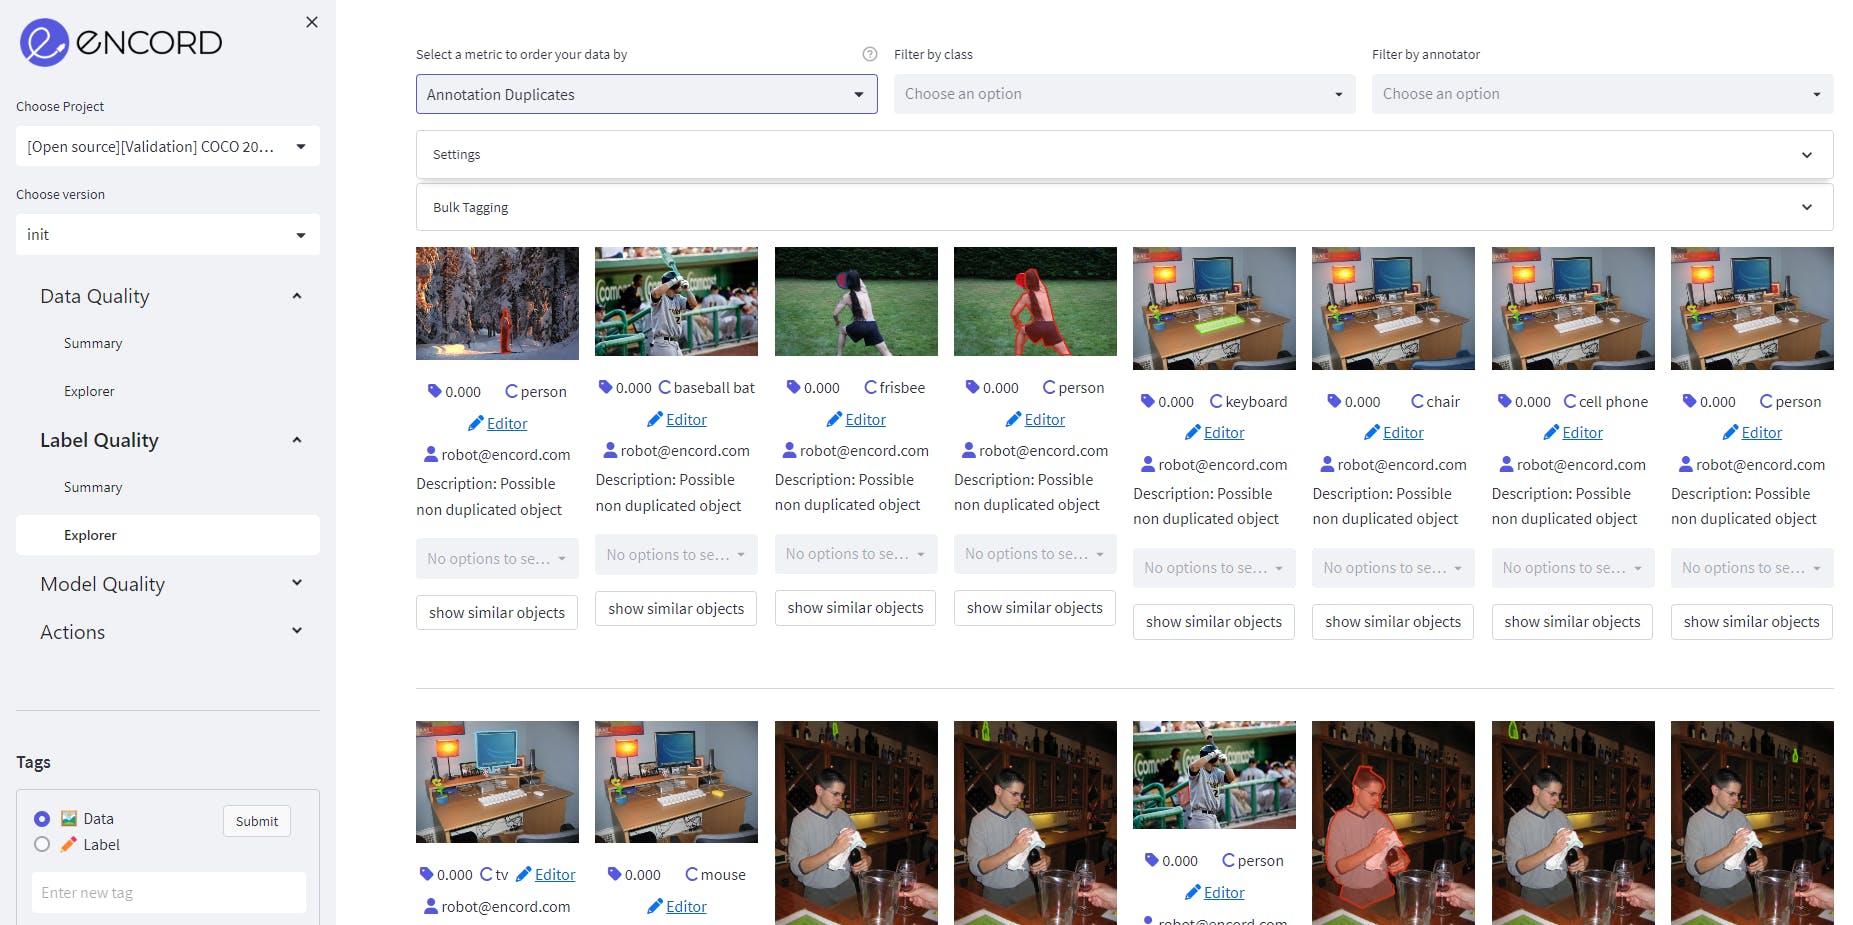
Annotation Duplicate as a label quality metric on MS COCO validation dataset on Encord.
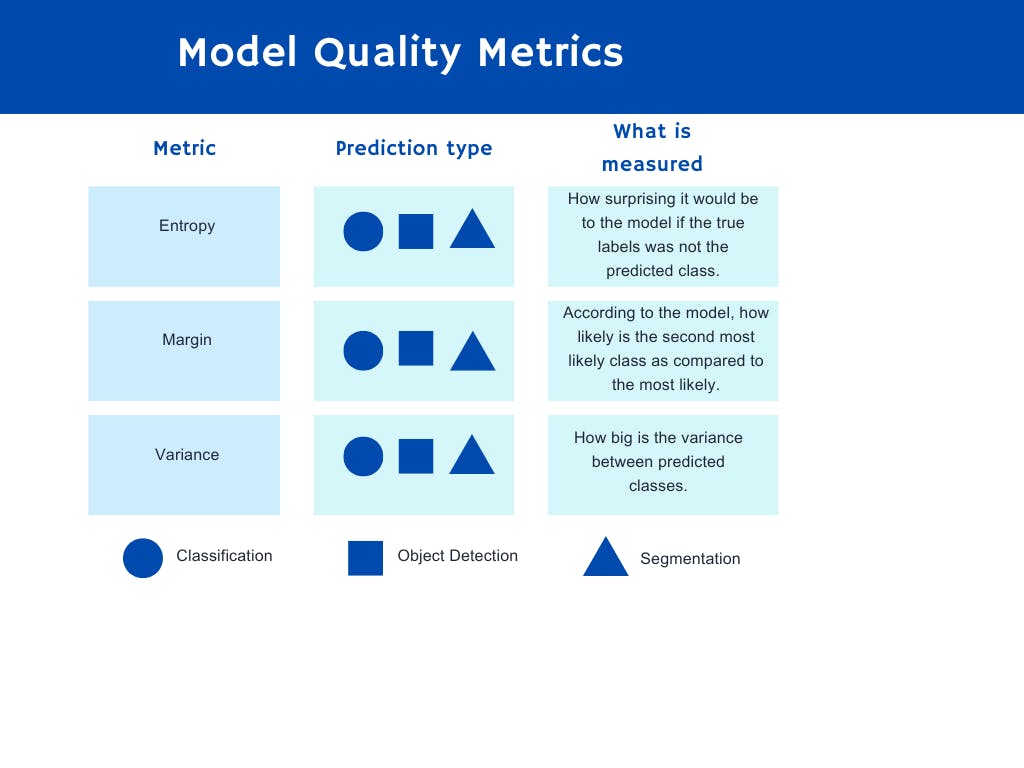
Model Quality Metrics
Model quality metrics also take into account the model predictions. The most obvious use-case for these metrics is acquisition functions, answering the question, "What should I label next?" There are many intelligent ways to leverage model predictions to answer this question. Here is a list of some of the most common ones:
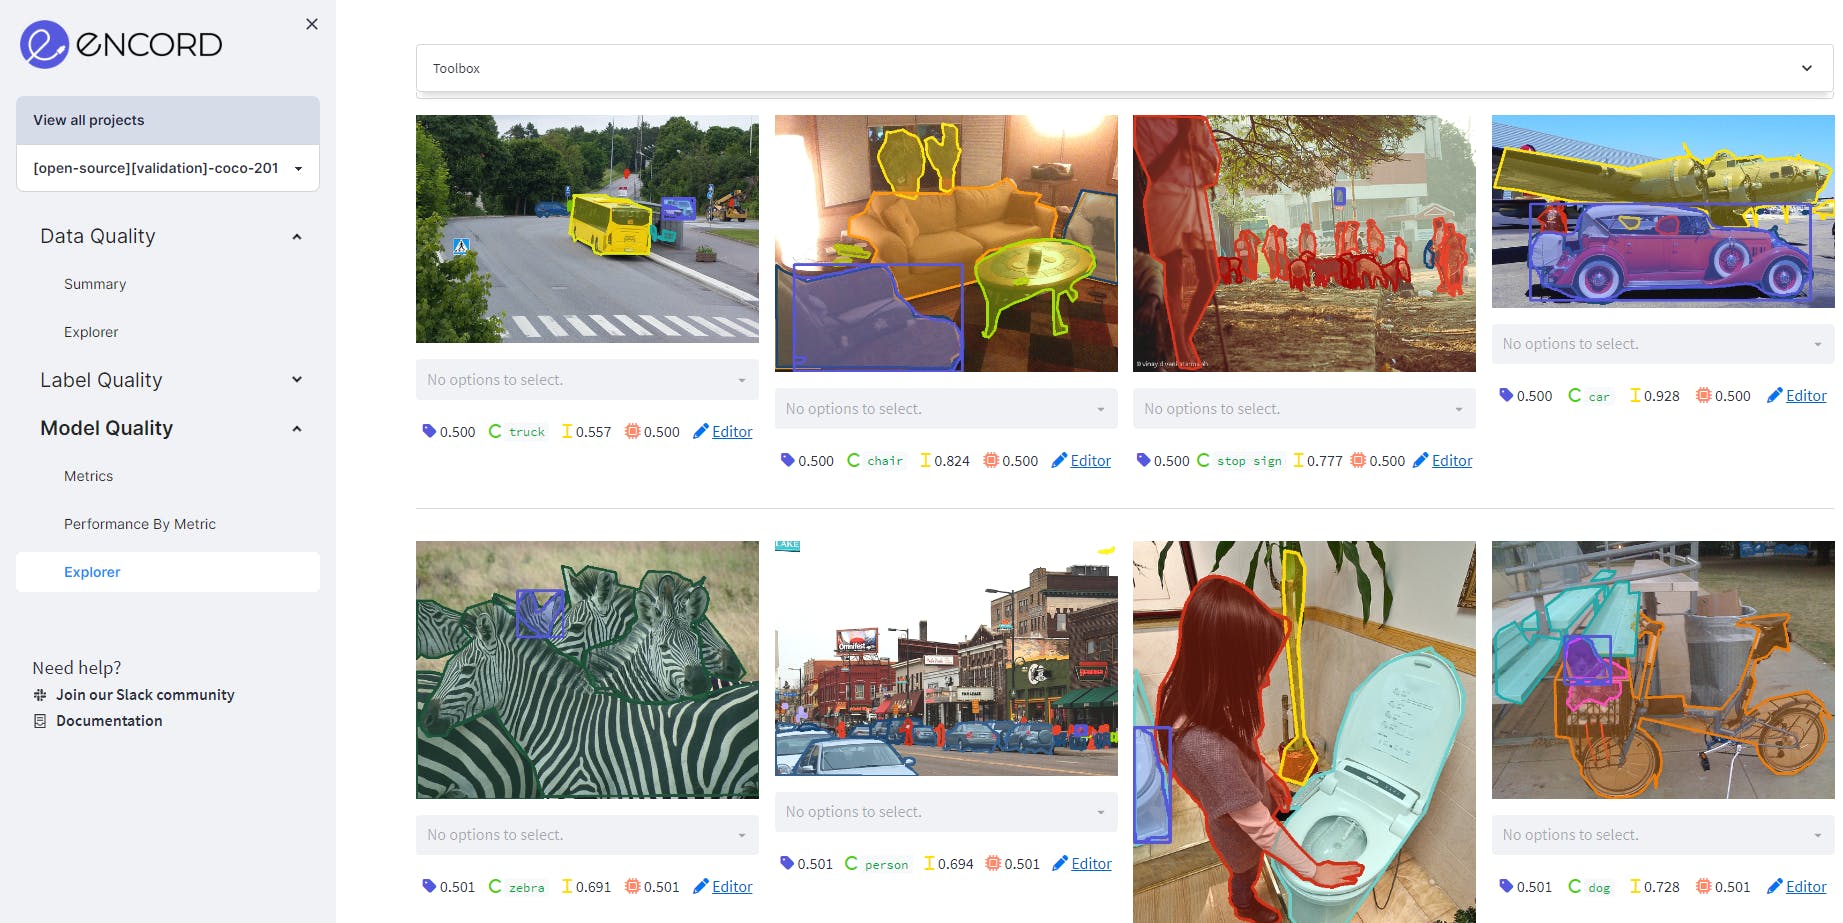
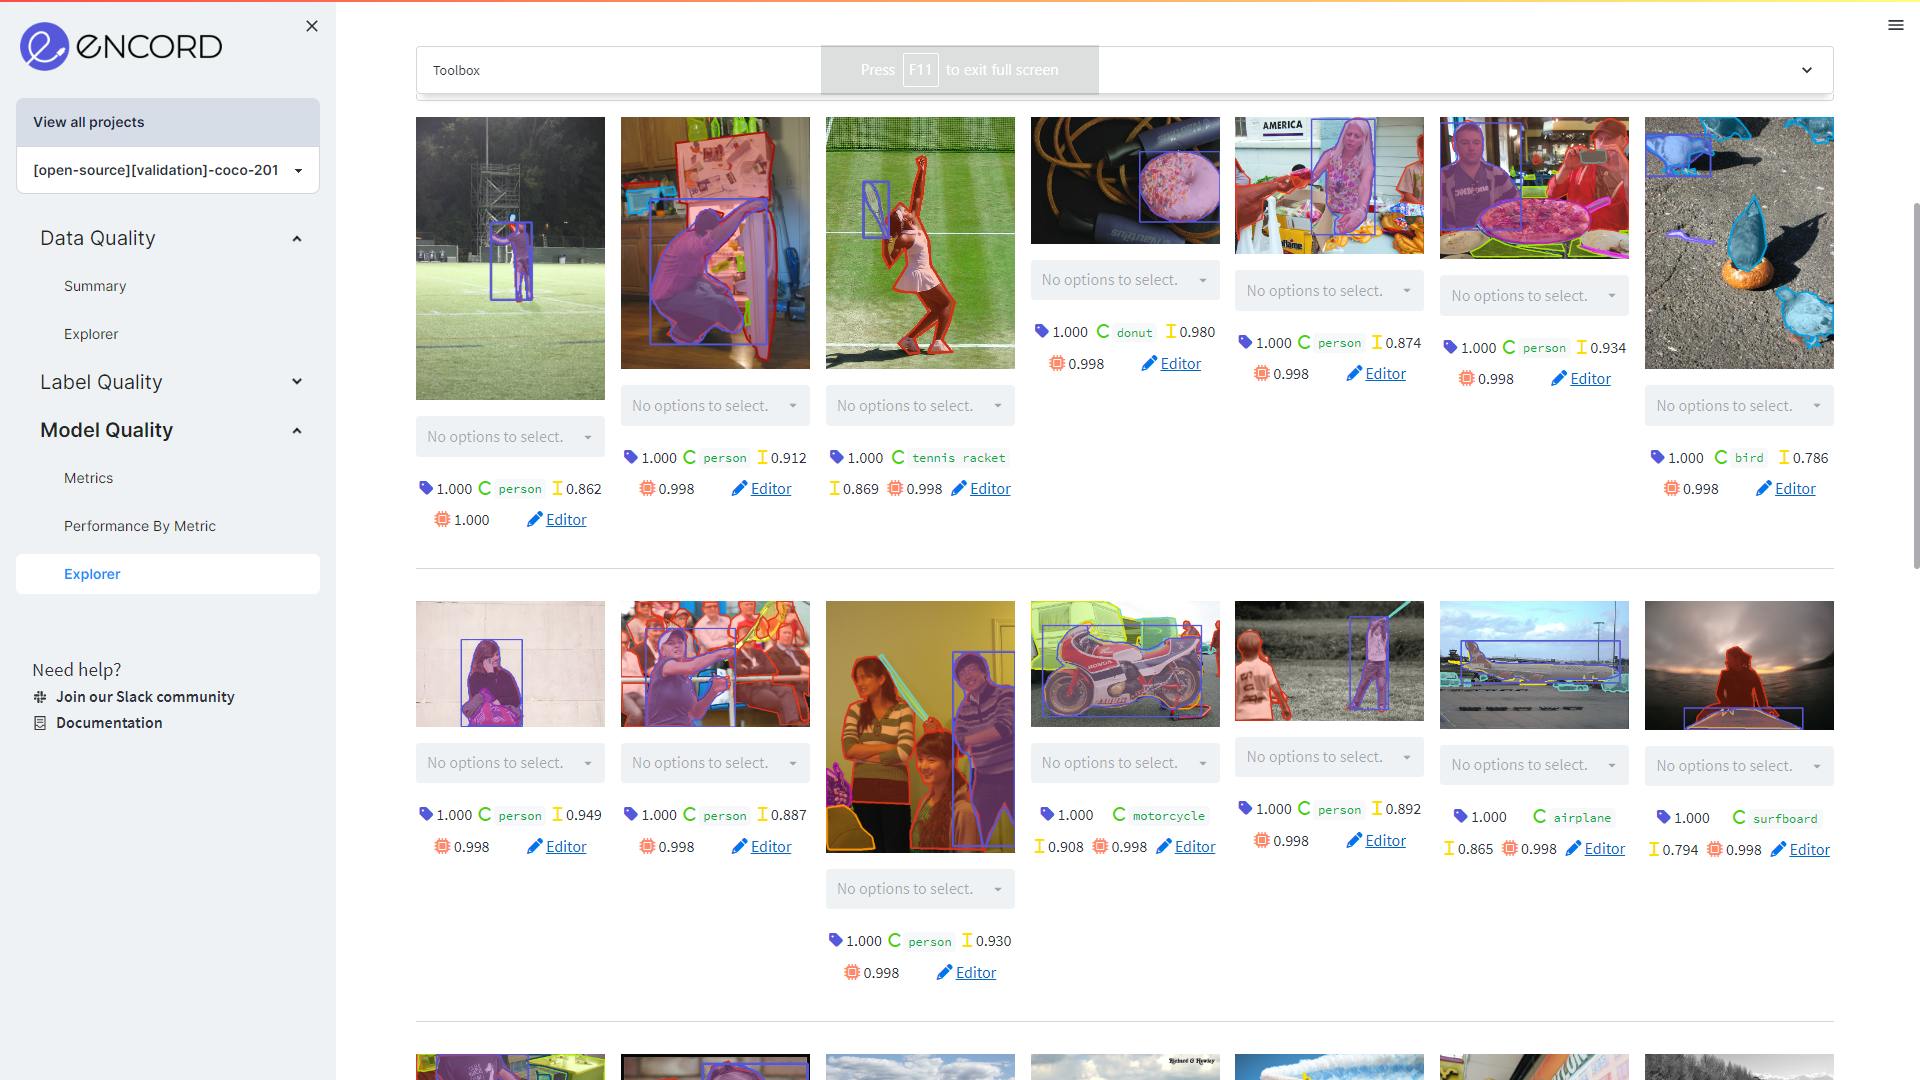
Using Model Confidence as a model quality metric on MS COCO validation dataset on Encord. It shows the predictions where the confidence is between 50% to 80%.
Using Polygon Shape Similarity as a model quality metric on MS COCO validation dataset on Encord. It ranks objects by how similar they are to their instances in previous frames based on Hu moments. The more an object’s shape changes, the lower its score will be.
💡 Tip: To utilize acquisition functions with Encord Active, have a look here. Custom Quality Metrics
We have now reviewed some examples of common quality metrics already in Encord Active.
However, every machine learning project is different, and most likely, you have just the idea of what to compute to surface the data that you want to evaluate or analyze.
With Encord Active, you only need to define the per-data-point computation. The tool will handle everything from executing the computation to visualizing your data based on your new metric.
You may want to know when your skeleton predictions are occluded or in which frames of video-specific annotations are missing.
You could also get even smarter and compare your labels with results from foundational models like SAM.
These different use cases are situations where you would build your custom metrics.
You can find the documentation for writing custom metrics here or you can follow any of the links provided above to specific quality metrics and find their implementation on GitHub.


Conclusion
Quality Metrics constitute the foundation of systematically exploring, evaluating, and iterating on machine learning datasets and models.
With Encord Active and Encord Index, it’s easy to define, execute, and utilize quality metrics to optimize your data curation and model training processes. Encord Index enhances these efforts by providing robust data management capabilities, including data versioning, quality assurance, and metadata management. These features ensure datasets are meticulously curated and prepared, facilitating accurate model training and evaluation.
Quality metrics in Encord Active can be tailored to specific project requirements, enabling detailed analysis, error detection, and insightful comparisons across datasets. This integrated approach empowers teams to achieve higher accuracy and reliability in their machine learning projects, leveraging comprehensive data management solutions alongside advanced quality metrics.
Ready to improve the performance and quality metrics of your CV models?
Sign-up for an Encord Free Trial: The Active Learning Platform for Computer Vision, used by the world’s leading computer vision teams.
AI-assisted labeling, model training & diagnostics, find & fix dataset errors and biases, all in one collaborative active learning platform, to get to production AI faster. Try Encord for Free Today.
Want to stay updated?
- Follow us on Twitter and LinkedIn for more content on computer vision, training data, and active learning.
- Join the Slack community to chat and connect.
Frequently asked questions
Encord provides tools for assessing the quality of data captures, including grading and rating mechanisms that help users evaluate the effectiveness of their data collection processes. This is essential for ensuring that the data used for training machine learning models meets the required standards.
Encord offers quality assurance features that include preference ranking between different outputs, allowing teams to compare master data with newly generated models. This ensures that users can effectively evaluate the quality of their data and make informed decisions about their model training.
Encord offers features that help teams evaluate the quality of their data, allowing them to determine what is missing and what data to acquire. This includes tools for annotating data and assessing the effectiveness of existing datasets, ensuring informed decisions on future data purchases.
Encord offers features that help users assess data quality by providing insights into label metrics and performance. Users can analyze the distribution of labeled data and identify inconsistencies, allowing for more informed decisions in the model training process.
Encord supports quality assurance processes by allowing users to sample and review annotations before they are finalized. This ensures that the data meets the required standards for accuracy and reliability, which is crucial in machine learning applications.
Encord focuses on ensuring high-quality data through its comprehensive annotation platform, which enhances the accuracy of labeled datasets. By improving data quality, Encord directly contributes to better model performance in machine learning applications.
Encord leverages its expertise and collaborates with agencies to curate high-quality datasets for its marketplace. The platform has a history of supporting numerous customer use cases, which enhances the reliability and relevance of the datasets offered.
Encord provides flexible data quality control capabilities to ensure high standards throughout the annotation process. By consolidating tools and organizing tasks effectively, users can maintain oversight and ensure the accuracy of their data.
Encord offers features that allow users to set up workflows aimed at improving data quality. By creating collections for wrong classes, missing labels, and updated ontology, users can systematically explore and address data inconsistencies.
Encord tracks various metrics through its workflow management system, such as annotation duration, QA participation, and label creation, providing analytics that help maintain high data quality throughout the annotation process.