Part 1: Evaluating Foundation Models (CLIP) using Encord Active

Foundation models (FMs) are new waves of artificial intelligence (AI) models you train on massive loads of unlabeled data, such as images and texts. As a result, you could use FMs on a wide range of tasks, including image classification, natural language processing, code generation, etc., with minimal fine-tuning.
CLIP (Contrastive Language-Image Pre-Training) is a foundational model trained on a massive dataset of image and text pairs. You can use natural language instructions to guide the model in predicting the most relevant text snippet related to an image without precisely fine-tuning it for that particular task. It is similar to the zero-shot capabilities observed in GPT-2 and GPT-3.
Encord Active is an open-source toolkit for active learning that enables you to identify failure patterns in your models and enhance both the quality of your data and the performance of your models. Leveraging the capabilities of Encord Active, you can visualize your data, assess your models to uncover instances where models fail, detect labeling errors, prioritize valuable data for re-labeling, and so on.
However, it is essential to know that FMs can be inaccurate and biased. In this two-part series, you will use the predictions from CLIP to train a convolutional neural network (CNN) and then use Encord Active to evaluate the performance.
In the first part of the series (this read), you will:
- Download a dataset that contains images of different facial expressions, split it into train/validation/test splits, apply the CLIP model to get predictions, and turn them into ground truth labels.
- Import the dataset and CLIP model for image-text classification predictions into Encord Active for evaluation.
In the second article, you will:
- Train a CNN model on the ground truth labels from the CLIP model.
- Import the data, ground truth labels, and model into Encord Active and evaluate the model.
Let’s jump right in! 🚀
Evaluate a CLIP Model on A Dataset with Ground Truth Labels
In this section, you will use a CLIP model to classify a dataset with images of different facial expressions. You will approach this task by following the steps below:
- Set up a Python environment for `encord active`
- Download the dataset and create an Encord Project
- Make predictions with CLIP
- Import predictions into Encord Active for evaluation
Set up A Python Environment for Encord Active
Encord Active requires a Python version of 3.9, 3.10, or 3.11. A small request 💜: we’d love to get Encord Active to 1,000 ✨s; consider supporting the library by leaving a ⭐ on the repo.
Now, back to the setup ➡️ Run the code below on your command line to set up a Python virtual environment and install the encord-active library.
python3.9 -m venv ea-venv

# On Linux/MacOS
source ea-venv/bin/activate

# On Windows
ea-venv\Scripts\activate

# Install encord-active library
python -m pip install encord-active==0.1.69
Next, install the CLIP library from this repository alongside the `tqdm` library to help you monitor the task's progress.
# Install tqdm
python -m pip install tqdm

# Install CLIP
python -m pip install git+https://github.com/openai/CLIP.git
Download Dataset and Create an Encord Project
You will use a dataset that contains images of different facial expressions, including:
- anger,
- disgust,
- fear,
- happiness,
- neutrality,
- sadness,
- and surprise.
You can find and download the dataset here.
Create a directory; the directory will serve as the root folder for this task. Move the downloaded dataset to the root folder and unzip it using the command below:
unzip emotions.zip
Creating an Encord Project starts with importing the dataset. Next, run the shell command below from your root directory:
encord-active init --name EAemotions ./emotions
The name flag specifies the custom name of the project.
Assuming the dataset provided is not labeled, you can use the “transformer” option to reference a Python script that defines how to parse the labels.
Here is an example of inferring classification for the image dataset.
# classification_transformer.py

from pathlib import Path
from typing import List

from encord_active.lib.labels.label_transformer import (
	ClassificationLabel,
	DataLabel,
	LabelTransformer,
)

class ClassificationTransformer(LabelTransformer):
	def from_custom_labels(self, _, data_files: List[Path]) -> List[DataLabel]:
    	return [
        	DataLabel(f, ClassificationLabel(class_=f.parent.name))
        	for f in data_files
    	]
To learn more about importing data into Encord, you can read the official Encord Active documentation.
After creating the encord-active project with the encord-active init command above, you should have a folder - “EAemotions” created in your root directory. If everything works fine, your root directory tree should look like this:
.
├── EAemotions
│   ├── data
│   ├── embeddings
│   ├── image_data_unit.json
│   ├── label_row_meta.json
│   ├── metrics
│   ├── ontology.json
│   └── project_meta.yaml
├── classification_transformer.py
└── emotions
	├── angry
	├── disgust
	├── fear
	├── happy
	├── neutral
	├── sad
	└── surprise

12 directories, 5 files
Make and Import CLIP Model Predictions into Encord-Active Project
In this section, you will use the CLIP model to classify the image dataset, and next, you will import the predictions into encord-active.
When preparing predictions for import, keeping track of the class_id of each prediction is very important. The class_id informs encord-active of the class to which each prediction belongs. The class_ids of an Encord project are defined by the featureNodeHash attribute on objects in the Encord ontology.
Export the class names and class_ids in the encord-active project:
# Change Directory
cd ./EAemotions

# Store ontology
encord-active print --json ontology
You should find a newly created JSON file, ontology_output.json, in the “EAemotions” directory.
.
├── EAemotions
│   ├── data
│   ├── embeddings
│   ├── image_data_unit.json
│   ├── label_row_meta.json
│   ├── metrics
│   ├── ontology.json
│   ├── ontology_output.json
│   └── project_meta.yaml
├── classification_transformer.py
└── emotions
    ├── angry
	├── disgust
	├── fear
    ├── happy
    ├── neutral
	├── sad
    └── surprise

12 directories, 6 files
Image Classification Using CLIP Foundational Model
In your root directory, create a Python script with the name make_clip_predictions.py (you can use any custom file name).
Import the required libraries and define some important variables.
# make_clip_predictions.py

import json
import os
import pickle
from pathlib import Path
import shutil

import cv2
import clip
import matplotlib.pyplot as plt
import numpy as np
from sklearn.metrics import classification_report
from sklearn.metrics import confusion_matrix
import torch
from torchvision import transforms
from tqdm import tqdm

from encord_active.lib.db.predictions import FrameClassification, Prediction
from encord_active.lib.project import Project

# Setup device
device = "cuda" if torch.cuda.is_available() else "cpu"
print("device: ", device)

# load clip model
model, preprocess = clip.load("ViT-B/32", device=device)

# Import encord project
project_path = r'EAemotions'
project = Project(Path(project_path)).load()
In the code above, you loaded the CLIP “ViT-B/32” model, and the last three lines show how you can import an Encord project into the script using the Python SDK library.
Next, load the project ontology and define the classes in the dataset.
project_ontology = json.loads(
	(project.file_structure.project_dir/'ontology_output.json').read_text()
)

ontology = json.loads(
	project.file_structure.ontology.read_text(encoding="utf-8")
)

# Image classes
classes = []
for option in ontology["classifications"][0]["attributes"][0]["options"]:
	classes.append(option["value"])
Since CLIP requires both images and encoded text to make classifications, create a function that makes texts out of the classes and encodes them.
# encode class texts
def generate_encoded_texts_from_classes():
	tkns = [f'A photo of a {class_} face' for class_ in classes]
	texts = clip.tokenize(tkns).to(device)
	return texts

encoded_texts = generate_encoded_texts_from_classes()
Generate your custom metrics for this classification for performance comparison using the encord-active evaluation. Create a function that gets the label of each data_hash in the project.
# Function to extract image label from label_rows metadata
def get_label(classification_answers):
	k = list(classification_answers.keys())[0]
	classification_answers = classification_answers[k]
	answers = classification_answers['classifications'][0]['answers']
	label = answers[0]['value']
	return label
Next, define variables to store “prediction labels,” “predictions to export,” “image paths,” and “image labels.”
- The “prediction labels” consist of all the predicted classes;
- “predictions to export” contains all the prediction objects;
- “image paths” is a list of all the image paths of each data_hash;
- “image labels” contain the true labels of each data_hash.
# Variables
my_predictions = []  # To store predicted labels
predictions_to_import = []  # Predictions to be imported into encord-active
image_paths = []  # List of all image paths

# List of all image True classes
image_labels = [
    get_label(lr['classification_answers'])
    for lr in project.label_rows.values()
]
Note: These variables were created to make it easy for you to access their content for later use.
Now, let’s make predictions.
# Make predictions
for item in tqdm(project.file_structure.iter_labels()):
    for data_unit_hash, image_path in item.iter_data_unit():
        data_unit_hash, image_path = str(data_unit_hash), str(image_path)
        image_paths.append(image_path)
        image = cv2.imread(image_path)
        image = cv2.cvtColor(image, cv2.COLOR_BGR2RGB)
        image_transformed = transform_f(image)

        with torch.no_grad():
            logits_per_image, logits_per_text = model(
                image_transformed.to(device).unsqueeze(dim=0),
                encoded_texts
            )
            class_id = logits_per_image.argmax(dim=1, keepdim=True)[0][0].item()
            model_prediction = project_ontology['classifications'][classes[class_id]]
            my_predictions.append(classes[class_id])
            confidence = logits_per_image.softmax(1).tolist()[0][class_id]

            predictions_to_import.append(
                Prediction(
                    data_hash=data_unit_hash,
                    confidence=confidence,
                    classification=FrameClassification(
                        feature_hash=model_prediction['feature_hash'],
                        attribute_hash=model_prediction['attribute_hash'],
                        option_hash=model_prediction['option_hash'],
                    ),
                )
            )
In the code above, you looped through each data hash in the project label_rows metadata. From the metadata, you extracted the image path and image label. You read the image using the OpenCV library and applied some transformations.
It sends the transformed image and the encoded text list as input to the CLIP model. Then the prediction result was appended to the predictions_to_import list as a Prediction object.
Now that you have stored all the CLIP predictions in a list (prediction_to_import) save them as a pickle file.
# Export predictions
with open(f"{project_path}/predictions.pkl", "wb") as f:
	pickle.dump(predictions_to_import, f)
Next, generate your metrics so that you can compare them with Encord Active evaluations:
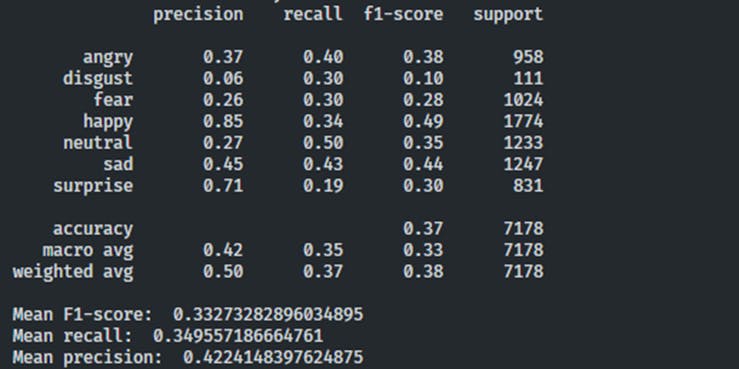
# Metrics
print(classification_report(
image_labels,
my_predictions, target_names=classes
)
)
report = classification_report(
image_labels,
my_predictions,
target_names=classes,
output_dict=True
)
mean_f1_score = report['macro avg']['f1-score']
mean_recall = report['macro avg']['recall']
mean_precision = report['macro avg']['precision']
print("Mean F1-score: ", mean_f1_score)
print("Mean recall: ", mean_recall)
print("Mean precision: ", mean_precision)
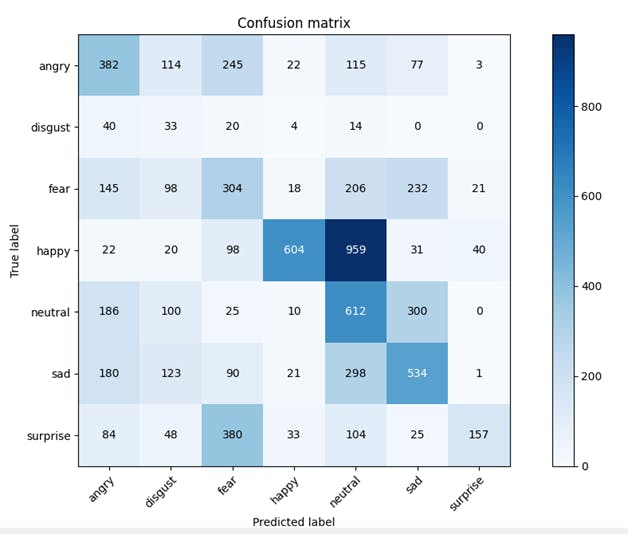
cm = confusion_matrix(image_labels, my_predictions,)fig, ax = plt.subplots() im = ax.imshow(cm, cmap='Blues')
cbar = ax.figure.colorbar(im, ax=ax)
ax.set(xticks=np.arange(cm.shape[1]),
   	yticks=np.arange(cm.shape[0]),
   	xticklabels=classes,
   	yticklabels=classes,
   	xlabel='Predicted label',
   	ylabel='True label')

plt.setp(ax.get_xticklabels(), rotation=45, ha="right",
     	rotation_mode="anchor")

for i in range(cm.shape[0]):
	for j in range(cm.shape[1]):
    	ax.text(j, i, format(cm[i, j], 'd'),
        	    ha="center", va="center",
            	color="white" if cm[i, j] > cm.max() / 2. else "black")

ax.set_title("Confusion matrix")
plt.show()
Later in this article, you will use the predictions from the CLIP model as ground truth labels for training a CNN model. A function creates a new dataset using the CLIP predictions as ground truth labels.
Execute the Python script using the command:
python make_clip_predictions.py
That should take a few minutes to execute. You can locate the Python script in the root directory. The script saves predictions.pkl in the Encord project directory and creates a new dataset with the CLIP predictions as GT labels.
Also, in your console output, you should see the metrics you coded:
Import CLIP prediction into Encord Active
In the previous code, you saved the model’s prediction in a pickle file. Import the model predictions into Active for model evaluation and run the following command from your root directory:
# Change to Project directory
cd ./EAemotions

# Import Predictions
encord-active import predictions.pkl

# Start encord-active web app server
encord-active visualize
The commands above import the predictions into Encord and start a webserver on localhost - http://localhost:8501. Open the web server link in your browser. You should have something like the one below:
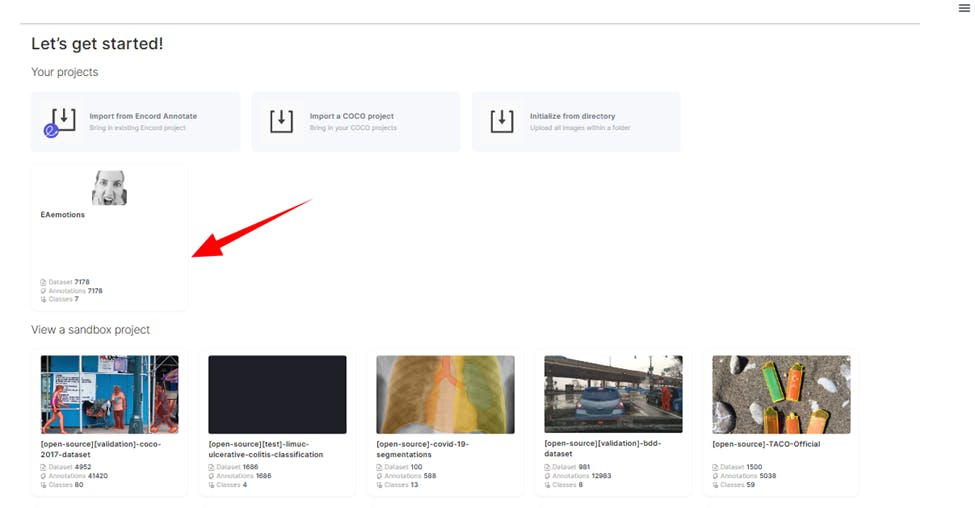
Navigate to the project page by clicking “EAemotions” project. The project page should look like the one below:

Click “Model Quality" in the left to view model evaluation options and metrics. A dropdown menu should appear. Select Metrics to see Encord Active's evaluation of the CLIP model.
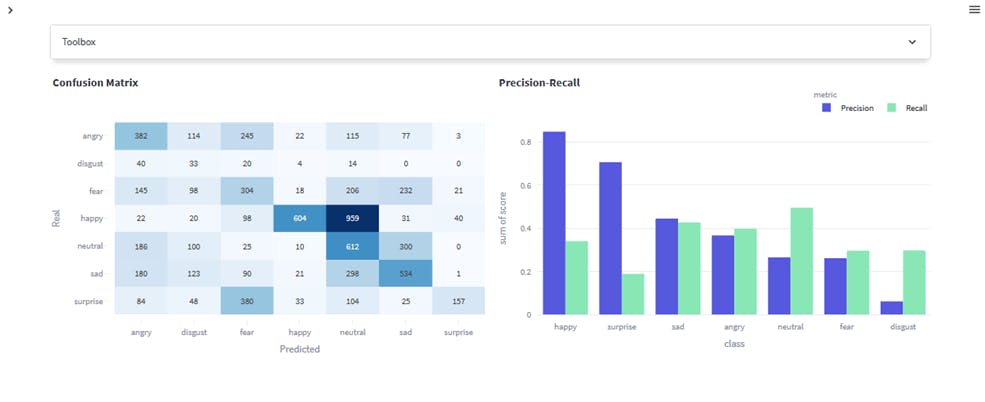
Interpreting the CLIP prediction results
The classification metrics indicate poor performance by the CLIP model. An accuracy of 0.37 suggests that only 37% of the predictions are correct on the entire dataset. A mean precision of 0.42 indicates that, on average, the model is valid for 42% of the positive predictions. In contrast, a mean recall of 0.35 suggests it captures only 35% of the instances belonging to a class. The mean F1 score of 0.33 reflects the overall balance between precision and recall, but it is still relatively low.
Improving the model's performance may require addressing issues such as imbalanced data, model complexity, and feature representations through data augmentation, adjusting class weights, and using more sophisticated models.
Metric importance quantifies the strength of the relationship between a metric (sharpness, brightness of an image, blurriness, e.t.c.) and model performance. A high importance value indicates that changes in the metric significantly impact the model's performance. For instance, altering this metric would strongly affect the model's performance if brightness is critical.
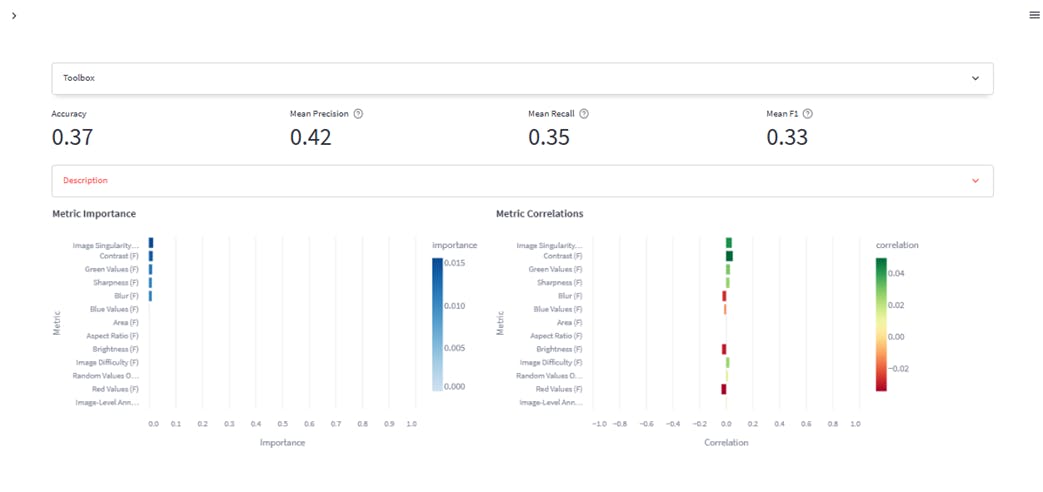
The values of this metric lie between 0 (no significant impact) and 1 (perfect correlation, where the metric alone can predict model performance). The visual above shows that image singularity, contrast, green values, sharpness, and blur have relatively little impact on the model’s performance. While the other metrics, such as blue values, area, brightness, etc., have no significance to the model’s performance.
On the other hand, “Metric Correlations” assess the linearity and direction of the relationship between a metric and model performance. It informs whether a positive change in the metric leads to a positive change (positive correlation) or a negative change (negative correlation) in the model's performance. The correlation values range from -1 to 1, indicating the strength and direction of the relationship between the metric and the model's performance.
Furthermore, you can filter the results by labels to see individual scores and model performance in a particular class. For example, the image below shows the scores and metrics for the “angry” class.
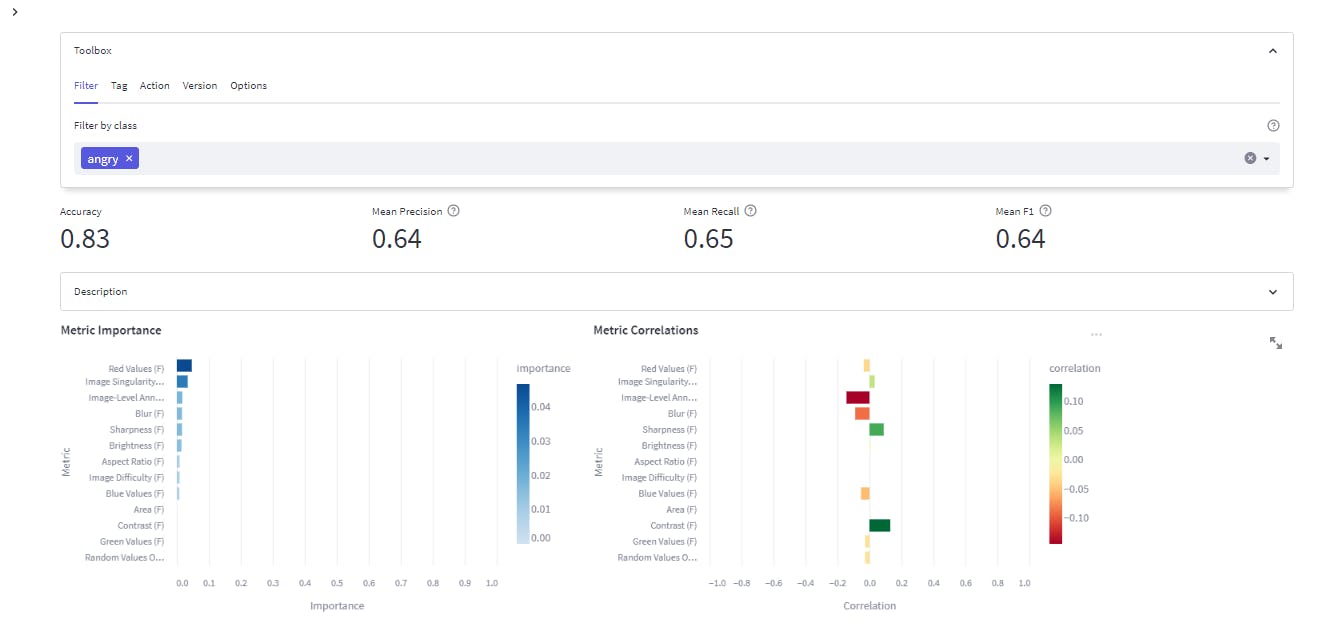
Apply filters for other classes to gain more insight into the model's performance and how to improve it.
In the next article, you will discover how to:
- train a CNN model using the dataset created using labels that the CLIP model predicted.
- import the predictions into Encord for performance evaluation.
Check out the project on Encord Active on GitHub and leave a star 🌟 if you like it, or an issue if you find something is missing—we love feedback!
Frequently asked questions
Using Encord for both data curation and model evaluation offers significant ROI benefits. By having both capabilities in one place, teams can improve the speed of model development, as they can easily curate high-quality training data and evaluate model performance without switching between different tools.
Encord supports model evaluation through its active learning and closed-loop capabilities, allowing organizations to bring in model predictions and identify failure modes. This functionality is crucial for reducing errors and improving model performance, especially in high-stakes environments.
Encord plays a crucial role in model evaluation by helping teams understand the data versions their models have been trained on and how this affects model performance. Our tools assist in identifying areas for improvement and guiding teams in selecting new data to enhance their models.
Encord Active allows users to view all their data and labels while integrating model predictions to identify edge cases. This feature is particularly useful for applications, such as humanoid robots, where recognizing diverse facial expressions across different demographics is crucial.
Evaluating Encord typically involves uploading a subset of your data to test its functionality. Users can conduct a self-demo to explore features and share results with their teams. This hands-on experience helps assess how Encord can speed up training setups and meet specific needs.
Yes, Encord supports active learning and model evaluation by providing tools that facilitate the assessment and improvement of machine learning models. This feature allows users to iteratively refine their models based on curated data, enhancing their predictive accuracy.
Yes, Encord allows users to clone existing ontologies, creating a carbon copy that can be modified for specific projects. The cloned ontology becomes independent of the master, enabling customization without affecting the original ontology linked to other projects.
Encord allows users to evaluate and analyze the performance of various models on the same dataset. This capability enables teams to identify edge cases where models diverge, highlighting strengths and weaknesses for informed decision-making.
Yes, Encord is designed to assist in building more powerful, domain-specific models for defect inspection. The platform facilitates data curation processes that are essential for training these specialized models effectively.