Step-by-Step Guide: 4 Ways to Debug Computer Vision Models

What is Computer Vision Model Debugging?
We get it–
Debugging deep learning models can be a complex and challenging task.
Whereas software debugging follows a set of predefined rules to find the root of a problem, deep learning models can be very powerful and complicated, which makes it hard to find bugs in them.
The more advanced the neural network selected for the model, the more complex the issues it can have, and the more it behaves as a black box. This is especially true for computer vision models, which are known for their ability to learn relevant features from image data.
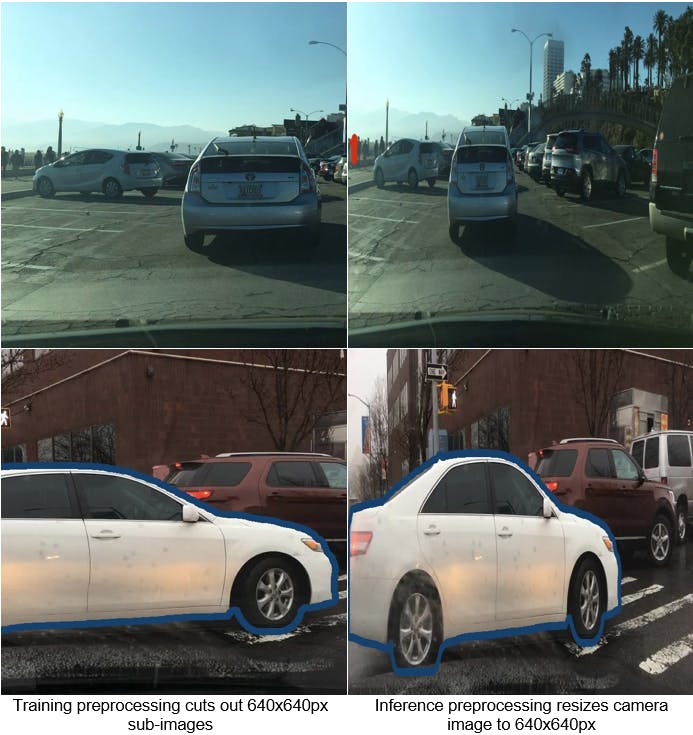
For example, a deep learning model that has been trained with wrongly preprocessed data can still get good results, but it will fail when tested on a new dataset that has been properly preprocessed.
There are many ways to address these problems in machine learning algorithms and make them work better.
Firstly, it is crucial to identify flaws in the input data and labels using tools like Encord Index.
This kind of data assessment helps identify potential issues such as missing values, incorrect data, outliers, or skewed data distribution.
Secondly, it is possible to find the optimal model hyper-parameters by monitoring training progress with tools like Weights & Biases or TensorBoard. Additionally, monitoring training progress can help detect model problems early on.
In this post, we will cover 4 practical ways to efficiently debug your computer vision models:
- Use Encord Index to debug your computer vision dataset
- Use Jupyter to debug your computer vision model
- Use Weights & Biases to monitor and debug your computer vision model
- Use TensorBoard to track the performance of your computer vision model
Before we dive into the tutorial and cover the four ways, let’s go over why we need to debug models first.
Why do you need to debug computer vision models?
Debugging is a necessary step in developing computer vision models and algorithms. Computer vision models and algorithms are central to various applications and use cases, such as image classification, object detection, and segmentation.
The models require high precision and accuracy, as even small errors can have significant consequences. Thus, data scientists and ML engineers must be prudent when debugging.
For example, in the case of object detection, a false positive or false negative can lead to incorrect decision-making and actions - a false medical diagnosis made by an image classifier or a car accident caused by autopilot.

Example of confused computer vision model - source
Debugging is especially important because these models are trained using large amounts of data, and even small errors can cause significant inaccuracies. ML models are often not as robust as one would think.
Debugging models involves analyzing data, testing the model, and identifying potential problems. This includes finding and fixing bugs, optimizing performance, and enhancing accuracy.
It is an iterative process that requires a thorough understanding of neural networks (especially convolutional neural networks (CNN)), the model, its structure, and the data used for training.
It helps to ensure that the models are working correctly and accurately and are less susceptible to overfitting.
How to debug machine learning models for computer vision?
Debugging involves several steps that help identify and resolve issues in models. The following are the steps involved in debugging your computer vision models:
- Data analysis
- Model testing
- Error analysis
- Visualizing predictions
- Performing ablation studies
Data analysis
The first step in debugging a computer vision model is to examine the data used for training. The data must be of high quality and free of errors.

The quality of the data directly affects the accuracy of the model. Analyzing the data involves checking the distribution of data and ensuring that it is balanced and diverse. A balanced dataset ensures the model is not biased towards a particular class, leading to better accuracy.
Another way to improve data quality is by visualizing the model's predictions and comparing them to the ground truth. Visualizing the predictions helps to identify discrepancies and understand the reasons for errors in the model.

Check out this GitHub repo for help with visualizing model predictions.
A large-scale, high-quality dataset is crucial for the state-of-the-art performance of convolutional and transformer models.
Model testing
Model testing involves running trained models on a test dataset and evaluating their performance. This is essential in debugging deep learning models, as it helps identify any issues.
Testing the model helps to determine its accuracy and loss metrics. Loss and accuracy metrics are key indicators of the performance of a computer vision model.
Such metrics help to determine the model's accuracy and identify any issues that need to be addressed.
By examining the loss and accuracy metrics, it is possible to determine whether the model is overfitting or underfitting and to make the necessary adjustments.
Error analysis
After testing the model, the next step is to perform an error analysis. Error analysis involves examining the model testing results to identify any errors or issues that need to be addressed. The objective of error analysis is to determine the root cause of any errors in the model and to find a solution to fix them.

Error analysis in Encord Active
Perform ablation studies
Ablation studies are a powerful tool for debugging computer vision models. This technique involves removing or changing individual components of the model to determine their impact on its performance and benchmarking them against each other.
Ablation studies help identify the model's most important components and determine the reasons for any errors.
![]()
Example of tracking ablation studies in YOLOX (Source:https://arxiv.org/pdf/2107.08430.pdf)
The next sections will review popular tools for debugging machine learning models. The table below summarizes the debugging method supported by these tools.

What’s the best way to debug a computer vision model?
The best way to debug a computer vision model will vary depending on the specific model and problem it is being used to solve, but several best practices can be followed to make the process more effective.
Start with a clear understanding of the problem and data:
Before diving into the debugging process, it's essential to have a good understanding of the problem being solved and the data being used. This will help guide the process and ensure that the proper steps are taken to fix the model.
Use a systematic approach
A systematic approach, such as data analysis, model testing, error analysis, and ablation studies (outlined above), can help to ensure that all aspects of the model are thoroughly examined and that any issues are identified and addressed.
Keep detailed records
Keeping a detailed record of the debugging process, including any changes made to the model, can help to understand the causes of any issues and track progress in resolving them.
Work with a team
Collaborating with a team can provide multiple perspectives and expertise that can be invaluable in identifying and solving problems more efficiently.
Utilize visualization tools
Visualization tools can help to better understand the model's behavior and make informed decisions about changes that need to be made.
By following these best practices, the debugging process for computer vision models can be optimized, resulting in improved accuracy and state-of-the-art performance.

Four Ways To Debug Your Computer Vision Models
Debugging a computer vision model can be a complex and time-consuming process. Still, it is critical to ensure that your model is accurate, reliable, and performs well.
This part will explore four different methods for debugging computer vision models. Whether you prefer to use your favorite Python IDE, Encord Active, Jupyter notebooks, TensorBoard, or Weights & Biases, you will find a solution that best fits your needs and provides the required features and functionality.
Using Encord Active to debug a computer vision model
A data-centric debugging approach focuses on examining the data used for training and testing the model to identify issues that may impact its performance. This approach involves:
- Data cleaning and preprocessing: Ensure the data used for training and testing is clean, complete, and formatted correctly.
- Data visualization: Use visualization techniques like scatter plots, histograms, and box plots to understand the data distribution and identify any outliers or patterns that may affect model performance.
- Data distribution analysis: Analyze the data split (training set, validation set, and test set) to ensure it is representative of the overall data distribution and to avoid overfitting or underfitting the model.
- Feature engineering: Examine the features used for training the model to ensure they are relevant, informative, and not redundant.
- Model evaluation: Use appropriate metrics to evaluate the model's performance on the training and testing data.
By systematically examining the data used for training and testing the model, a data-centric approach can help identify and resolve issues that may significantly impact its performance. Implementing a data-centric pipeline by yourself, however, is a time-consuming approach.
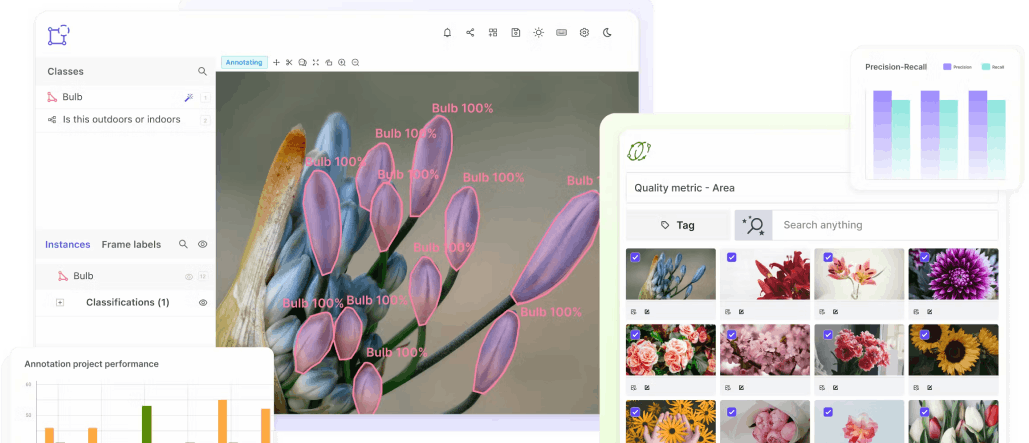
Encord Active is a new open-source active learning toolkit designed with a data-centric approach. It detects label errors efficiently, enabling correction with a few simple clicks. It natively integrates with Encord Index, which has a user-friendly interface and diverse data visualizations, making it easy to use data to understand and debug computer vision models.
Encord Index provides granular data and label debugging:
- data debugging: selecting the right data to use data labeling, model training, and validation
- label debugging: reducing label error rates and label inconsistencies
Encord Active helps with debugging the model by evaluating the mode's performance with respect to different subsets within the dataset you curate with Encord Index, finding which classes of the model do not perform well
All these quality metrics are automatically computed across the dataset after the data, labels, and/or model output predictions are uploaded to the tool. For example:
- You can easily find labeling errors in your dataset (mislabeled objects, missing labels, and inaccurate labels) by providing Encord Active with your dataset and a pretrained model.
- The visual similarity search function allows users to locate similar images and duplicates and monitor label quality.
- Outliers can be identified using precomputed Interquartile ranges displayed on the summary page based on frame-level metrics.
If you’d like to try out Encord Active today you can check out the Github Repo here.
Further reading:
Using Jupyter to debug a computer vision model
Jupyter is a popular open-source tool used for scientific computing, data analysis, and visualization. It is a web-based interactive computational environment that allows you to create and share documents that contain live code, equations, visualizations, and narrative text.
Jupyter notebooks are often used in computer vision research and development to quickly prototype, test, and debug computer vision models.
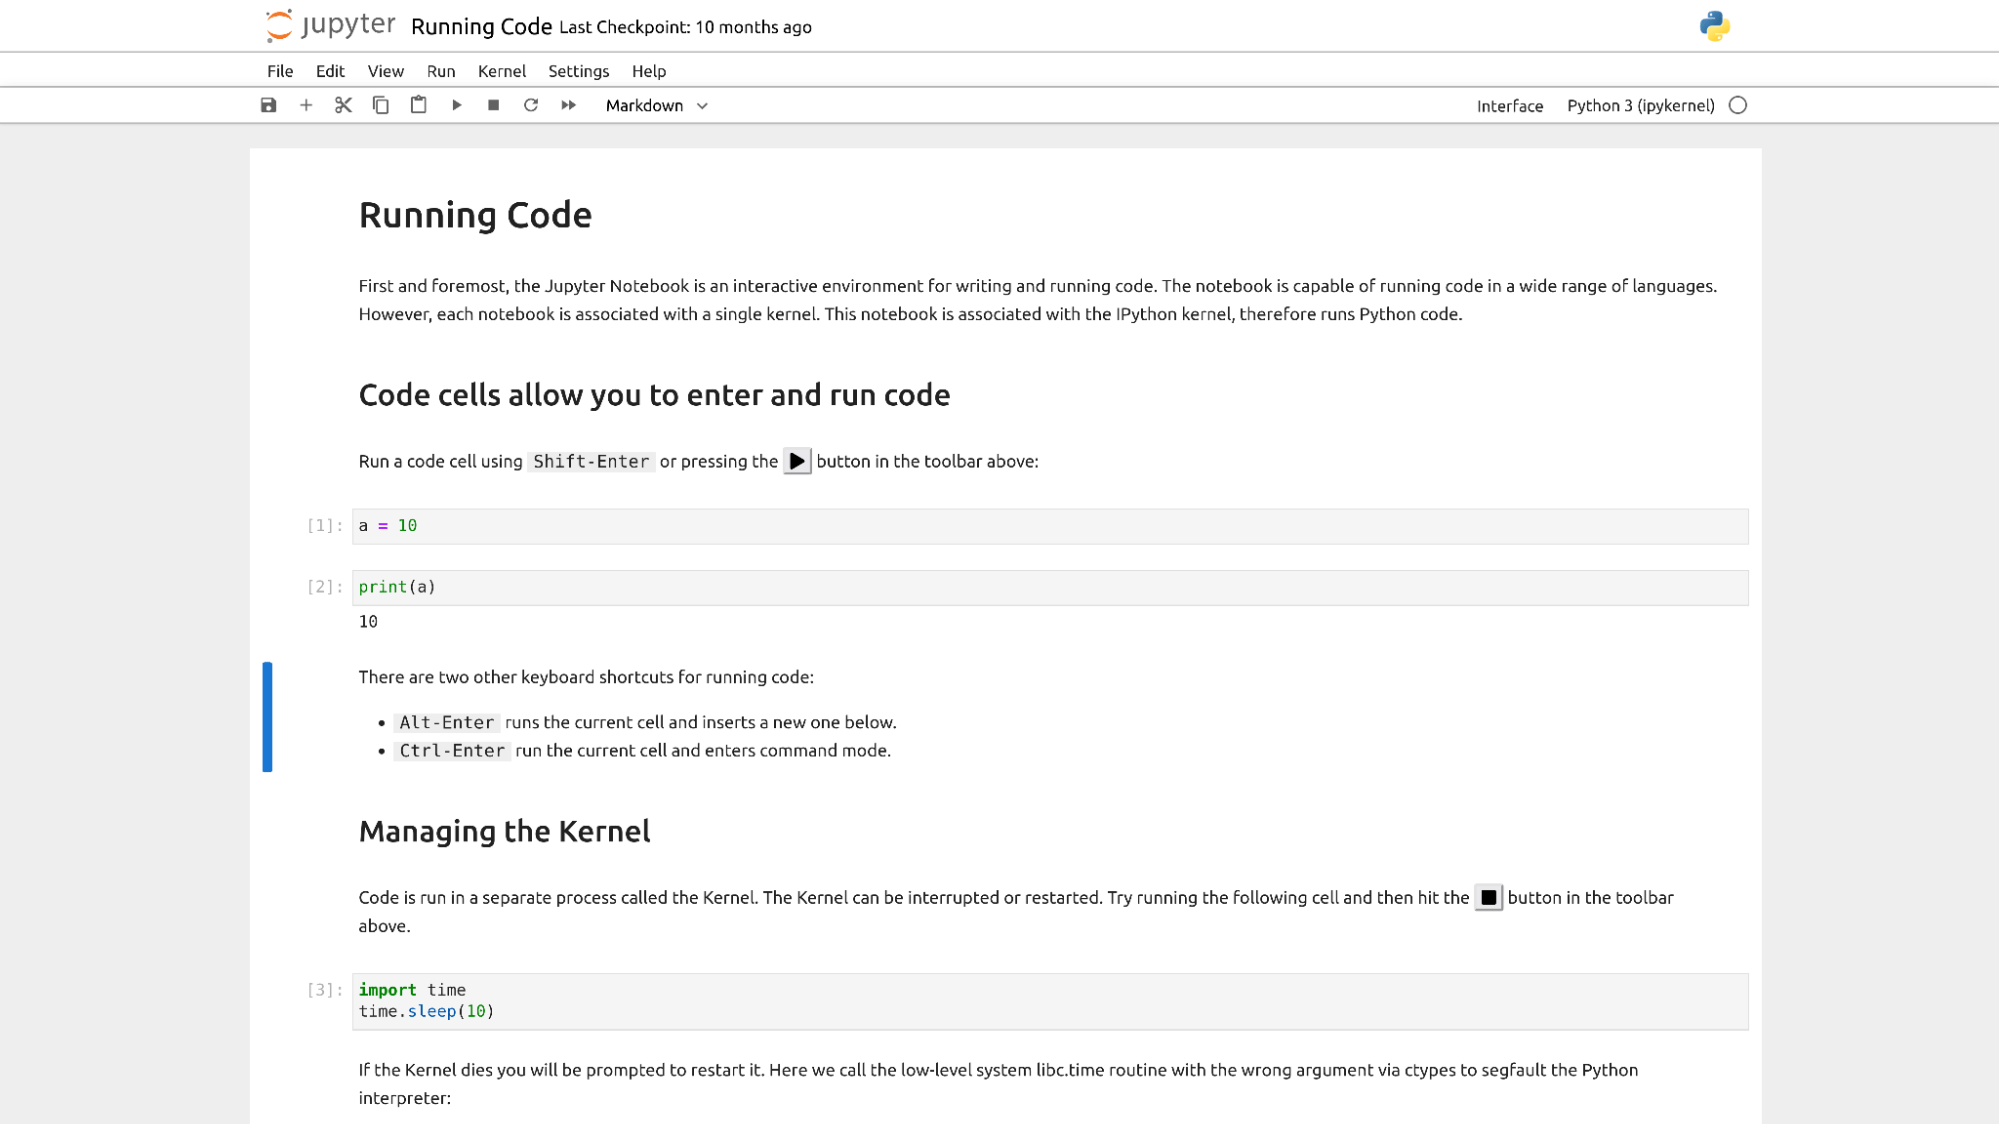
To debug a computer vision model using Jupyter, you must install the necessary libraries, such as NumPy, Matplotlib, OpenCV, and TensorFlow. Once these libraries are installed, you can start writing code in Jupyter to load and test your computer vision model. Jupyter allows you to debug the model's code by using a feature called "Debugging with IPython". IPython is an enhanced interactive Python shell that provides several tools to make debugging easier.
For example, you can use the "pdb" (Python debugger) to step through the code and inspect variables or use the "%debug" magic command to enter an interactive debugger in Jupyter.
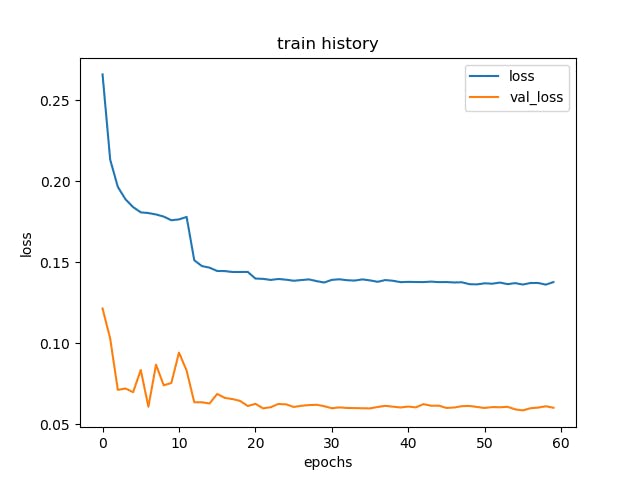
When debugging a computer vision model, it is essential to check the accuracy of the model by evaluating it on a test dataset. To visualize evaluation results, you can use Matplotlib to plot training loss history and the model's accuracy or compare the results with the ground truth data.
Another aspect of debugging a computer vision model is inspecting the model's internal state, such as the weights, biases, and activation functions. In Jupyter, you can inspect the model's internal state by using TensorFlow's TensorBoard.
TensorBoard is a tool that provides a visual interface to visualize the internal state of a TensorFlow model. With TensorBoard, you can inspect the weights and biases of the model, visualize the computation graph, and monitor the model's performance during training.
Finally, Jupyter provides a way to share and collaborate on computer vision models. By sharing Jupyter notebooks, you can share your code, visualizations, and results with others. This makes it easier to collaborate with other researchers and engineers on developing and debugging computer vision models.
Using Weights & Biases to debug a computer vision model
Weights & Biases is an artificial intelligence platform that provides an interactive dashboard to monitor and debug machine learning models. The platform offers a range of features to analyze the performance of deep neural network models and understand how they are making predictions.
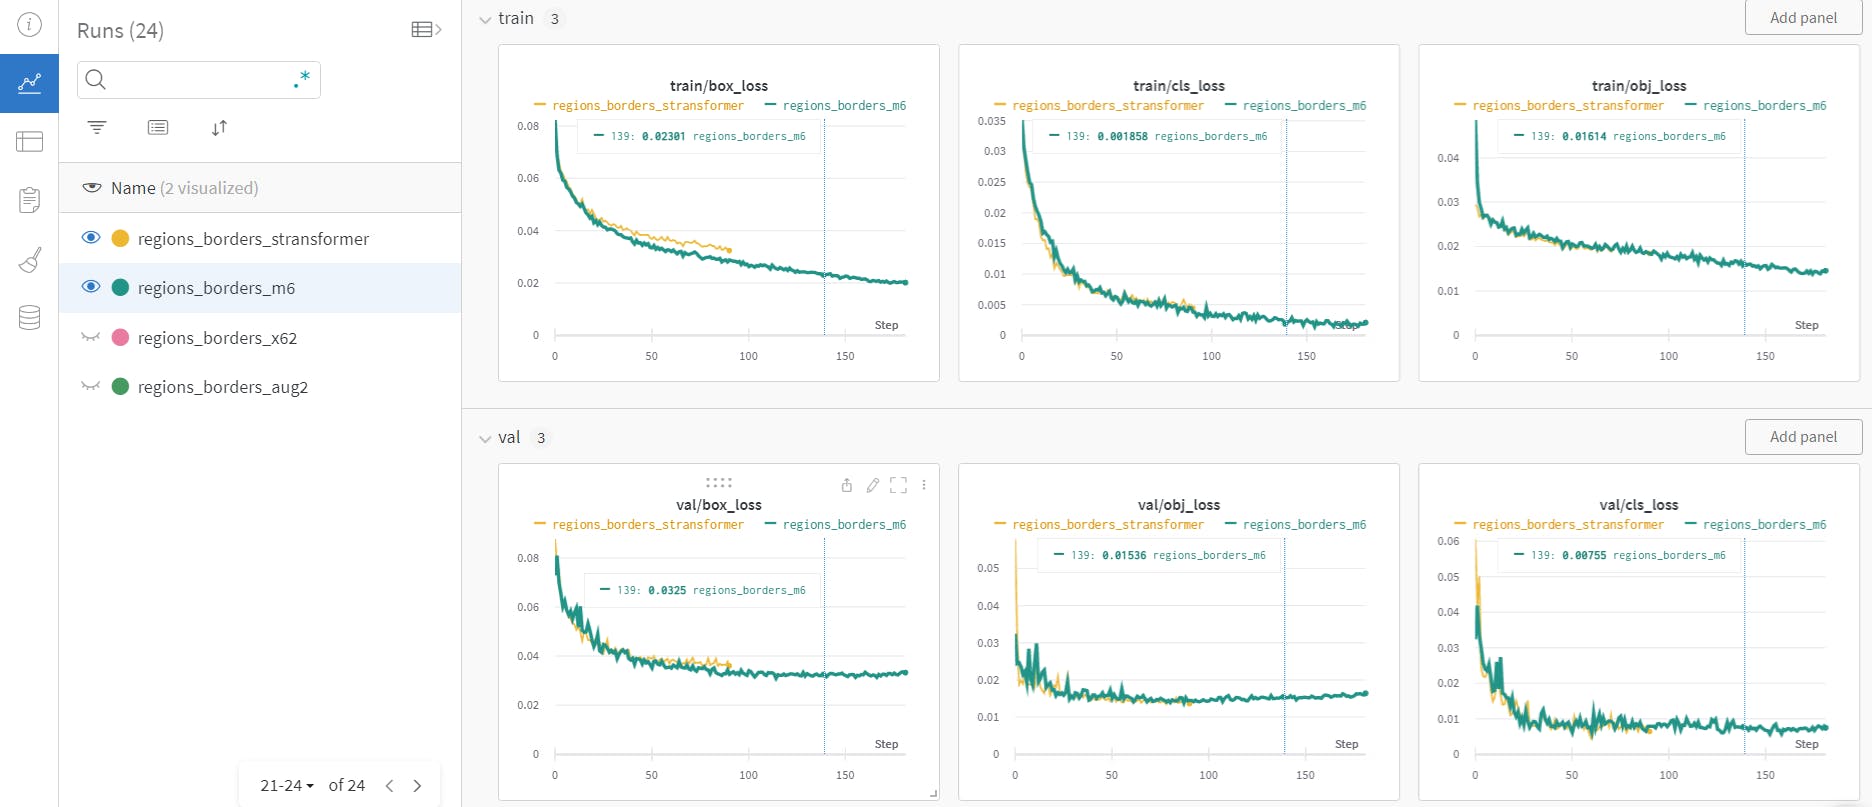
One of the key features of Weights & Biases is the ability to visualize the training process of a machine learning model. The platform provides interactive visualizations of the model's performance over time, including loss, accuracy, and other metrics. These visualizations help to identify trends and patterns in the model's performance, helping to understand the reasons for poor performance or to make improvements to the model.
Another feature of this tool is the ability to analyze the weights and biases of the model. The platform provides detailed information about the model's parameters, including the distribution of weights, the magnitude of biases, and the correlation between parameters. This information helps to understand how the model makes predictions and identifies potential issues or areas for improvement.
Weights & Biases also provides an interactive interface for comparing models and tracking experiment results. The platform allows you to compare the performance of different models on various metrics, such as accuracy, precision, and recall. This makes it easier to compare the results of different models and choose the best model.
In addition to the visualization and analysis features, Weights & Biases provides collaboration and sharing features. The platform allows you to share your results with others, making collaborating with other researchers and engineers easier. This is especially useful for teams working on large, complex machine-learning projects.
With Weight & Biases, you can upload your TensorBoard logs to the cloud and save all your analysis in one location. The metrics tracked by TensorBoard will be logged in native Weights & Biases charts.
To use Weights & Biases, you need to integrate it into your machine learning workflow. The platform provides an API that allows you to log information about your model. Once the information has been logged, it is available in the Weights & Biases dashboard, where you can view and analyze the results.
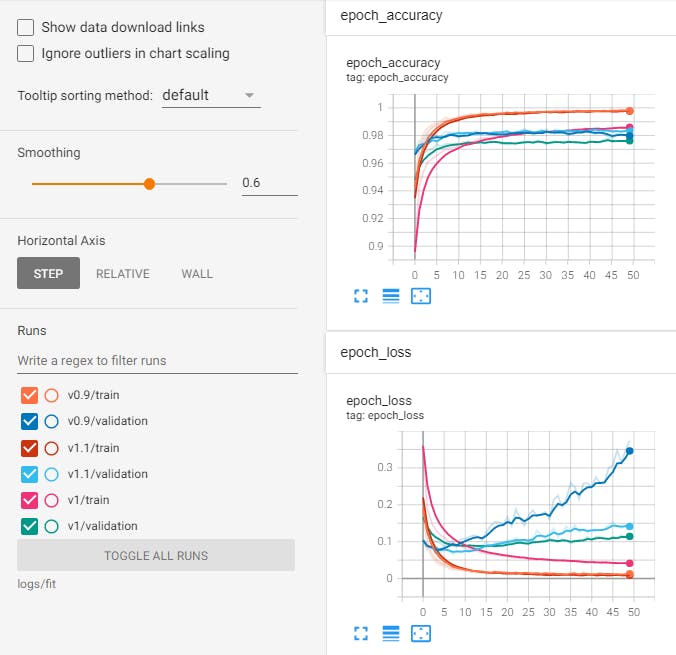
Using TensorBoard to debug a computer vision model
TensorBoard is a web-based tool that allows you to visualize and analyze the performance of machine learning models. To start using TensorBoard functions, you need to perform two steps: log data for TensorBoard and then start TensorBoard.
TensorBoard needs data in a specific format to display it. To log data for TensorBoard, you can use the SummaryWriter class in PyTorch or TensorFlow frameworks.
This allows you to write scalar, image, histogram, and other data types to a file that TensorBoard can display. After logging the data, start TensorBoard by running the tensorboard command in the terminal or command prompt. This will launch a web server you can access in your web browser to view the data.
TensorBoard provides many debugging features, such as:
- view the model's architecture
- track the model's training history
- view histograms and distributions of the model's weights
- compare experiment results
TensorBoard allows you to view the model's architecture, which can help you identify potential issues with the model. You can see the model's graph and the connections between its layers.
With TensorBoard, you can view the model's performance over time, which can help you identify patterns and trends. This can be especially useful if you're training the model for a long time, as it can be difficult to keep track of the model's performance otherwise.
TensorBoard can view the histograms and distributions of the model's weights, which can help you identify issues with the model's weights. For example, if the weights are all the same, this could indicate that the model is not learning from the training data.
With TensorBoard, you can visually assess the performance of different experimental outcomes by displaying them side-by-side. This feature is especially valuable when experimenting with varying model structures or hyperparameter values, as it enables you to identify the most optimal configuration.
By using TensorBoard to debug your computer vision model, you can better understand the model's performance and identify any issues with the model. Remember, debugging models can be an iterative process, so it may take several rounds of experimentation and analysis to get the model to perform optimally.
What do I do once I’ve debugged my computer vision model?
Once a computer vision model has been successfully debugged and its performance has improved, the next step is to deploy the model for production use. Deployment involves integrating the model into a larger system, such as a mobile app or a web service, and conducting additional testing to ensure that the model functions as intended in a real-world setting.
It is crucial to continuously monitor the performance of the deployed model and make updates as needed to maintain its accuracy and performance over time. This can involve adjusting the model's hyperparameters, retraining the model with new data, or fine-tuning the model to address specific issues that may arise.
Additionally, it is recommended to keep a record of the debugging process and any changes made to the model, as this information can be valuable for future improvement or debugging efforts. This information can also help other team members understand the reasoning behind changes made to the model, which can be especially important in larger organizations.
Finally, it is essential to consider the overall sustainability and scalability of the model. This may involve designing the model and the deployment system to handle increasing data and planning for future updates and maintenance.
In conclusion, once a computer vision model has been debugged, it is crucial to deploy it for production use. Once in production, you must continuously monitor its performance, keep records of changes and debugging processes, and consider the model's sustainability and scalability. These steps will help ensure that the model continues to perform effectively and remains up-to-date and relevant.
Want to get started with debugging your model in Encord Active?
Want to stay updated?
- Follow us on Twitter and LinkedIn for more content on computer vision, training data, and active learning.
- Join the Slack community to chat and connect.
Frequently asked questions
The operator eye is a key project at Encord that utilizes computer vision to enhance the efficiency of layer picking systems. It employs four cameras to capture detailed performance data, allowing for the identification of operational issues, such as interference from paper sheets, and utilizes learning algorithms to refine future operations for better accuracy and efficiency.
Encord offers comprehensive support for teams engaged in complex computer vision projects, including guidance on best practices for data annotation, model training, and performance evaluation. The platform is designed to cater to the specific needs of teams, helping them navigate challenges and optimize their workflows.
Encord provides robust visualization tools to effectively display various types of ECG signals. This capability is crucial for accurately labeling and annotating data, especially when dealing with different devices that can record ECGs, which may present unique challenges in signal representation.
Encord allows users to visualize camera positions and orientations through specific features like camera helpers and orientation grids. This ensures that users can accurately assess how camera perspectives correspond to the 3D point cloud, enhancing the annotation process.
Yes, Encord includes features for debugging and curation of labeled data. While initial debugging may not be prominent before deployment, the platform provides tools to address potential issues and refine the labeling process as projects grow in complexity and scale.
Encord is designed to accommodate specific project requirements, whether it's general annotations or detailed pixel-level tasks. The platform allows users to set precise guidelines and parameters for annotations, ensuring that the output meets their unique needs.
Yes, Encord provides tools that empower users to analyze and debug their models by pinpointing which types of data are failing and the reasons behind those failures. This capability aids in refining model performance and enhancing user understanding.
Yes, Encord includes features that allow users to debug models and identify edge cases. This capability is essential for improving model accuracy and performance by addressing areas where the model may not perform as expected.
Encord provides comprehensive support throughout the implementation process to ensure a smooth transition and help teams effectively integrate the platform into their workflows.