How To Detect Data Drift on Datasets

Ensuring the accuracy and reliability of machine learning models is crucial in today’s ever-evolving world. However, the data upon which we rely is rarely static and can change in unpredictable ways over time. This phenomenon is known as data drift, and it poses a significant challenge to the effectiveness of models.
In this article, you will learn about the concept of data drift, why models drift, and effective methods for detecting drift.

What is Data Drift?
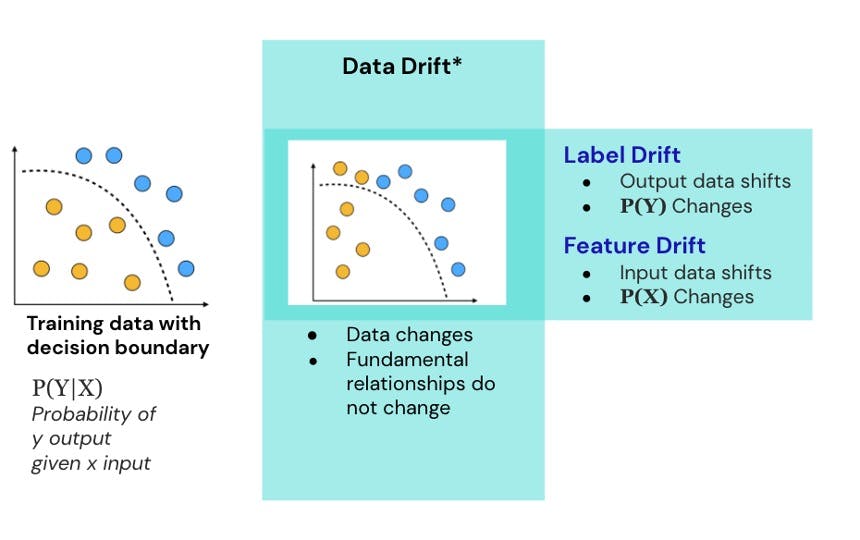
Data drift, also known as covariate shift, occurs when the statistical properties of the input data change over time, resulting in a discrepancy between the distribution of the data used during model training and the distribution of data encountered during model deployment or in real-world scenarios. Put simply, data drift means that the data on which a model was built is no longer representative of the data it is expected to make predictions on.
Data drift can significantly impact the performance and accuracy of machine learning models. When the underlying data distribution changes, the model's assumptions become invalid, leading to suboptimal predictions and potentially inaccurate results. For instance, a model trained to predict customer preferences based on historical data may fail to capture changing trends or external events, resulting in decreased predictive power.
Don’t let your model’s quality drift away
Concept drift occurs when the relationship between input features and the target variable changes over time. As a result, the model's original assumptions are outdated.
To address data drift and concept drift, it is important to continuously monitor the model's performance and update it with new data while employing techniques that are robust to drift. This helps maintain the model's accuracy and adaptability in dynamic data environments. It is crucial for data scientists and practitioners to stay vigilant against concept drift and data drift to ensure their models remain reliable and effective in ever-changing data landscapes.
Why do Models Drift?
Automatic Learning to Detect Concept Drift
Models drift primarily due to changes in the underlying data distribution. There are several factors that can contribute to data drift and ultimately lead to model drift:
Changing User Behavior
As societies, markets, and industries evolve, so do people’s behaviors and preferences. These changes can be caused by cultural shifts, technological advancements, or changing societal norms. For instance, consider an e-commerce website that sells fashion products. As new trends emerge and consumer preferences shift, the data generated by customer interactions will change as well. This can cause a shift in the distribution of purchase patterns, which can potentially affect the model’s effectiveness.
Seasonal Variations
Seasonal trends are common in many industries, with certain periods of the year showing distinct patterns of behavior. For instance, retail sales often surge during the holiday season. If a model is trained using data from a specific season and then deployed in a different season, the data distribution during deployment may differ significantly from what the model learned during training. As a result, the model's predictions may become less accurate.
Instrumentation Change
Changes in data collection methods and tools can cause variations in captured data, leading to shifts in the data distribution. If the model is not updated to account for these changes, it may experience drift.
External Events
External events like economic fluctuations, policy changes, or global crises, can have a big impact on data patterns. For instance, during an economic recession, consumer spending behavior can change drastically. These changes can cause significant data drift, which can affect the model's ability to make accurate predictions.
Data Source Changes
In many real-world scenarios, data is collected from multiple sources, each with its own unique characteristics and biases. As these sources evolve or new ones are added, the overall distribution of the dataset may change, causing data drift.
Data Preprocessing Changes
Data preprocessing is essential in preparing the data for model training. Changes in preprocessing techniques, such as feature scaling, encoding, or data imputation, can change the data distribution and affect the model's performance. If these changes are not taken into account, it can lead to data drift.
Data Quality Issues
It is crucial to have high-quality data for model training and deployment. Poor data quality, such as missing values or outliers, can negatively affect the model's training process. If the quality of new data differs significantly from the training data, it can introduce biases and drift in the model's predictions.
How to Detect Data Drift
Detecting data drift is crucial to maintaining the effectiveness of machine learning models and ensuring the accuracy of data-driven insights. Let's take a look at how the following methods can be used to detect data drift.
Data Quality Monitoring
Data quality monitoring involves tracking the quality and characteristics of the data over time. This can help detect data drift in the following ways:
- Summary Statistics: Monitor summary statistics (mean, variance, median, etc.) of important features in the dataset. If these statistics suddenly or gradually change, it could indicate potential data drift.
- Data Distribution: Track the distribution of features in the dataset. If the shape of the distribution changes significantly, it could be a sign of data drift.
- Outlier Detection: Detect outliers in the data, as the emergence of new outliers can signal a shift in the data distribution.
- Missing Values: Analyze patterns of missing values in the data since data drift may lead to different patterns of missingness.
Model Quality Monitoring
Model quality monitoring involves assessing the behavior and performance of machine learning models over time. This involves several techniques such as:
- Prediction Errors: Monitor prediction errors on a validation or test dataset. If the errors increase, it could indicate data drift.
- Performance Metrics: Keep track of various performance metrics (accuracy, precision, recall, etc.) to detect changes in model performance.
- Confusion Matrix: Analyze the confusion matrix to check. If the patterns of misclassifications have changed, it could indicate data drift.
- Statistical Tests: Use statistical tests to compare model outputs for different time periods. If there are significant differences, it may be due to data drift.
Data Versioning and Data Management
Data versioning and data management are essential for maintaining high-quality datasets and ensuring robust model performance. Data versioning involves tracking different versions of a dataset, allowing you to monitor changes and compare data distributions and patterns over time. This helps in identifying potential data drift, ensuring that your models remain accurate and reliable. Effective data management, on the other hand, encompasses organizing, curating, and monitoring your datasets.
Feedback Loops
Feedback loops are essential to detecting data drift in machine learning models. These loops involve collecting new data and using it to evaluate the model's performance and identify potential drift issues. By continuously incorporating, feedback loops help data scientists stay vigilant against data drift and ensure the model's accuracy and reliability in evolving data environments.
Feedback loops can help detect data drift in the following ways:
- Active Learning: New insights gained from the feedback loop can be used to implement active learning strategies. This allows the model to learn from the new data and update its knowledge to handle data drift effectively.
- Real-Time Monitoring: Feedback loops enable the collection of new data in real-time or at regular intervals. This fresh data can be compared to the existing dataset to detect any changes in data distribution.
- Human-in-the-loop: Use human feedback to validate model predictions and identify potential data drift issues.
Data Drift Detection Methods
KS test (Kolmogorov-Smirnov Test)
The KS test is a statistical test commonly used to compare the distributions of two datasets. It measures the maximum difference between the cumulative distribution functions (CDFs) of the two datasets being compared. The test determines whether the two datasets come from the same underlying distribution. If the datasets are from the same distribution, the KS test yields a small p-value. If the p-value is significant, it indicates that the two datasets have different distributions, indicating potential data drift.
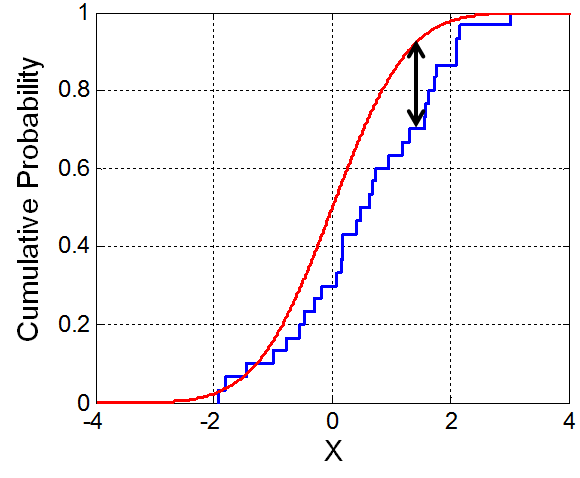
Illustration of the Kolmogorov–Smirnov statistic. The red line is a model (Cumulative Distribution Function), the blue line is an empirical CDF, and the black arrow is the KS statistic.
The KS test can be used to compare the distribution of key features in the training dataset with the new data collected for model validation or deployment. If the KS test detects a significant difference in the distributions, it means that the model may encounter data it was not trained on, and highlight the presence of data drift.
Population Stability Index (PSI)
The Population Stability Index (PSI) is a technique used widely in business applications to detect data drift. It measures the difference between the expected distribution, often based on historical data and the actual distribution of a dataset. PSI is usually calculated by dividing the data into bins or segments and comparing the frequency or density distribution of features between two datasets.
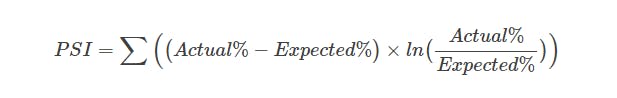
A high PSI value suggests that there has been a significant change in the distribution of a feature between two datasets. This might indicate data drift, which would prompt data scientists to investigate and take corrective measures, such as retraining the model with the latest data.
Page Hinkley method
The Page-Hinkley method is a sequential monitoring technique used to detect abrupt changes in data distribution. This is done by continuously comparing the observed data with the expected data distribution and accumulating a score based on the differences. If the score exceeds a predefined threshold, it signals potential data drift.
The Page-Hinkley method is particularly useful for quickly responding to data drift.. You can detect and address data drift in real-time by continuously monitoring and comparing data to the baseline, ensuring that the model remains up-to-date with the changing data patterns.
Hypothesis Test
Hypothesis testing is a versatile method that can help identify data drift. To begin, you formulate a hypothesis about the data (e.g. the mean of a specific feature in the new data is the same as in the training data) and then test it using statistical methods. Statistical tests like t-tests are used to compare the means of the two datasets.
If the test yields a significant difference, it suggests that the hypothesis is invalid and that data drift may be present. Hypothesis testing can also be used to compare various statistical measures between datasets and identify potential shifts in data distributions.
By combining these methods, you can establish a comprehensive data drift detection framework that ensures the long-term accuracy and reliability of machine learning models. Regular monitoring, continuous evaluation, and adaptive strategies are essential components of a proactive approach to tackling data drift effectively.
Detecting Data Drift using Encord
Encord Active is an open-source active learning toolkit that not only enhances model performance but also detects data drift in machine learning models.
Active learning works on the principle of iteratively selecting the most informative or uncertain data points for labeling by a human annotator, allowing the model to actively seek feedback from the annotation instances that are challenging to predict accurately. By combining active learning with data drift detection, the Encord Active toolkit offers an efficient and intelligent means to adapt machine learning models to evolving data distributions.
Encord Index complements Encord Active by providing robust data management capabilities. It streamlines data versioning, quality assurance, and metadata management, ensuring that datasets are well-organized and maintained. Together, Encord Active and Encord Index provide a comprehensive solution for detecting data drift and managing data effectively
Here's how to utilize Encord for data drift detection:
Monitoring Data Distribution
With Encord Index's visualization tool, you can analyze the distribution of incoming data. By comparing the distribution of new data with the original training data, you can detect any shifts or variations in data patterns.
Data Quality Metrics
The data quality metrics can be used to assess new data samples and compare them to the original dataset. If there are any deviations in data quality, such as labeling mistakes or discrepancies, this can indicate data drift.
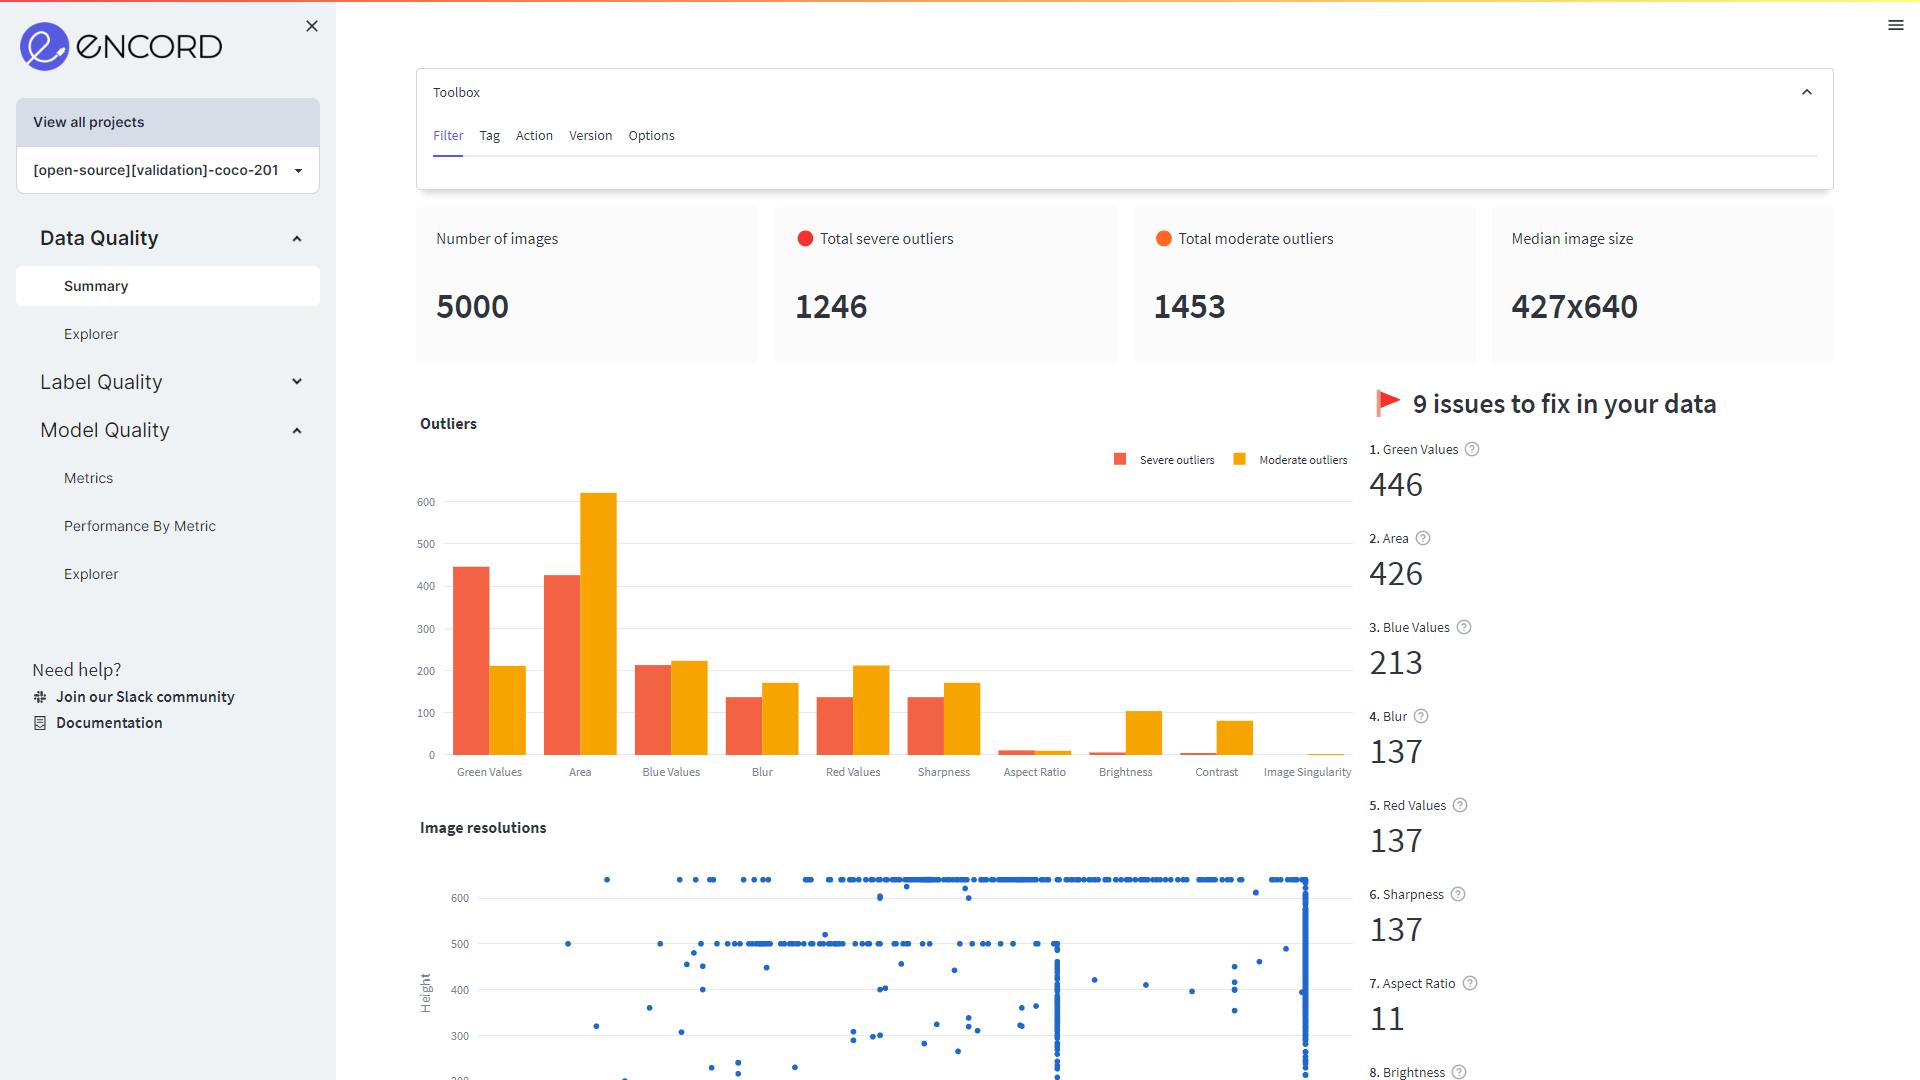
Data Quality page on Encord Active
Model Evaluation
With Encord Active, you can assess your model's performance on new data samples. If there is a decrease in model accuracy or other performance metrics, it might indicate data drift issues.
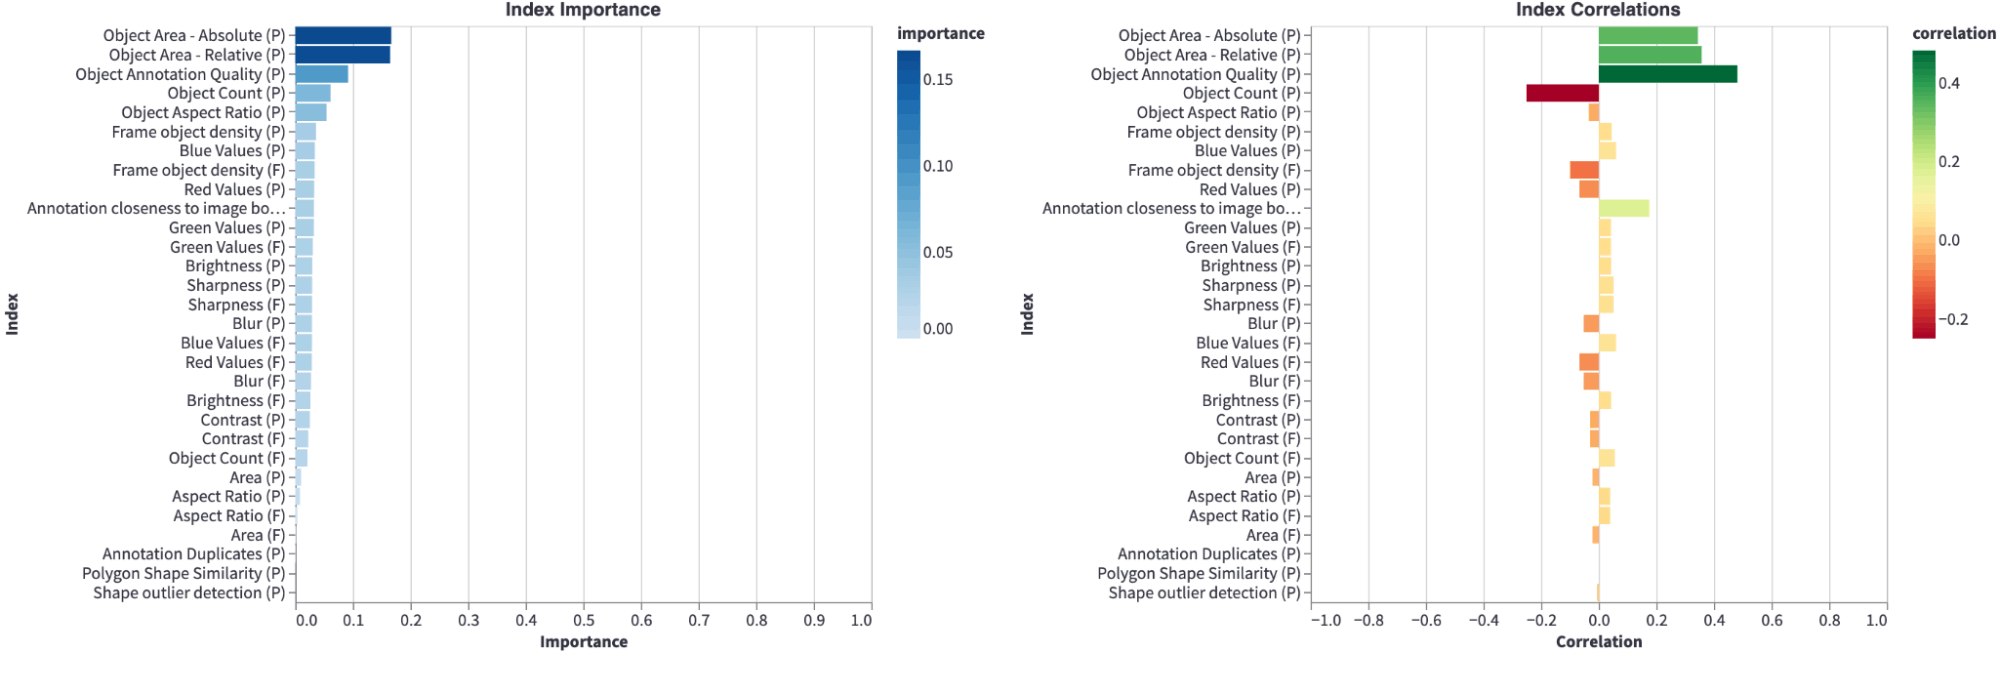
Model Quality metric in Encord Active
Active Learning and Labeling
Encord Active uses active learning techniques to allow you to selectively label and prioritize high-value data samples for re-labeling. This process ensures that the model is regularly updated with relevant data, reducing the impact of data drift.
Data Drift: Key Takeaways
- Data drift occurs when the statistical properties of input data change over time, leading to discrepancies between training and real-world data.
- Data drift can significantly impact model performance and accuracy by invalidating model assumptions.
- Factors that contribute to data drift include changes in user behavior, seasonal variations, changes to the data source, and data quality issues.
- Detecting data drift is crucial for maintaining model effectiveness. Methods include data quality and model performance monitoring, data versioning, and feedback loops.
- Encord Active's features can help detect data drift by analyzing data distribution, using data quality metrics, model evaluation, and active learning techniques.
Frequently asked questions
Encord includes features that allow users to monitor their model's performance and detect drift, ensuring that any changes in data distribution or model accuracy are identified early. This capability helps teams to maintain the reliability of their predictions and make necessary adjustments.
Yes, Encord implements mechanisms within its data pipelines designed to ensure that data undergoes a de-identification process before it is integrated into the platform. This helps mitigate the risk of sensitive information being inadvertently sent outside of secure environments.
Encord ensures data compliance and security by not moving data into its servers. Instead, data can be streamed directly from cloud storage solutions like Google Cloud Platform, allowing companies to maintain control over their data while utilizing Encord’s annotation tools.
Encord's support email not only sends an email to the support team but also creates a ticket in our ticketing system. This ticket is monitored in real-time through our Slack channel, ensuring that someone is always looking at it and addressing your issues promptly.
Yes, Encord supports web hooks that allow developers to receive real-time notifications when annotations are completed. This feature helps teams integrate the annotated data into their own systems efficiently, facilitating timely analysis and database management.
Encord includes features for change detection that enable web agents to monitor website updates and identify patterns of failure. This functionality is essential for maintaining the effectiveness of web agents as they navigate dynamic web environments.
Encord includes monitoring capabilities that help track model drift and data drift over time. Users can analyze loss metrics based on trends in their models, allowing for proactive adjustments and improvements in data quality.