Contents
Using Encord Active to Explore the Quality of Your Images
Use Hugging Face Datasets to Download and Generate the Dataset
Create an Encord Active Project
Exploring the Quality Of Images From the Hugging Face Datasets Library
Inspect the Problematic Images
Next Steps: Fixing Data Quality Issues
Key Takeaways
Encord Blog
Exploring the Quality of Hugging Face Image Datasets with Encord Active
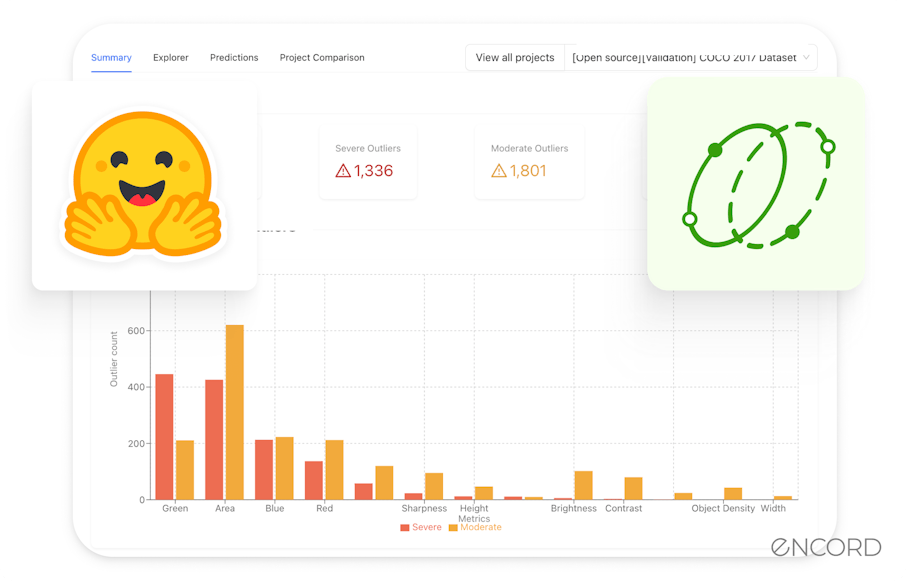
Computer vision engineers, data scientists, and machine learning engineers face a pervasive issue: the prevalence of low-quality images within datasets. You have likely encountered this problem through incorrect labels, varied image resolutions, noise, and other distortions.
Poor data quality can lead to models learning incorrect features, misclassifications, and unreliable or incorrect outputs. In a domain where accuracy and reliability are paramount, this issue can significantly impede the progress and success of projects. This could result in wasted resources and extended project timelines.
Take a look at the following image collage of Chihuahuas or muffins, for example:

Chihuahua or muffin? My search for the best computer vision API
How fast could you tell which images are Chihuahuas vs. muffins? Fast? Slow? Were you correct in 100% of the images? I passed the collage to GPT-4V because, why not? 😂 And as you can see, even the best-in-class foundation model misclassified some muffins as Chihuahuas! (I pointed out a few.)

So, how do you make your models perform better? The sauce lies in the systematic approach of exploring, evaluating, and fixing the quality of images. Enter Encord Active! It provides a platform to identify, tag problematic images, and use features to improve the dataset's quality.
This article will show you how to use Encord Active (now available on Encord Index) to explore images, visualize potential issues, and take the next steps to rectify low-quality images. In particular, you will:
- Use a dog-food dataset from the Hugging Face Datasets library.
- Delve into the steps of creating an Encord Active project.
- Define and run quality metrics on the dataset.
- Visualize the quality metrics.
- Indicate strategies to fix the issues you identified.
Ready? Let’s delve right in! 🚀

Using Encord Active to Explore the Quality of Your Images
Encord Active toolkit helps you find and fix wrong labels through data exploration, model-assisted quality metrics, and one-click labeling integration. It takes a data-centric approach to improving model performance.
With Encord Active, you can:
- Slice your visual data across metrics functions to identify data slices with low performance.
- Flag poor-performing slices and send them for review.
- Export your new data set and labels.
- Visually explore your data through interactive embeddings, precision/recall curves, and other advanced visualizations.
Check out the project on GitHub, and hey, if you like it, leave a 🌟🫡.
Demo: Explore the quality of 'dog' and 'food' images for ML models
In this article, you will use Encord Active to explore the quality of the `sashs/dog-food` images. You’ll access the dataset through the Hugging Face Datasets library. You can use this dataset to build a binary classifier that categorizes images into the "dog" and "food" classes.
The 'dog' class has images of canines that resemble fried chicken and some that resemble images of muffins, and the 'food' class has images of, you guessed it, fried chicken and muffins.
The complete code is hosted on Colab. Open the Colab notebook side-to-side with this blog post.
Use Hugging Face Datasets to Download and Generate the Dataset
Whatever machine learning, deep learning, or AI tasks you are working on, the Hugging Face Datasets library provides easy access to, sharing, and processing datasets, particularly those catering to audio, computer vision, and natural language processing (NLP) domains.
The 🤗 datasets library enables a memory-mapped on-disk cache for quick lookups to back the datasets.
Explore the Hugging Face Hub for the datasets directory
You can browse and explore over 20,000 datasets housed in the library on the Hugging Face Hub. The Hub is a centralized platform for discovering and choosing datasets pertinent to your projects.
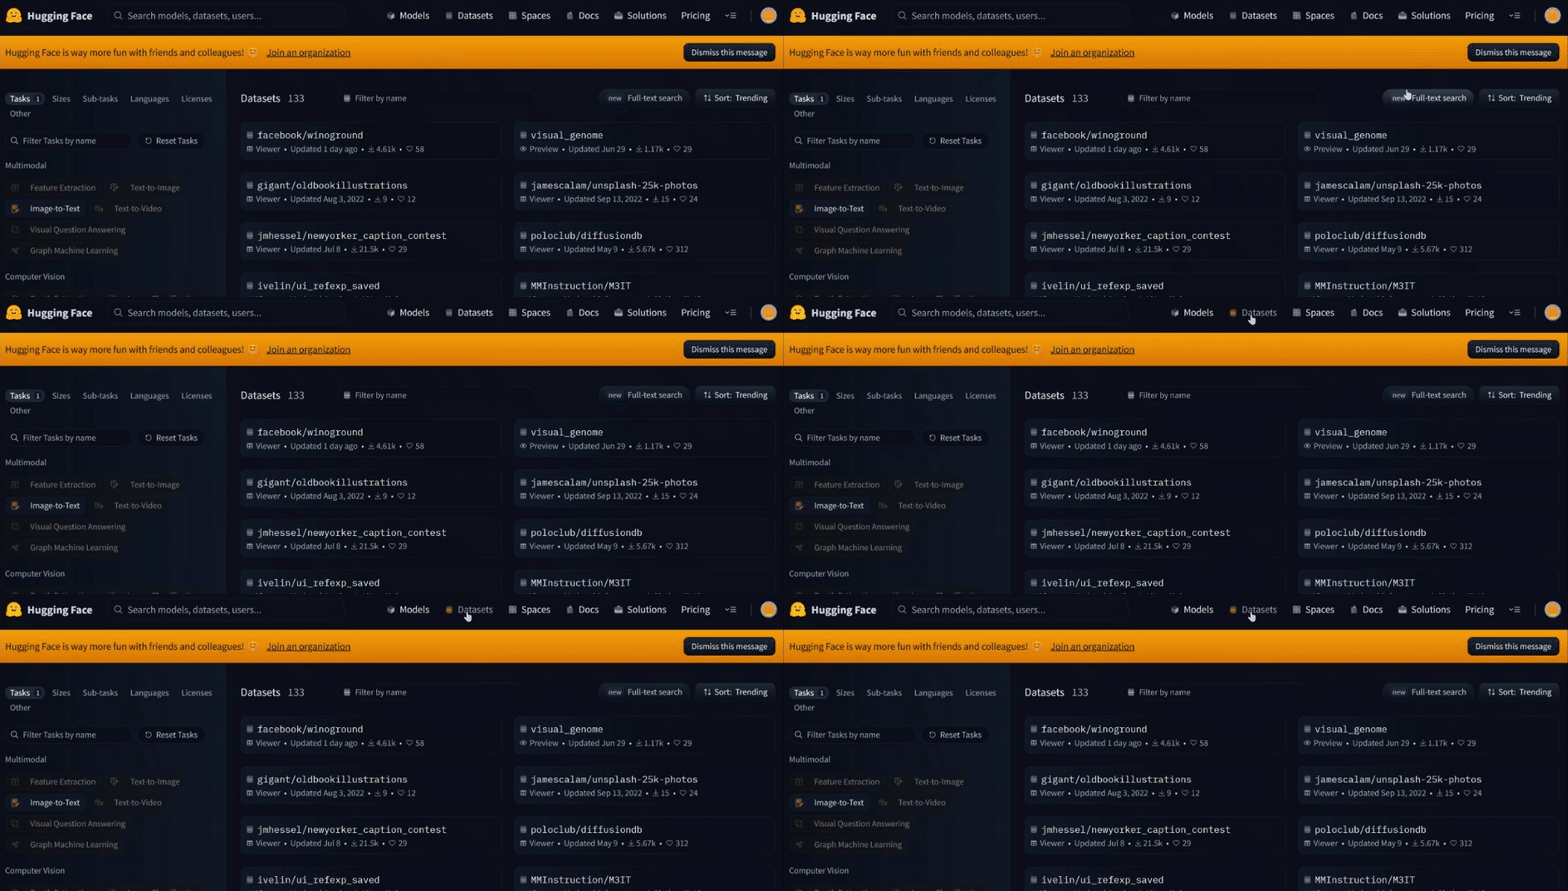
In the search bar at the top, enter keywords related to the dataset you're interested in, e.g., "sentiment analysis," "image classification," etc. You should be able to:
- Filter datasets by domain, license, language, and so on.
- Find information such as the size, download number, and download link on the dataset card.
- Engage with the community by contributing to discussions, providing feedback, or suggesting improvements to the dataset.
Load the ‘sashs/dog-food’ dataset
Loading the `sashs/dog-food` dataset is pretty straightforward: Install the 🤗 Datasets library and download the dataset.
To install Hugging Face Datasets, run the following command:
pip install datasets
Use the `load_dataset` function to load the 'sasha/dog-food' dataset from Hugging Face:
dataset_dict=load_dataset('sasha/dog-food')`load_dataset` returns a dictionary object (`DatasetDict`). You can iterate through the train and test dataset split keys in the `DatasetDict` object.
The keys map to a `Dataset` object containing the images for that particular split.

You will explore the entire dataset rather than in separate splits. This should provide a comprehensive understanding of the data distribution, characteristics, and potential issues. To do that, merge the different splits into a single dataset using the `concatenate_datasets` function:
dataset=concatenate_datasets([dfordindataset_dict.values()])
Perfect! Now, you have an entire dataset to explore with Encord Active in the subsequent sections. If you have not done that already, create a dataset directory to store the downloaded images.
# Create a new directory "hugging_face_dataset" in the current working dir
huggingface_dataset_path =  Path.cwd() / "huggingface_dataset"

# Delete dir if it already exists and recreate

if huggingface_dataset_path.exists():

  shutil.rmtree(huggingface_dataset_path)

huggingface_dataset_path.mkdir()
Use a loop to iterate through images from the ‘sashs/dog-food’ dataset and save them to the directory you created:
for counter, item in tqdm(enumerate(dataset)):
  image = item['image']

image.save(f'./Hugging Face_dataset/{counter}.{image.format}')
If your code throws errors, run the cell in the Colab notebook in the correct order. Super! You have prepared the groundwork for exploring your dataset with Encord Active.
Create an Encord Active Project
You must specify the directory containing your datasets when using Encord Active for exploration. You will initialize a local project with the image files—there are different ways to import and work with projects in Encord.
Encord Active provides functions and utilities to load all your images, compute embeddings, and, based on that, evaluate the embeddings using pre-defined metrics. The metrics will help you search and find images with errors or quality issues.
Before initializing the Encord Active project, define a function, `collect_all_images`, that obtains a list of all the image files from the `huggingface_dataset_path` directory, takes a root folder path as input, and returns a list of `Path` objects representing image files within the root folder:
def collect_all_images(root_folder: Path) ->  list[Path]:
    image_extensions = {".jpg", ".jpeg", ".png", ".bmp"}

    image_paths = []

    for file_path in root_folder.glob("**/*"):

        if file_path.suffix.lower() in image_extensions:

            image_paths.append(file_path)

   return image_paths
Remember to access and run the complete code in this cell.
Initialize Encord Active project
Next, initialize a local project using Encord Active's `init_local_project` function. This function provides the same functionality as running the `init` command in the CLI. If you prefer using the CLI, please refer to the “Quick import data & labels” guide.
try:
    project_path: Path = init_local_project(

        files = image_files,

        target = projects_dir,

        project_name = "sample_ea_project",

        symlinks = False,

    )

except ProjectExistsError as e:

    project_path = Path("./sample_ea_project")

print(e)# A project already exists with that name at the given path.
Compute image embeddings and analyze them with metrics
Analyzing raw image data directly in computer vision can often be impractical due to the high dimensionality of images. A common practice is to compute embeddings for the images to compress the dimensions, then run metrics on these embeddings to glean insights and evaluate the images.
Ideally, you compute the embeddings using pre-trained (convolutional neural network) models. The pre-trained models capture the essential features of the images while reducing the data dimensionality. Once you obtain the embeddings, run similarity, clustering, and classification metrics to analyze different aspects of the dataset. Computing embeddings and running metrics on them can take quite a bit of manual effort. Enter Encord Active!
Encord Active provides utility functions to run predefined subsets of metrics, or you can import your own sets of metrics. It computes the image embeddings and runs the metrics by the type of embeddings. Encord Active has three different types of embeddings:
- Image embeddings - general for each image or frame in the dataset
- Classification embeddings - associated with specific frame-level classifications
- Object embeddings - associated with specific objects, like polygons or bounding boxes
Use the `run_metrics_by_embedding_type` function to execute quality metrics on the images, specifying the embedding type as `IMAGE`:
run_metrics_by_embedding_type(EmbeddingType.IMAGE, data_dir=project_path, use_cache_only=True )
The `use_cache_only=True` parameter cached data only when executing the metrics rather than recomputing values or fetching fresh data. This can be a useful feature for saving computational resources and time, especially when working with large datasets or expensive computations.
Create a `Project` object using the `project_path` - you will use this for further interactions with the project:
ea_project=Project(project_path)
Exploring the Quality Of Images From the Hugging Face Datasets Library
Now that you have set up your project, it’s time to explore the images! There are typically two ways you could visualize images with Encord Active (EA):
- Through the web application (Encord Active UI)
- Combining EA with visualization libraries to display those embeddings based on the metrics
We’ll use the latter in this article. You will import helper functions and modules from Encord Active with visualization libraries (`matplotlib` and `plotly`). This code cell contains a list of the modules and helper functions.
Pre-defined subset of metrics in Encord Active
Next, iterate through the data quality metrics in Encord Active to see the list of available metrics, access the name attribute of each metric object within that iterable, and construct a list of these names:
[metric.nameformetricinavailable_metrics]
You should get a similar output:

There are several quality metrics to explore, so let’s define and use the helper functions to enable you to visualize the embeddings.
Helper functions for displaying images and visualizing the metrics
Define the `plot_top_k_images` function to plot the top k images for a metric:
def plot_top_k_images(metric_name: str, metrics_data_summary: MetricsSeverity, project: Project, k: int, show_description: bool = False, ascending: bool = True):
    metric_df = metrics_data_summary.metrics[metric_name].df
    metric_df.sort_values(by='score', ascending=ascending, inplace=True)

    for _, row in metric_df.head(k).iterrows():
        image = load_or_fill_image(row, project.file_structure)
        plt.imshow(image)
        plt.show()
        print(f"{metric_name} score: {row['score']}")
        if show_description:
          print(f"{row['description']}")
The function sorts the DataFrame of metric scores, iterates through the top `k` images in your dataset, loads each image, and plots it using Matplotlib. It also prints the metric score and, optionally, the description of each image. You will use this function to plot all the images based on the metrics you define.
Next, define a `plot_metric_distribution` function that creates a histogram of the specified metric scores using Plotly:
def plot_metric_distribution(metric_name: str, metric_data_summary: MetricsSeverity):
    fig = px.histogram(metrics_data_summary.metrics[metric_name].df, x="score", nbins=50)

    fig.update_layout(title=f"{metric_name} score distribution", bargap=0.2)
    fig.show()
Run the function to visualize the score distribution based on the “Aspect Ratio” metric:
plot_metric_distribution(“AspectRatio”,metrics_data_summary)

Most images in the dataset have aspect ratios close to 1.5, a normal distribution. The set has only a few extremely small or enormous image proportions.
Use EA’s `create_image_size_distribution_chart` function to plot the size distribution of your images:
image_sizes = get_all_image_sizes(ea_project.file_structure)
fig = create_image_size_distribution_chart(image_sizes)
fig.show()

As you probably expected for an open-source dataset for computer vision applications, there is a dense cluster of points in the lower-left corner of the graph, indicating that many images have smaller resolutions, mostly below 2000 pixels in width and height.
A few points are scattered further to the right, indicating images with a much larger width but not necessarily a proportional increase in height. This could represent panoramic images or images with unique aspect ratios. You’ll identify such images in subsequent sections.
Inspect the Problematic Images
What are the severe and moderate outliers in the image set?
You might also need insights into the distribution and severity of outliers across various imaging attributes. The attributes include metrics such as green values, blue values, area, etc.
Use the `create_outlier_distribution_chart` utility to plot image outliers based on all the available metrics in EA. The outliers are categorized into two levels: "severe outliers" (represented in red “tomato”) and "moderate outliers" (represented in orange):
available_metrics = load_available_metrics(ea_project.file_structure.metrics)
metrics_data_summary = get_metric_summary(available_metrics)
all_metrics_outliers = get_all_metrics_outliers(metrics_data_summary)
fig = create_outlier_distribution_chart(all_metrics_outliers, "tomato", 'orange')

fig.show()
Here’s the result:

"Green Values," "Blue Values," and "Area" appear to be the most susceptible to outliers, while attributes like "Random Values on Images" have the least in the ‘sashs/dog-food’ dataset.
This primarily means there are lots of images that have abnormally high values of green and blue tints. This could be due to the white balance settings in the camera for the images or low-quality sensors.
If your model trains on this set, it’s likely that more balanced images may perturb the performance.
What are the blurry images in the image set?
Depending on your use case, you might discover that blurry images can sometimes deter your model. A model trained on clear images and then tested or used on blurry ones may not perform well.
If the blur could lead to misinterpretations and errors, which can have significant consequences, you might want to explore the blurry images to remove or enhance them.
plot_top_k_images('Blur',metrics_data_summary,ea_project,k=5,ascending=False)Based on a "Blur score" of -9.473 calculated by Encord Active, here is the output with one of the five blurriest images:

What are the darkest images in the image set?
Next, surface images with poor lighting or low visibility. Dark images can indicate issues with the quality. These could result from poor lighting during capture, incorrect exposure settings, or equipment malfunctions.
Also, a model might struggle to recognize patterns in such images, which could reduce accuracy. Identify and correct these images to improve the overall training data quality.
plot_top_k_images('Brightness', metrics_data_summary, ea_project, k=5, ascending=True)The resulting image reflects a low brightness score of 0.164:

What are the duplicate or nearly similar images in the set?
Image singularity in the context of image quality is when images have unique or atypical characteristics compared to most images in a dataset. Duplicate images can highlight potential issues in the data collection or processing pipeline. For instance, they could result from artifacts from a malfunctioning sensor or a flawed image processing step.
In computer vision tasks, duplicate images can disproportionately influence the trained model, especially if the dataset is small. Identify and address these images to improve the robustness of your model.
Use the “Image Singularity” metric to determine the score and the images that are near duplicates:
plot_top_k_images('Image Singularity', metrics_data_summary, ea_project, k=15, show_description=True)Here, you can see two nearly identical images with similar “Image Singularity” scores:

The tiny difference between the singularity scores of the two images—0.01299857 for the left and 0.012998693 for the right—shows how similar they are. Check out other similar or duplicate images by running this code cell.
Awesome! You have played with a few pre-defined quality metrics. See the complete code to run other data quality metrics on the images.
Next Steps: Fixing Data Quality Issues
Identifying problematic images is half the battle. Ideally, the next step would be for you to take action on those insights and fix the issues. Encord Index can help you tag problematic images, which may skew model performance downstream.
Post-identification, various strategies can be employed to rectify these issues. Below, I have listed some ways to fix problematic image issues.
Tagging and Annotation
Once you identify the problematic images, tag them within Encord Index to create a collection.
One of the most common workflows we see from our users at Encord is identifying image quality issues at scale with Encord Index, tagging problematic images, and sending them upstream for annotation with Annotate.

Search, sort, and filter your data until you have the subset of the data you need in Encord Index
Re-labeling
Incorrect labels can significantly hamper model performance. the Index collection facilitates the re-labeling process by exporting the incorrectly labeled images to an annotation platform like Encord Annotate, where you can correct the labels.
Image augmentation and correction
Image augmentation techniques enhance the diversity and size of the dataset to improve model robustness. Consider augmenting the data using techniques like rotation, scaling, cropping, and flipping.
Some images may require corrections like brightness adjustment, noise reduction, or other image processing techniques to meet the desired quality standards.
Image quality is not a one-time task but a continuous process. Regularly monitoring and evaluating your image quality will help maintain a high-quality dataset pivotal for achieving superior model performance.
Active learning
Use active learning techniques to improve the quality of the dataset iteratively.
You can establish a continuous improvement cycle by training the model on good-quality datasets and then evaluating the model on low-quality datasets to suggest datasets to improve.

Key Takeaways
In this article, you defined the objective of training a binary classification model for your use case. Technically, you “gathered” human labels since the open 'sashs/dog-food' dataset was already labeled on Hugging Face. Finally, using Encord Active (now also available in Encord Index), you computed image embeddings and ran metrics on the embeddings.
Inspect the problematic images by exploring the datasets based on objective quality metrics. Identifying and fixing the errors in the dataset will set up your downstream model training and ML application for success.
If you are interested in exploring this topic further, there’s an excellent article from Aliaksei Mikhailiuk that perfectly describes the task of image quality assessment in three stages:
- Define an objective
- Gather the human labels for your dataset
- Train objective quality metrics on the data

Explore the platform
Data infrastructure for multimodal AI
Explore product
Explore our products
Encord offers features that focus not just on the semantic aspects of documents, but also on their aesthetic qualities. This dual focus helps teams ensure that translations maintain both meaning and visual integrity, addressing common challenges faced with existing annotation tools.
Encord implements advanced techniques for biometric verification, including face comparison and liveness checks. The platform analyzes selfies taken by users to ensure they are authentic and not deepfakes, using methods such as passive liveness detection based on a single image.
When deciding on face blurring techniques, users should consider the effectiveness of the approach, any artifacts it may introduce, and the impact on the annotators' ability to accurately assess the images. Training on original images may also be beneficial.
Encord assists in transforming raw images into studio-quality visuals, including 360-degree stitching and promotional video generation. These features ensure that clients receive polished and professional-grade imagery that meets their marketing needs.
