Introduction to Quality Metrics

ML Lead at Encord
What is a Quality Metric?
When you are working with datasets or developing a machine learning model, you often find yourself looking for or hypothesizing about subsets of data, labels, or model predictions with certain properties. Quality metrics form the foundation for finding such data and testing the hypotheses. The core concept is to use quality metrics to index, slice, and analyze the subject in question in a structured way to continuously perform informed actions when cranking the active learning cycle.
Concrete example: You hypothesize that object "redness" influences the mAP score of your object detection model. To test this hypothesis, you define a quality metric that captures the redness of each object in the dataset. From the quality metric, you slice the data to compare your model performance on red vs. not red objects.
 💡 Tip: Find an example notebook for this use-case here.
 Quality Metric Defined
We like to think of a quality metric as:
[A quality metric is] any function that assigns a value to individual data points, labels, or model predictions in a dataset.
By design, quality metrics is a very abstract class of functions because the accompanying methodologies are agnostic to the specific properties that the quality metrics express. No matter the specific quality metric, you can:
- sort your data according to the metric
- slice your data to inspect specific subsets
- find outliers
- compare training data to production data to detect data drifts
- evaluate your model performance as a function of the metric
- define model test-cases
- and much more
all of which are possible with Encord Active.
Tip: Try to read the remainder of this post with the idea of "indexing" your data, labels, and model prediction based on quality metrics in mind. The metrics mentioned below are just the tip of the iceberg in terms of what quality metrics can capture -- only imagination limits the space.
Data Quality Metric
Data quality metrics are those metrics that require only information about the data itself. Within the computer vision domain, this means the raw images or video frames without any labels. This subset of quality metrics is typically used frequently at the beginning of a machine learning project where labels are scarce or perhaps not even existing.
Below are some examples of data quality metrics ranging from simple to more complex:
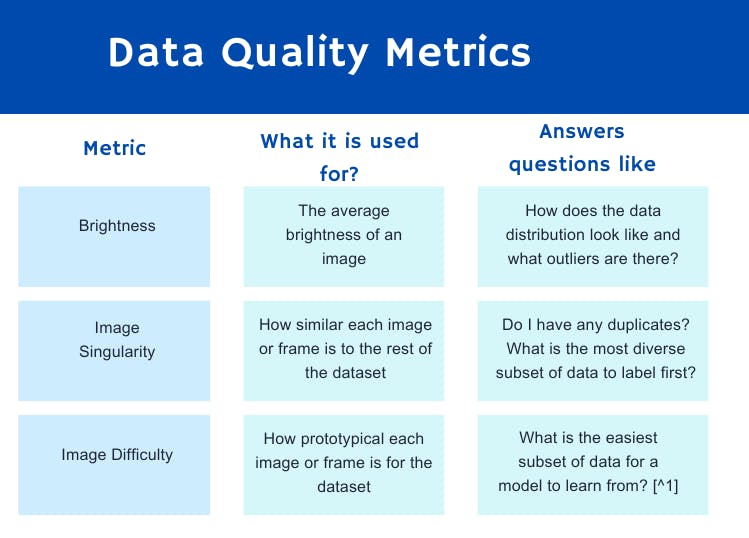
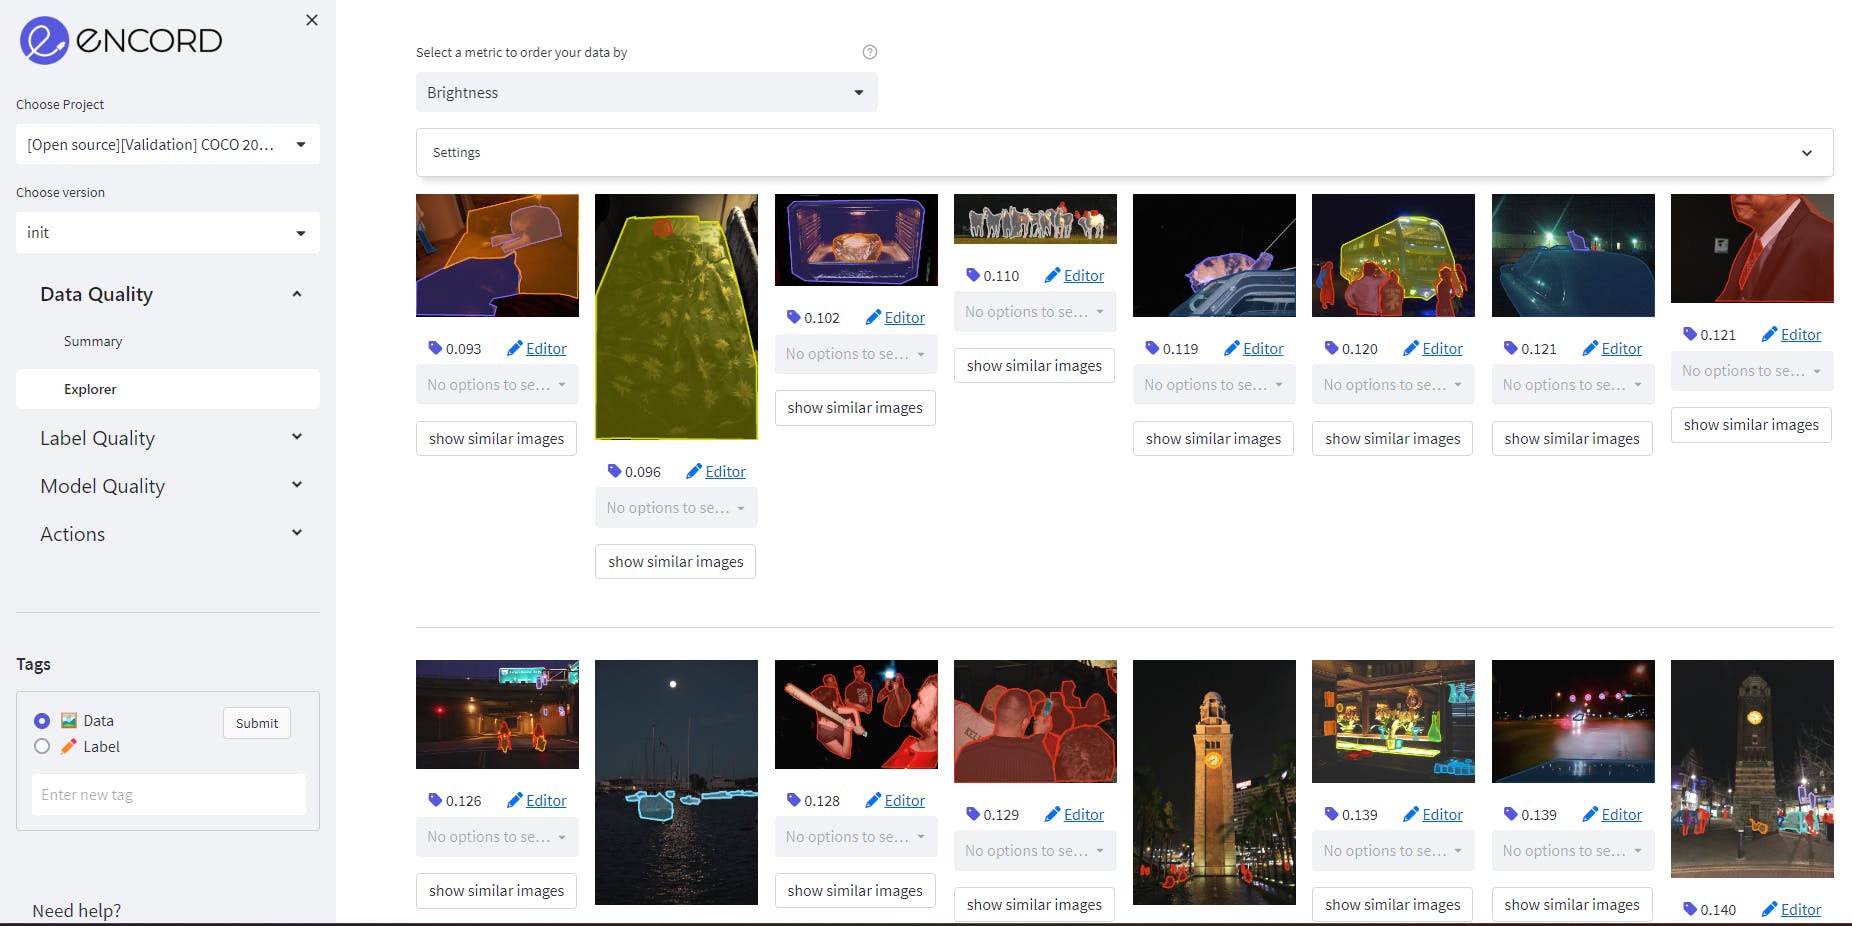
Image Brightness as a data quality metric on MS COCO validation dataset on Encord. Source: Author
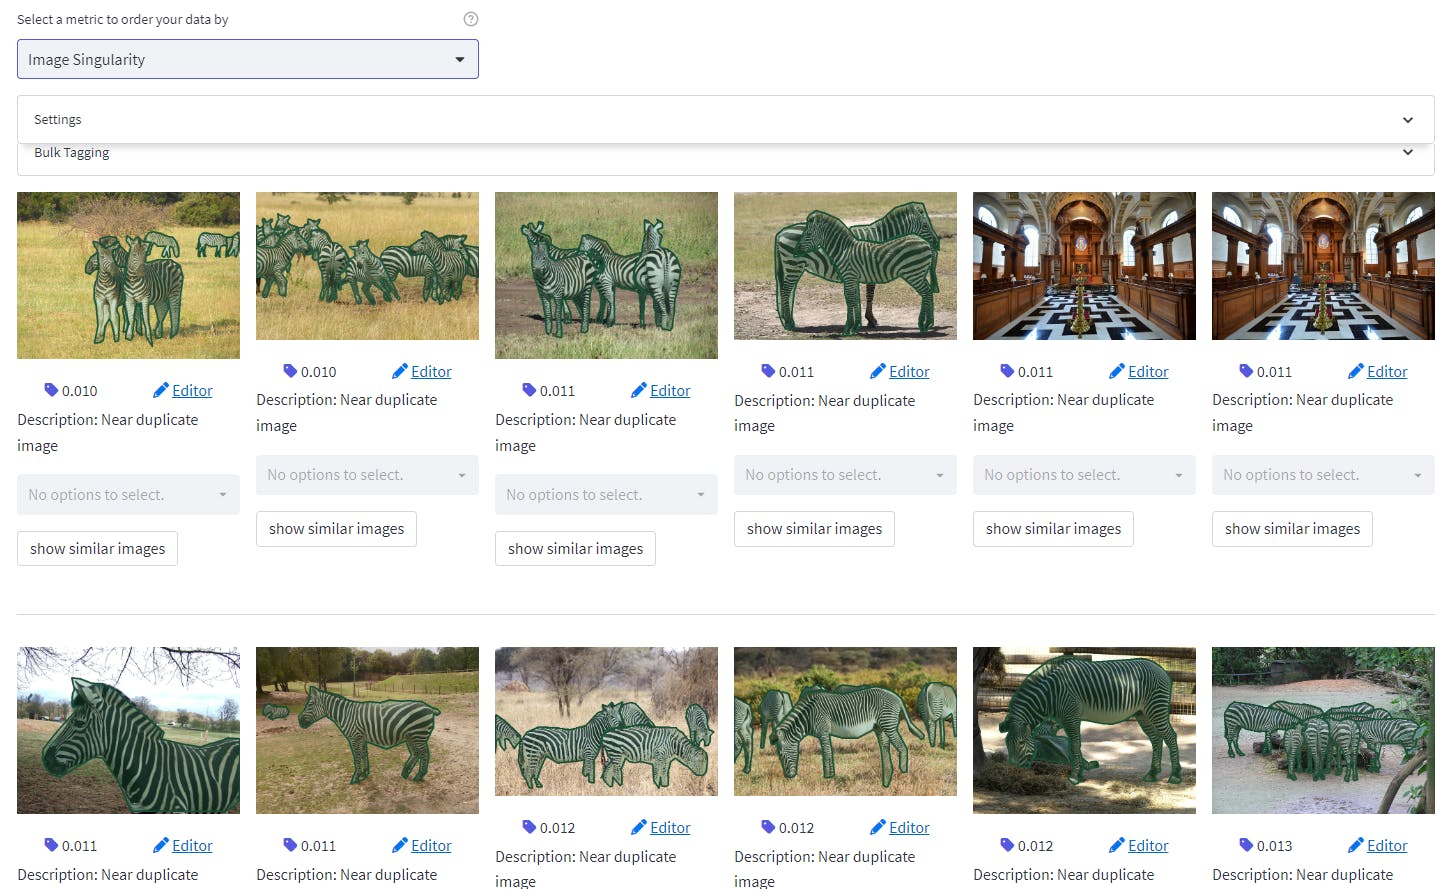
Image Singularity as a data quality metric on MS COCO validation dataset on Encord. Source: Author
💡 Tip: See the list of all pre-built data quality metrics here. Label Quality Metric
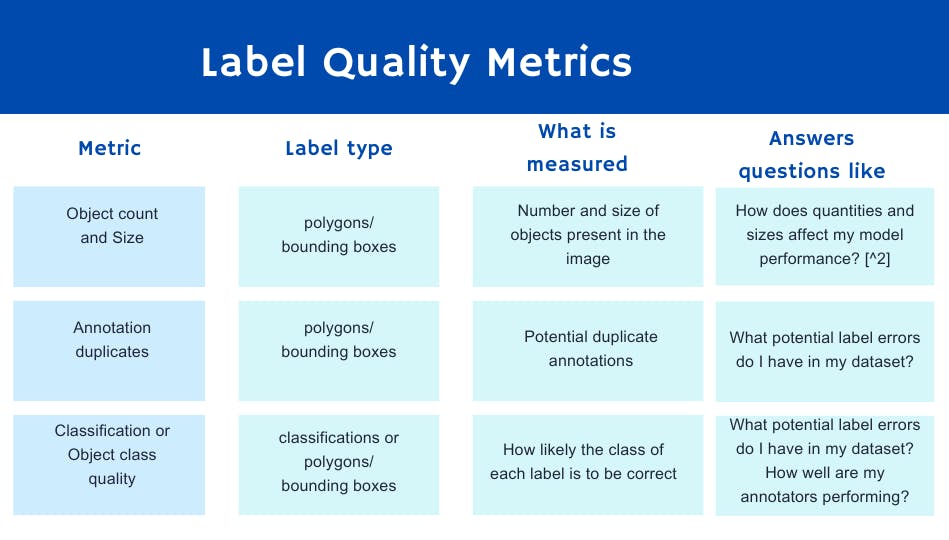
Label quality metrics apply to labels. Some metrics use image content while others apply only to the label information. Label quality metrics serve many purposes but some of the more frequent ones are surfacing label errors, model failure modes, and assessing annotator performance.
Here are some concrete examples of label quality metrics ranging from simple to more complex:
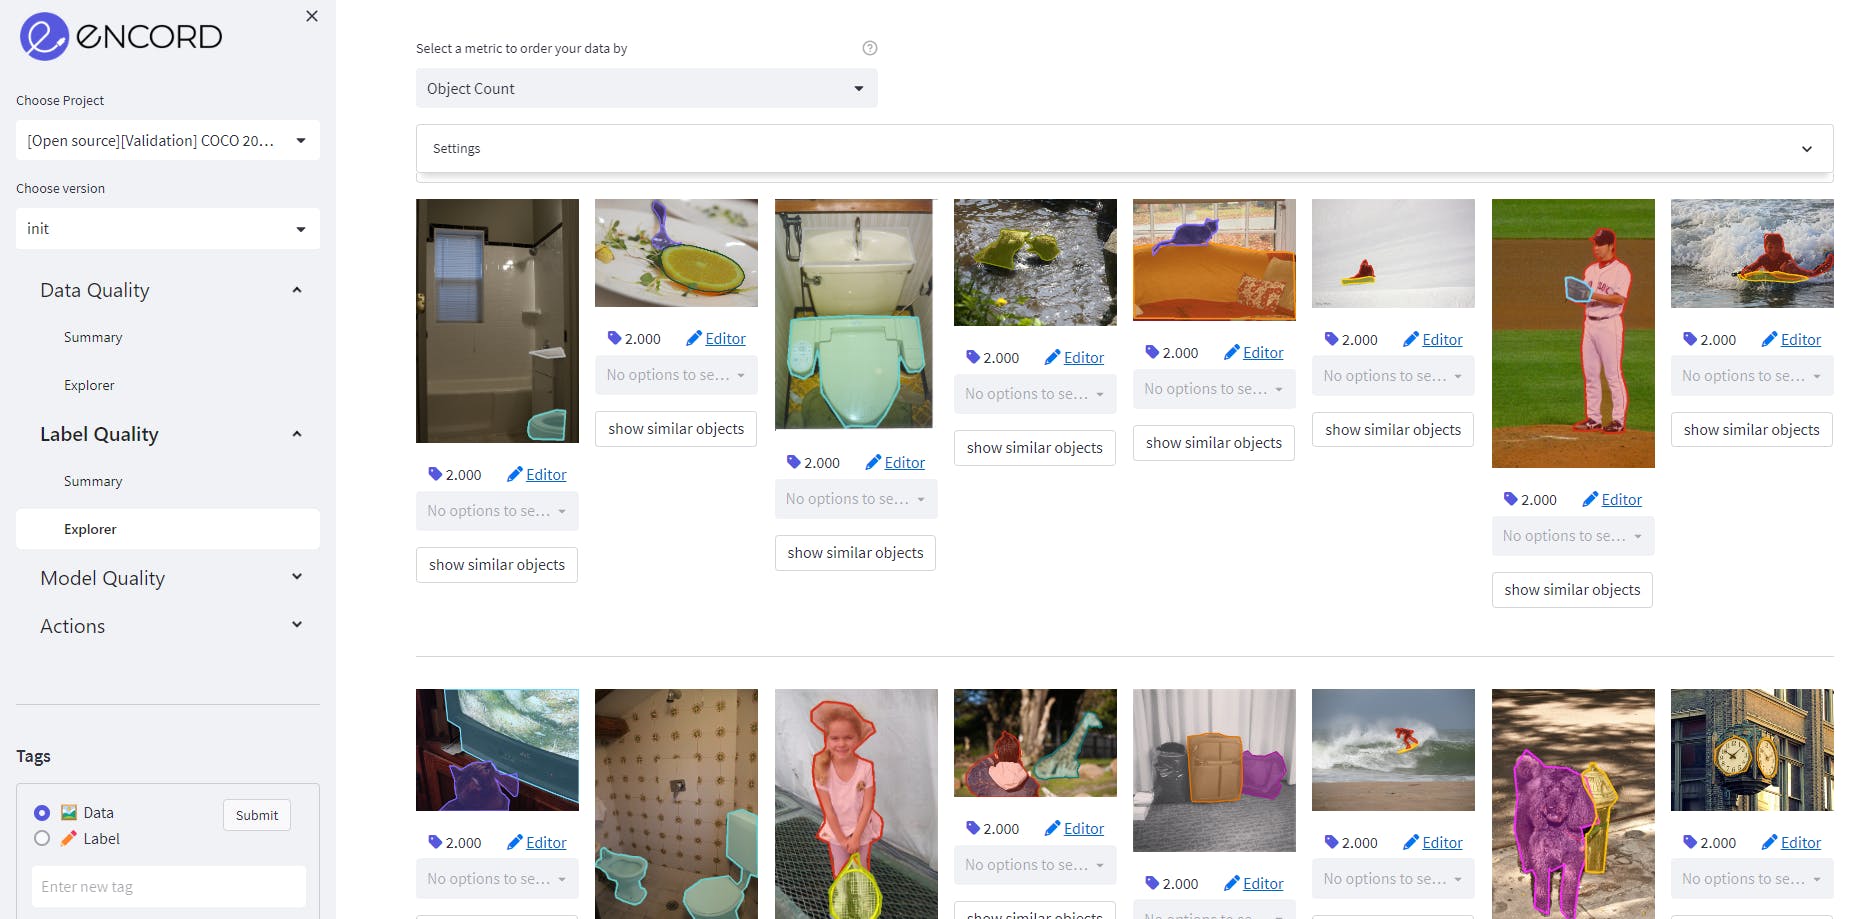
Object count as a label quality metric on MS COCO validation dataset on Encord. Source: Author
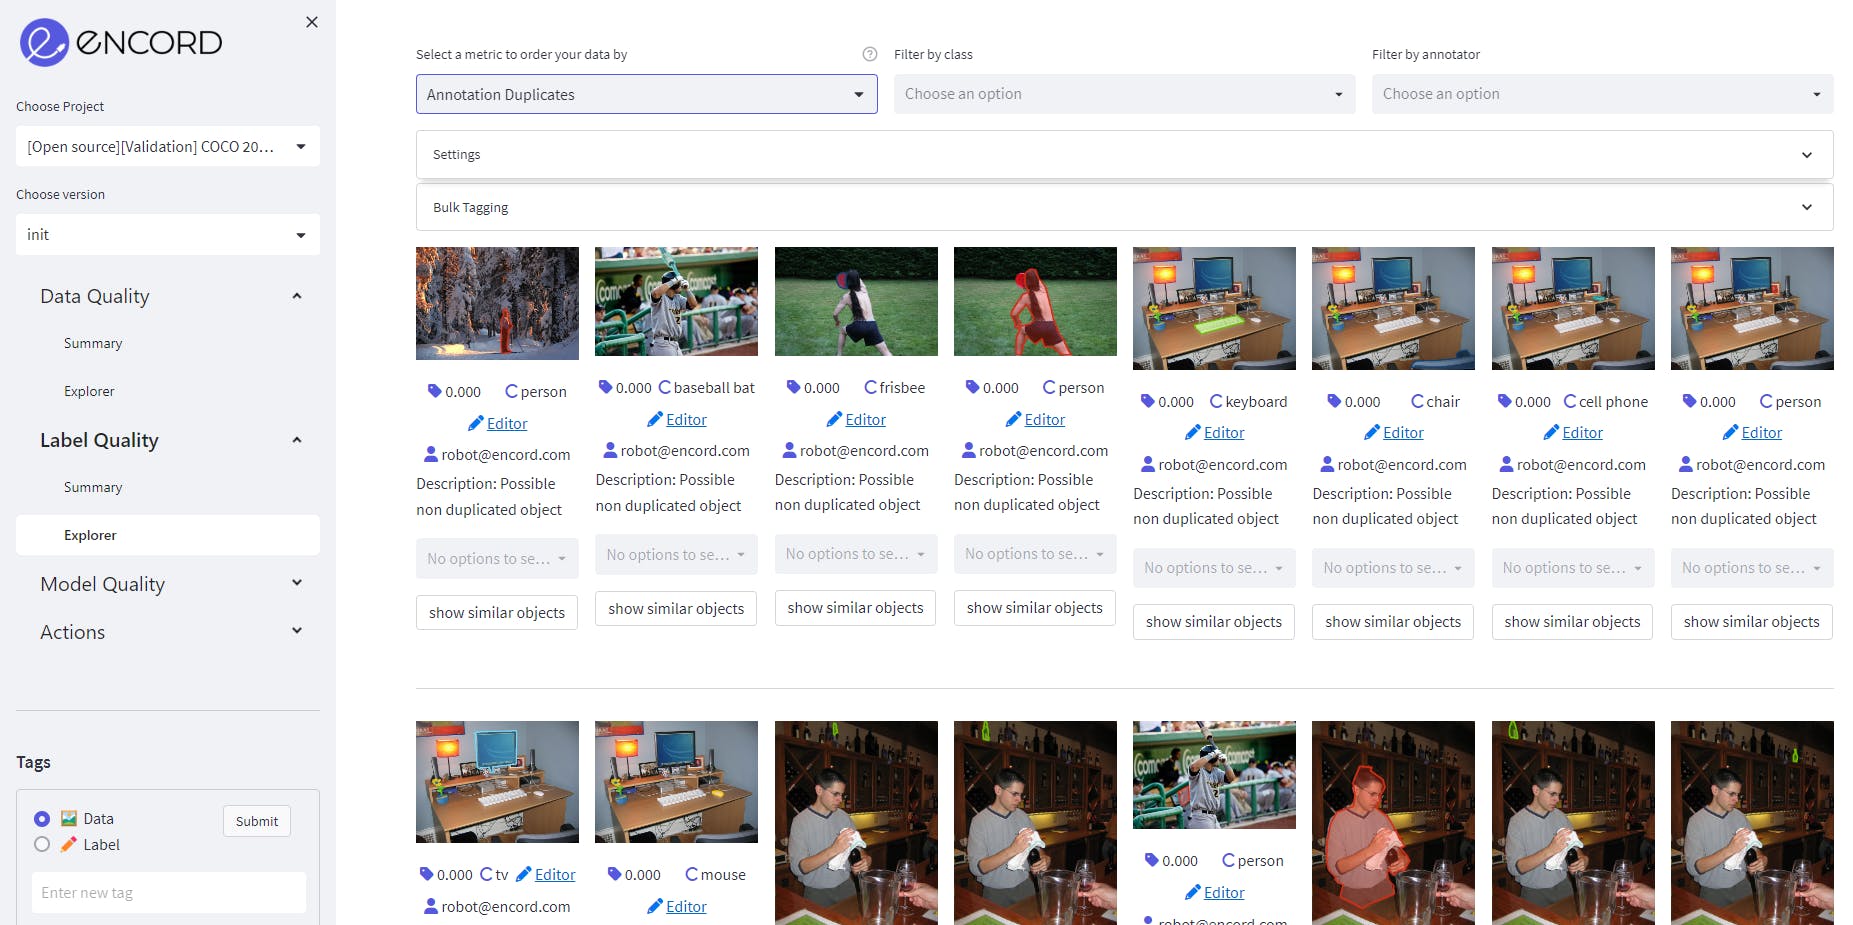
Annotation Duplicate as a label quality metric on MS COCO validation dataset on Encord. Source: Author
💡 Tip: See the list of all pre-built label quality metrics here. Model Quality Metric
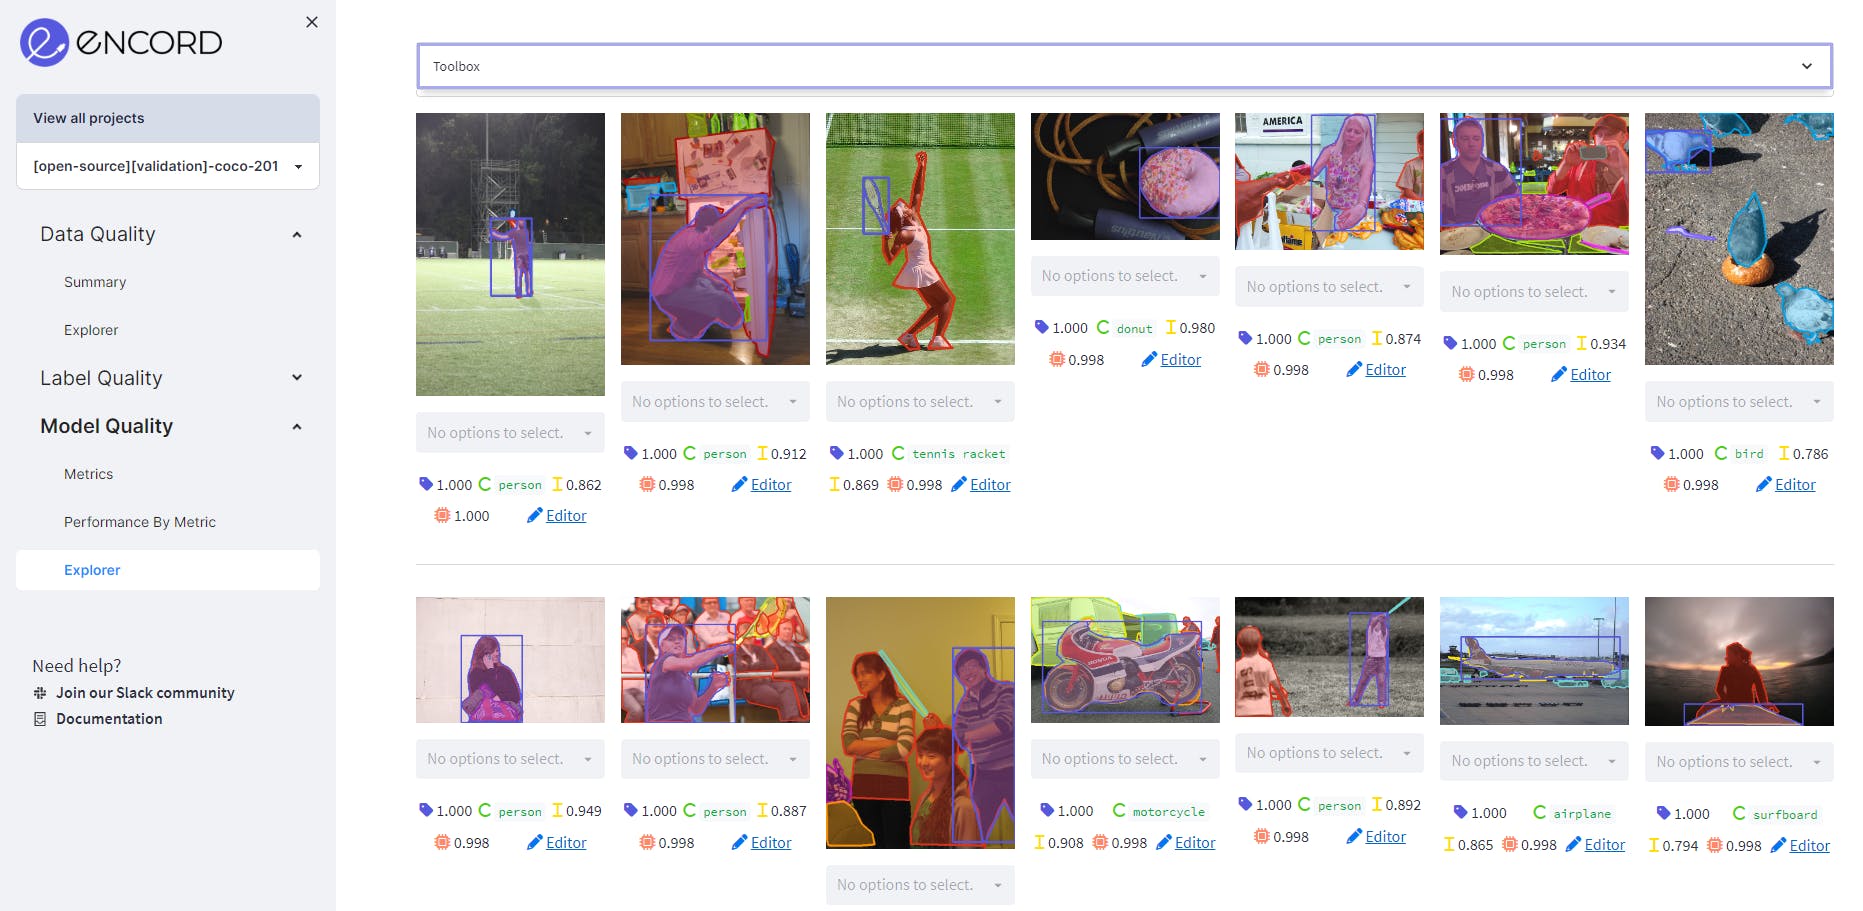
Model quality metrics also take into account the model predictions. The most obvious use-case for these metrics is acquisition functions; answering the question "What should I label next?". There are many intelligent ways to leverage model predictions to answer this question. Here is a list of some of the most common ones:
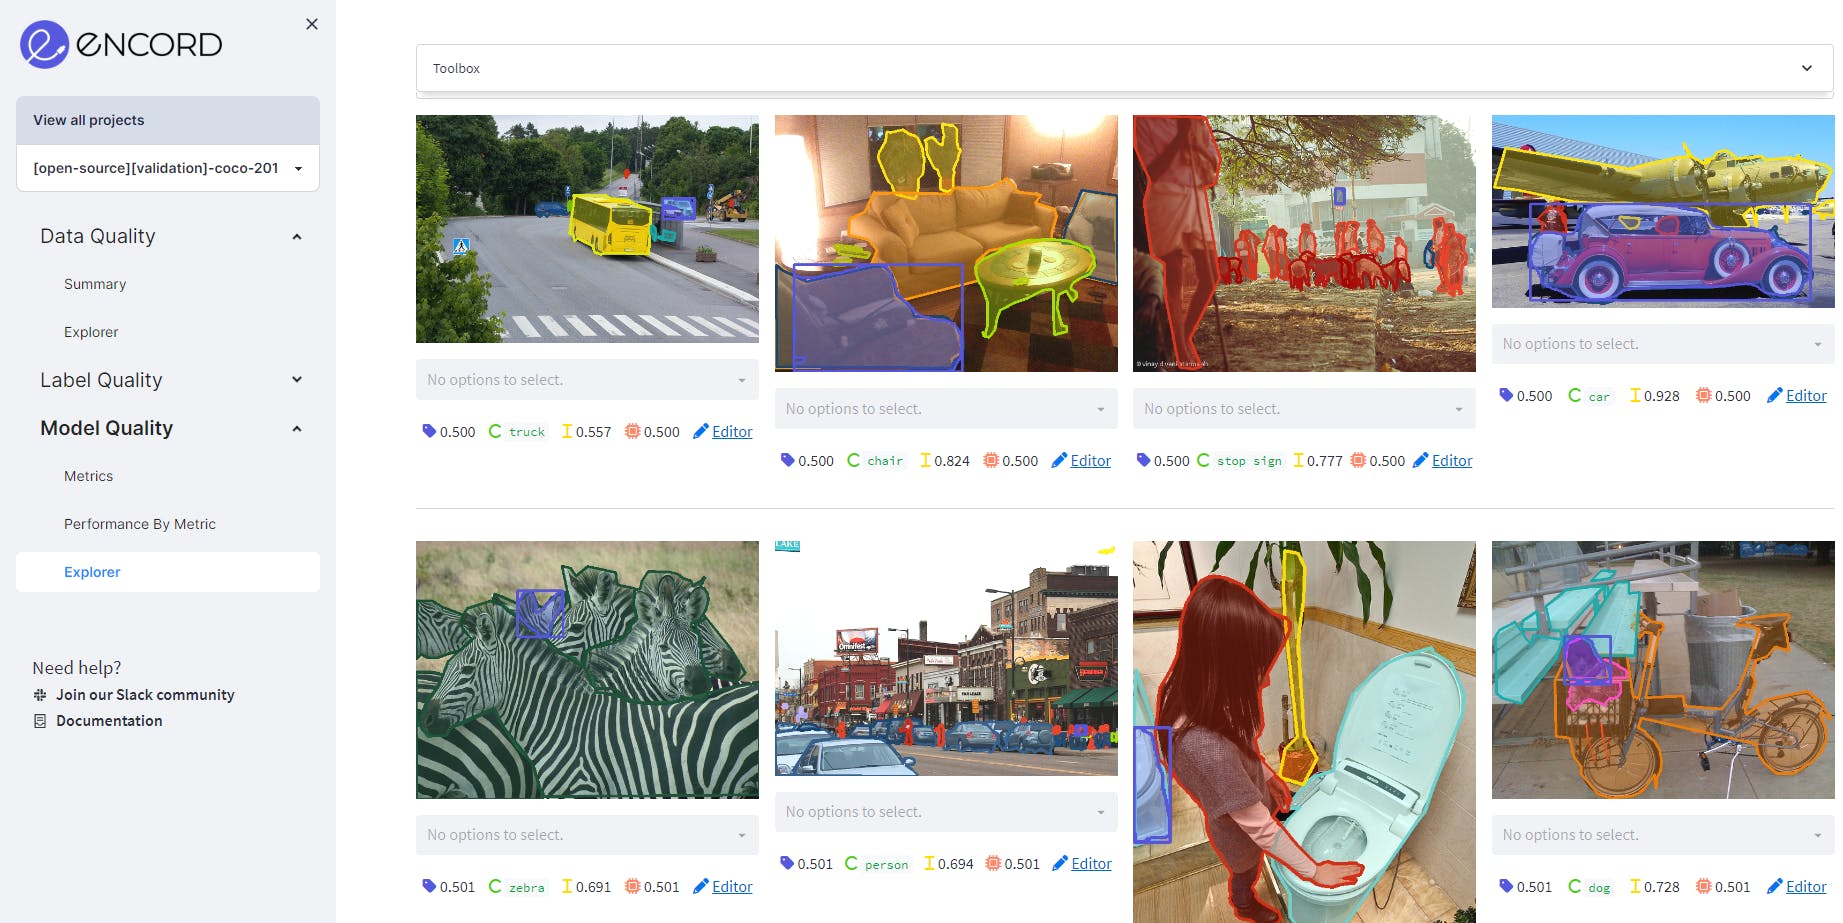
Using Model Confidence as model quality metric on MS COCO validation dataset on Encord. It shows the predictions where the confidence is between 50% to 80%. Source: Author
Using Polygon Shape Similarity as model quality metric on MS COCO validation dataset on Encord. It ranks objects by how similar they are to their instances in previous frames based on Hu moments. The more an object’s shape changes, the lower its score will be.
💡 Tip: To utilize acquisition functions with Encord Active, have a look here. Custom Quality Metrics
We have now gone over some examples of common quality metrics that already exist in Encord Active.
However, every machine learning project is different, and most likely, you have just the idea of what to compute in order to surface the data that you want to evaluate or analyze.
With Encord Active, you only need to define the per-data-point computation and the tool will take care of everything from executing the computation to visualizing your data based on your new metric.
Perhaps, you want to know when your skeleton predictions are occluded or in which frames of video-specific annotations are missing.
You could also get even smarter and compare your labels with results from foundational models like SAM.
These different use-cases are situations in which you would be building your own custom metrics.
You can find the documentation for writing custom metrics here or you can follow any of the links provided above to specific quality metrics and find their implementation on GitHub.
If you need assistance developing your custom metric, the [slack channel][ea-slack] is also always open.
Conclusion
Quality Metrics constitute the foundation of systematically exploring, evaluating and iterating on machine learning datasets and models.
We use them for slicing data, comparing data, tagging data, finding label errors, and much more. The true power of these metrics is that they can be arbitrarily specific to a problem at hand. With Encord Active, it is super easy to define, execute, and utilize quality metrics to get the most out of your data, your models, and your annotators.
Footnotes
- [^1]: The difficulty metric is inspired by this paper.
- [^2]: With COCO, model performance is already evaluated against multiple different subsets of labels. For example, scores like $AP^{\text{small}}$ and $AR^{\text{max=10}}$ from COCO can be expressed as label quality metrics and evaluated with Encord Active.
Frequently asked questions
Encord prioritizes quality control by establishing clear guidelines and expectations for annotation projects from the outset. Our team focuses on educating clients on the requirements for successful annotation, ensuring that edge cases are identified and that quality is maintained throughout the process.
Encord includes comprehensive quality assurance workflows that encompass review stages, traceability, and inter-annotator agreement metrics, such as Cohen's Kappa. These tools are designed to ensure the reliability and accuracy of annotated data, which is crucial for successful model training.
Encord provides robust quality assurance and validation workflows that help maintain the integrity of annotated data. The platform allows for customizable routing and task assignments, ensuring that each piece of data is reviewed and validated according to your project's specific needs.
Encord allows users to evaluate their models based on a variety of metrics such as quality, faithfulness to prompts, and overall performance. This feature is crucial for conducting thorough model comparisons and ensuring that the best-performing models are selected for deployment.
Encord focuses on providing visibility into the annotation workflow, allowing users to monitor the speed and quality of annotations. This is vital for managing external annotation workforces and ensuring that the annotations meet the required standards for model training.
Absolutely! Encord provides metrics that allow teams to adopt a data-driven approach to evaluate their performance. This feature is particularly beneficial for internal teams looking to optimize their annotation processes and improve efficiency.
Encord is designed to offer flexible data access, allowing users to export quality scores and relevant metadata easily. This ensures that organizations can transform and utilize the data in a way that meets their specific requirements.
Encord emphasizes quality through a rigorous vetting process for its labeling partners and ongoing quality checks during the annotation process. This commitment ensures that the final outputs meet the highest standards.