Contents
Evaluation Metrics for Object Detection
Importance of Evaluating Object Detection Models
Overview of mAP
How to Calculate Mean Average Precision (mAP)
Practical Applications
How to Calculate mAP
Calculating the Mean Average Precision (mAP)
Challenges and Limitations of mAP
Mean Average Precision (mAP): Key Takeaways
Encord Blog
Mean Average Precision in Object Detection

Object detection is a fascinating field in computer vision. It is tasked with locating and classifying objects within an image or video frame. The challenge lies in the model's ability to identify objects of varying shapes, sizes, and appearances, especially when they are partially occluded or set against cluttered backgrounds.
Deep learning has proven highly effective in object detection. Through training, deep learning models extract features like shape, size, and texture from images to facilitate object detection. They can also learn to classify objects based on the extracted features.
One widely used deep learning model for object detection is YOLO (You Only Look Once). YOLO is a single-shot object detection algorithm, meaning it detects objects in a single pass through the image. This makes YOLO very fast, but it can be less accurate than two-stage object detection algorithms.
Another renowned deep learning model for object detection is SSD (Single Shot MultiBox Detector). SSD is similar to YOLO but uses a distinct approach to detecting objects. SSD partitions the image into a grid of cells, and each cell predicts potential bounding boxes for objects that may be present in the cell. This makes SSD more accurate than YOLO, but it is also slower.
Object detection typically involves two primary components:
- Object Classification: Assigning labels or categories, such as "car", "person", or "cat", to detected objects.
- Object Localization: Identifying the object's position within the image, typically represented by a bounding box. These bounding boxes are described using coordinates (x, y) for the top-left corner, along with their dimensions (width, height).
Evaluation Metrics for Object Detection
Assessing the performance, effectiveness, and limitations of object detection models is pivotal. You can employ several evaluation metrics to assess the accuracy and robustness of these models:
- Mean Average Precision (mAP) averages the precision and recall scores for each object class to determine the overall accuracy of the object detector.
- Intersection over Union (IoU) measures the overlap between the predicted bounding box and the ground-truth bounding box. A score of 1.0 signifies a perfect overlap, whereas a score of 0.0 denotes no overlap between the predicted and the ground truth bounding boxes.
- False Positive Rate (FPR) measures the ratio of incorrect positive predictions to the total number of actual negatives. In simpler terms, it quantifies how often the model mistakenly predicts the presence of an object within a bounding box when there isn't one.
- False Negative Rate (FNR) measures the ratio of missed detections to the total number of actual objects. Essentially, it evaluates how often the model fails to detect an object when it is indeed present in the image.
The choice of evaluation metric must align with the goals and nuances of the specific application. For instance, in traffic monitoring applications, mAP and IoU might be prioritized. Conversely, in medical imaging, where false alarms and missed detections can have serious implications, metrics such as FPR and FNR become highly significant.
Importance of Evaluating Object Detection Models
The evaluation of object detection models is critically important for a myriad of reasons:
- Performance Assessment: Given that object detection models operate in complex real-world scenarios—with factors like diverse lighting conditions, occlusions, and varying object sizes—it's essential to determine how well they cope with such challenges.
- Model Selection and Tuning: Not all object detection models perform well. Evaluating different models helps in selecting the most suitable one for a specific application. By comparing their performance metrics, you can make informed decisions about which model to use and whether any fine-tuning is necessary.
- Benchmarking: Object detection is a rapidly evolving field with new algorithms and architectures being developed regularly.
- Understanding Limitations: Object detection models might perform well on some object classes but struggle with others. Evaluation helps identify which classes are challenging for the model and whether its performance is consistent across different object categories.
- Safety and Reliability: In critical applications such as autonomous driving, surveillance, and medical imaging, the accuracy of object detection directly impacts safety outcomes.
- Quality Control: Faulty object detection in industrial settings can precipitate production mishaps or equipment malfunctions. Periodic evaluation ensures models remain reliable.
- User Confidence: For users and stakeholders to trust object detection systems, you need to consistently validate capabilities.
- Iterative Improvement: Evaluation feedback is crucial for iterative model improvement. Understanding where a model fails or performs poorly provides insights into areas that need further research, feature engineering, or data augmentation.
- Legal and Ethical Considerations: Biased or flawed object detection can sometimes lead to legal and ethical ramifications, underscoring the importance of thorough evaluation.
- Resource Allocation: In resource-limited settings, evaluations guide the efficient distribution of computational resources, ensuring the best model performance.
 New to object detection? Check out this short article on object detection, the models, use cases, and real-world applications.
 Overview of mAP
Mean average precision (mAP) is a metric used to evaluate the performance of object detection models. It is calculated by averaging the precision-recall curves for each object class. Precision quantifies the fraction of true positives out of all detected objects, while recall measures the fraction of true positives out of all actual objects in the image.
The AUC is a measure of the model's overall performance for that class, and it considers both precision and recall. By averaging these areas across all classes, we obtain mAP. The AUC score can be used to calculate the area under the precision-recall curve to get one number that describes model performance.
mAP is a popular metric for evaluating object detection models because it is easy to understand and interpret. It is also relatively insensitive to the number of objects in the image. A high mAP score indicates that the model can detect objects with both high precision and recall, which is critical in applications like autonomous driving where reliable object detection is pivotal to avoiding collisions.
A perfect mAP score of 1.0 suggests that the model has achieved flawless detection across all classes and recall thresholds. Conversely, a lower mAP score signifies potential areas of improvement in the model's precision and/or recall.
How to Calculate Mean Average Precision (mAP)
1. Generate the prediction scores using the model.
2. Convert the prediction scores to class labels.
3. Calculate the confusion matrix.
4. Calculate the precision and recall metrics.
5. Calculate the area under the precision-recall curve (AUC) for each class.
6. Average the AUCs to get the mAP score.
Practical Applications
mAP is a widely used metric for evaluating object detection models in a variety of applications, such as:
Self-driving Cars
Self-driving cars are one of the most promising applications of object detection technology. To safely navigate the road, self-driving cars need to be able to detect and track various objects, including pedestrians, cyclists, other vehicles, and traffic signs. mAP is a valuable metric for evaluating the performance of object detection models for self-driving cars because it takes into account both precision and recall.

Precision is the fraction of detected objects that are actually present in the image or video, i.e., correct detections. Recall, on the other hand, measures how many of the actual objects in the image were successfully detected by the model..
High precision indicates fewer false positives, ensuring that the model isn't mistakenly identifying objects that aren't there. Conversely, high recall ensures the model detects most of the real objects in the scene.For self-driving cars, a high mAP is essential for ensuring safety. If the model is not able to detect objects accurately, it could lead to accidents.
Visual Search
Visual search is a type of information retrieval that allows users to find images or videos that contain specific objects or scenes. It is a practical application of mean average precision (mAP) because mAP can be used to evaluate the performance and reliability of visual search algorithms.
In visual search, the primary objective is to retrieve images or videos that are relevant to the user's query. This can be a challenging task, as there may be millions or even billions of images or sequences of videos available. To address this challenge, visual search algorithms use object detection models to identify the objects in the query image or video.
Object detection models play a pivotal role by identifying potential matches, and generating a list of candidate images or videos that seem to contain the queried objects. The mAP metric can be used to evaluate the performance of the object detection models by measuring the accuracy and completeness of the candidate lists.
Medical Image Analysis

mAP is used to evaluate the performance of object detection models in medical image analysis. It is calculated by taking the average of the precision-recall curves for all classes. The higher the mAP, the better the performance of the model.
How to Calculate mAP
The following code shows how to calculate mAP in Python:
import numpy as np import pandas as pd import matplotlib.pyplot as plt import sklearn.metrics
This code above imports essential libraries for our machine learning tasks and data visualization. The imported libraries are used for numerical operations (numpy), data manipulation (pandas), model evaluation (`precision_score` and `recall_score` from `sklearn.metrics`), and creating plots (`matplotlib.pyplot`).
Create two different datasets containing binary data. The code below defines two sets of data for binary classification model evaluations. Each set consists of ground truth labels (`y_true_01`) and predicted scores (`pred_scores_01`).
y_true_01 = ["positive", "negative", "positive", "negative", "positive", "positive", "positive", "negative", "positive", "negative"] pred_scores_01 = [0.7, 0.3, 0.5, 0.6, 0.55, 0.9, 0.75, 0.2, 0.8, 0.3]
`y_true_02` is a list of ground truth labels for a set of instances. In this case, the labels are either "positive" or "negative," representing the two classes in a binary classification problem.
`pred_scores_02` is a list of predicted scores or probabilities assigned by a classification model to the instances in `y_true_01`. These scores represent the model's confidence in its predictions.
y_true_02 = ["negative", "positive", "positive", "negative", "negative", "positive", "positive", "positive", "negative", "positive"] pred_scores_02 = [0.32, 0.9, 0.5, 0.1, 0.25, 0.9, 0.55, 0.3, 0.35, 0.85]
`y_true_02` is another list of ground truth labels for a different set of instances.
`pred_scores_02` is a list of predicted scores or probabilities assigned by a classification model to the instances in `y_true_02`.
Set a threshold value with a range of 0.2 to 0.9 and a 0.05 step. Setting a threshold value with a range of 0.2 to 0.9 and a 0.05 step is a good practice for calculating mean average precision (mAP) because it allows you to see how the model performs at different levels of confidence.
thresholds = np.arange(start=0.2, stop=0.9, step=0.05)
`precision_recall_curve()` function computes precision and recall ratings for various binary classification thresholds. The function accepts as inputs threshold values, projected scores, and ground truth labels (`y_true`, `pred_scores`, and `thresholds`). The thresholds are iterated through, predicted labels are generated, precision and recall scores are calculated, and the
results are then reported.
Finally, lists of recall and precision values are returned.
def precision_recall_curve(y_true, pred_scores, thresholds): precisions = [] recalls = [] for threshold in thresholds: y_pred = ["positive" if score >= threshold else "negative" for score in pred_scores] precision = sklearn.metrics.precision_score(y_true=y_true, y_pred=y_pred, pos_label="positive") recall = sklearn.metrics.recall_score(y_true=y_true, y_pred=y_pred, pos_label="positive") precisions.append(precision) recalls.append(recall) return precisions, recalls
Calculate the average precision scores for the first dataset (`y_true_01`) and plot out the result.
precisions, recalls = precision_recall_curve(y_true=y_true_01, pred_scores=pred_scores_01, thresholds=thresholds) plt.plot(recalls, precisions, linewidth=4, color="red", zorder=0) #Set the label and the title for the precision-recall curve plot plt.xlabel("Recall", fontsize=12, fontweight='bold') plt.ylabel("Precision", fontsize=12, fontweight='bold') plt.title("Precision-Recall Curve", fontsize=15, fontweight="bold") plt.show() # Append values to calculate area under the curve (AUC) precisions.append(1)recalls.append(0) precisions = np.array(precisions) recalls = np.array(recalls) precisions = np.array(precisions) recalls = np.array(recalls) # Calculate the AP avg_precision_class01= np.sum((recalls[:-1] - recalls[1:]) * precisions[:-1]) print('============================================') print('Average precision score:',np.round(avg_precision_class01,2))Output:


The AP score of 0.95 is a good score; it indicates that the model performs relatively well in terms of precision when varying the classification threshold and measuring the trade-off between precision and recall.
Now, let’s calculate the average precision scores for the second dataset (`y_true_02`) and plot out the result.
# Calculate precision and recall values for different threshold precisions, recalls = precision_recall_curve(y_true=y_true_02, pred_scores=pred_scores_02, thresholds=thresholds) # Plot the precision-recall curve plt.plot(recalls, precisions, linewidth=4, color="blue", zorder=0) #Set the label and the title for the precision-recall curve plot plt.xlabel("Recall", fontsize=12, fontweight='bold') plt.ylabel("Precision", fontsize=12, fontweight='bold') plt.title("Precision-Recall Curve", fontsize=15, fontweight="bold") plt.show() # Append values to calculate area under the curve (AUC) precisions.append(1) recalls.append(0) #Convert precision and recall lists to Numpy arrays for computation precisions = np.array(precisions) recalls = np.array(recalls) # Calculate the AP avg_precision_class02 = np.sum((recalls[:-1] - recalls[1:]) * precisions[:-1]) print('============================================') print('Average precision score:',np.round(avg_precision_class02,2))Output:
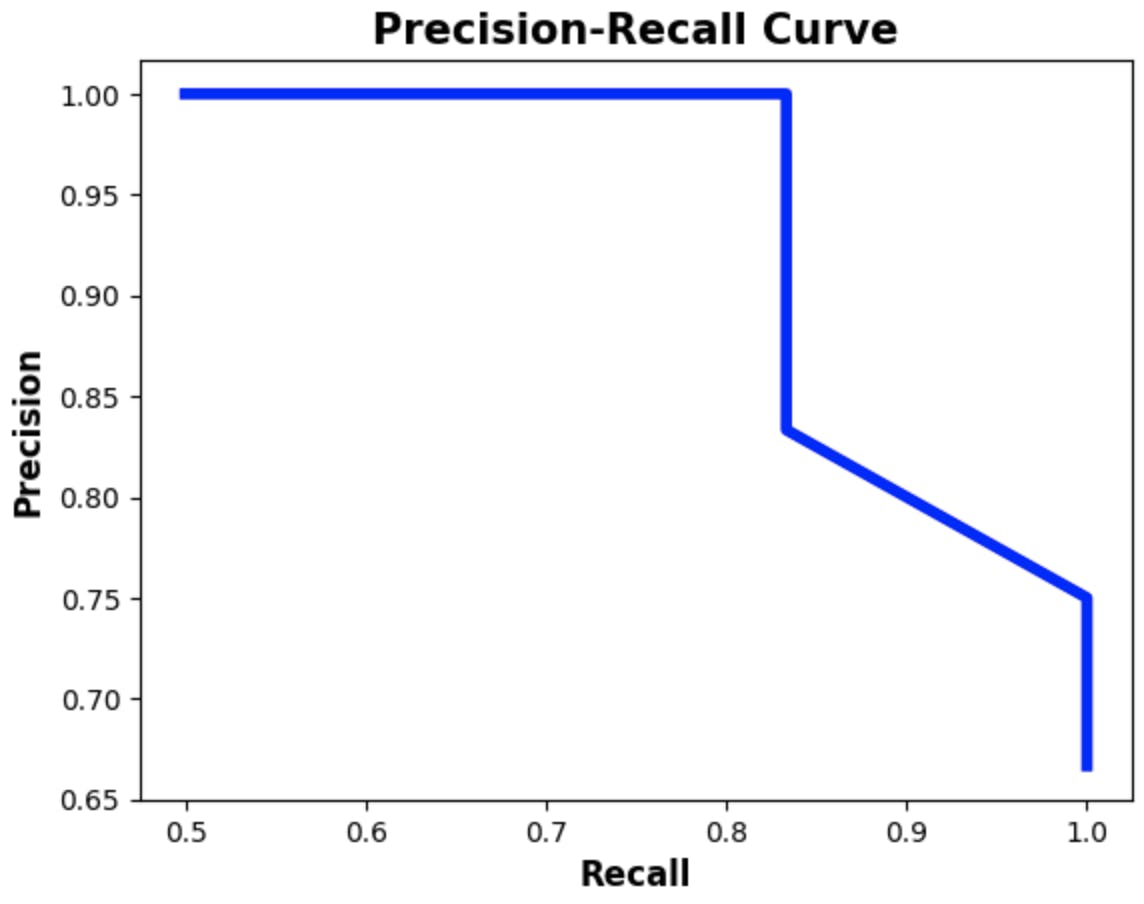

For the second dataset, the AP score was 0.96 which is also a good score. It indicates that the model is able to identify positive samples with high precision and high recall.
Calculating the Mean Average Precision (mAP)
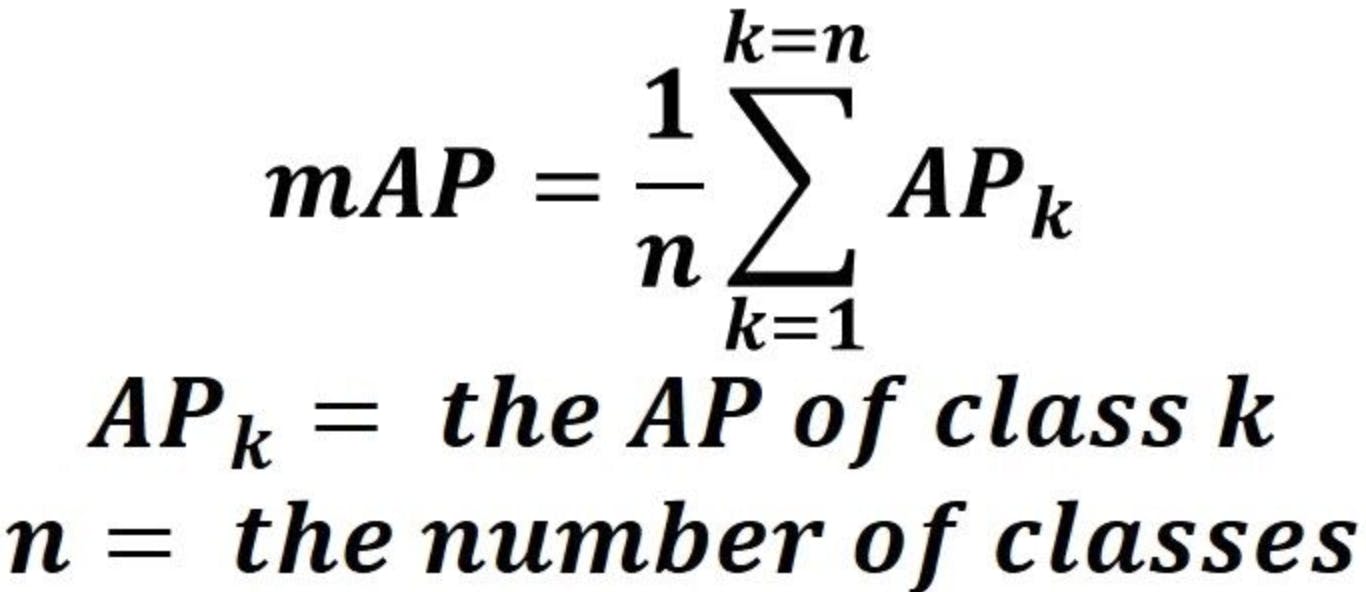
The mean Average Precision or mAP score is calculated by taking the mean AP over all classes and/or overall IoU thresholds, depending on the different detection challenges that exist. The formula for MAP:
# Number of classes or labels (in this case, 2 classes) num_labels = 2 # Calculate the Mean Average Precision (mAP) by averaging the AP scores for both classes mAP = (avg_precision_class2 + avg_precision_class1) / num_labels # Print the Mean Average Precision score print('Mean average Precision score:', np.round(mAP, 3))Output:

- For class 1, you calculated an Average Precision (AP) score of 0.89, which indicates how well your model performs in terms of precision and recall for class 1.
- For class 2, you calculated an Average Precision (AP) score of 0.81, which indicates the performance of your model for class 2.
You calculate the mAP score by averaging these AP scores for all classes. In this specific scenario, you averaged the AP scores for classes 1 and 2.
Challenges and Limitations of mAP
mAP is a widely used metric for evaluating the performance of object detection and instance segmentation algorithms. However, it has its own set of challenges and limitations that should be considered when interpreting its results:
- Sensitivity to IoU Threshold: The mAP calculation is sensitive to the chosen IoU threshold for matching ground truth and predicted boxes. Different applications might require different IoU thresholds, and using a single threshold might not be appropriate for all scenarios.
- Uneven Distribution of Object Sizes: mAP treats all object instances equally, regardless of their sizes. Algorithms might perform well on larger objects but struggle with smaller ones, leading to an imbalance in the evaluation. You can check out this helpful resource.
- Ignoring Object Categories: mAP treats all object categories with the same importance. In real-world applications, some categories might be more critical than others, and this factor isn't reflected in mAP.
- Handling Multiple Object Instances: mAP focuses on evaluating the detection of individual instances of objects. It might not accurately reflect an algorithm's performance when multiple instances of the same object are closely packed together.
- Difficulty in Handling Overlapping Objects: When objects overlap significantly, it can be challenging to determine whether the predicted bounding boxes match the ground truth. This situation can lead to inaccuracies in mAP calculations.
- Doesn't Account for Execution Speed: mAP doesn't consider the computational efficiency or execution speed of an algorithm. In real-time applications, the speed of detection might be as crucial as its accuracy.
- Complexity of Calculations: The mAP calculation involves multiple steps, including sorting, precision-recall calculations, and interpolation. These steps can be complex and time-consuming to implement correctly.
Mean Average Precision (mAP): Key Takeaways
- Mean Average Precision (mAP) is an essential metric for evaluating object detection models' performance. Calculated through precision and recall values, mAP provides a comprehensive assessment of detection accuracy, aiding model selection, improvement, and benchmarking.
- mAP is a good metric to use for applications where it is important to both detect objects and avoid false positives.
- A high mAP score is important for ensuring that the model can reliably detect objects.
- It has applications in self-driving cars, visual search, medical image analysis, and lots more.
- Deep learning techniques, exemplified by architectures like YOLO (You Only Look Once), aim to improve object detection performance, potentially leading to higher mAP scores in evaluations and contributing to advancements in various domains.
Throughout this article, we've explored the inner workings of mAP, uncovering its mathematical underpinnings and its significance in assessing object detection performance.
Armed with this knowledge, you are better equipped to navigate the complex landscape of object detection, armed with the ability to make informed decisions when designing, training, and selecting models for specific applications.

Explore our products
