6 Best Outlier Detection Tools in Computer Vision

Product Manager at Encord
Data contains hidden insights that completely alter how we make business decisions. However, data often consists of abnormal instances, known as outliers, that can distort the outcome of data processing and analysis. Moreover, machine learning (ML) models trained using data with outliers may have suboptimal predictive performance. Hence, outlier detection is a crucial step in any data pipeline.
Here's the catch: manually identifying data outliers is difficult and time-consuming, especially for large datasets. As a result, data scientists and artificial intelligence (AI) practitioners employ outlier detection tools to quickly identify outliers and streamline their data processing and ML pipelines.
In this guide, we’ll explore the best techniques and outlier detection tools. These include:
- Encord Active
- Lightly
- Aquarium
- Voxel
- Deepchecks
- Arize
Compare the Best Outlier Detection Tools
In the sections below, you can compare functionality and features across 6 of the best outlier detection tools available.
Encord Active
Encord Active is a powerful active learning toolkit for advanced error analysis for computer vision data to accelerate model development.
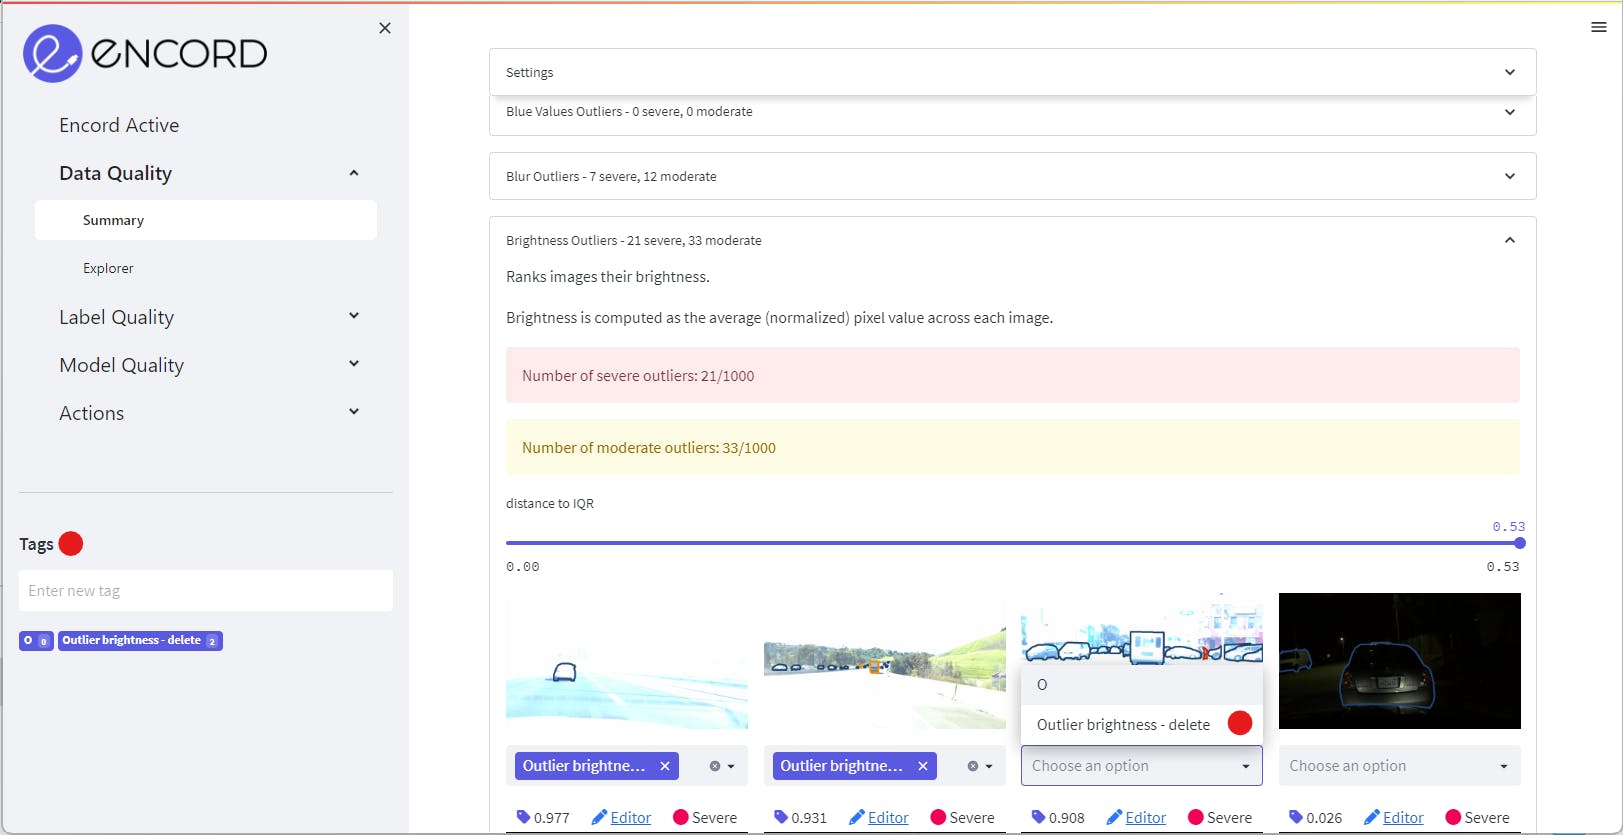
Encord Active dashboard
Benefits & Key Features
- Surface and prioritize the most valuable data for labeling
- Search and curate data across images, videos, DICOM files, labels, and metadata using natural language search
- Auto-find and fix dataset biases and errors like outliers, duplication, and labeling mistakes
- Find machine learning model failure modes and edge cases
- Employs precomputed interquartile ranges to process visual data and uncover anomalies
- Integrated tagging for data and labels, including outlier tagging
- Export, re-label, augment, review, or delete outliers from your dataset
- Employs quality metrics (data, label, and model) to evaluate and improve ML pipeline performance across several dimensions, like data collection, data labeling, and model training.
- Integrated filtering based on quality metrics
- Supports data types like jpg, png, tiff, and mp4
- Supports label types like bounding boxes, polygons, segmentation, and classification
- Advanced Python SDK and API access to programmatically access projects, datasets, and labels
- Provides interactive visualizations, enabling users to analyze detected outliers comprehensively
- Offers collaborative workflows, enabling efficient teamwork and improved annotation quality
Best for Teams Who
- Are looking to upgrade from in-house solutions and require a reliable, secure, and collaborative platform to scale their anomaly detection workflows effectively.
- Need a suite of powerful tools to work on complex computer vision use cases across verticals like smart cities, AR/VR, autonomous transportation, and sports analytics.
- Haven't found an anomaly detection platform that aligns perfectly with their specific use case requirements
Pricing
There are two core offerings: a free, open-source version, and a team plan which requires a support contact.
Lightly
Lightly is a data curation software for computer vision that offers improved model accuracy by utilizing active learning to find clusters or subsets of high-impact data within your training dataset.
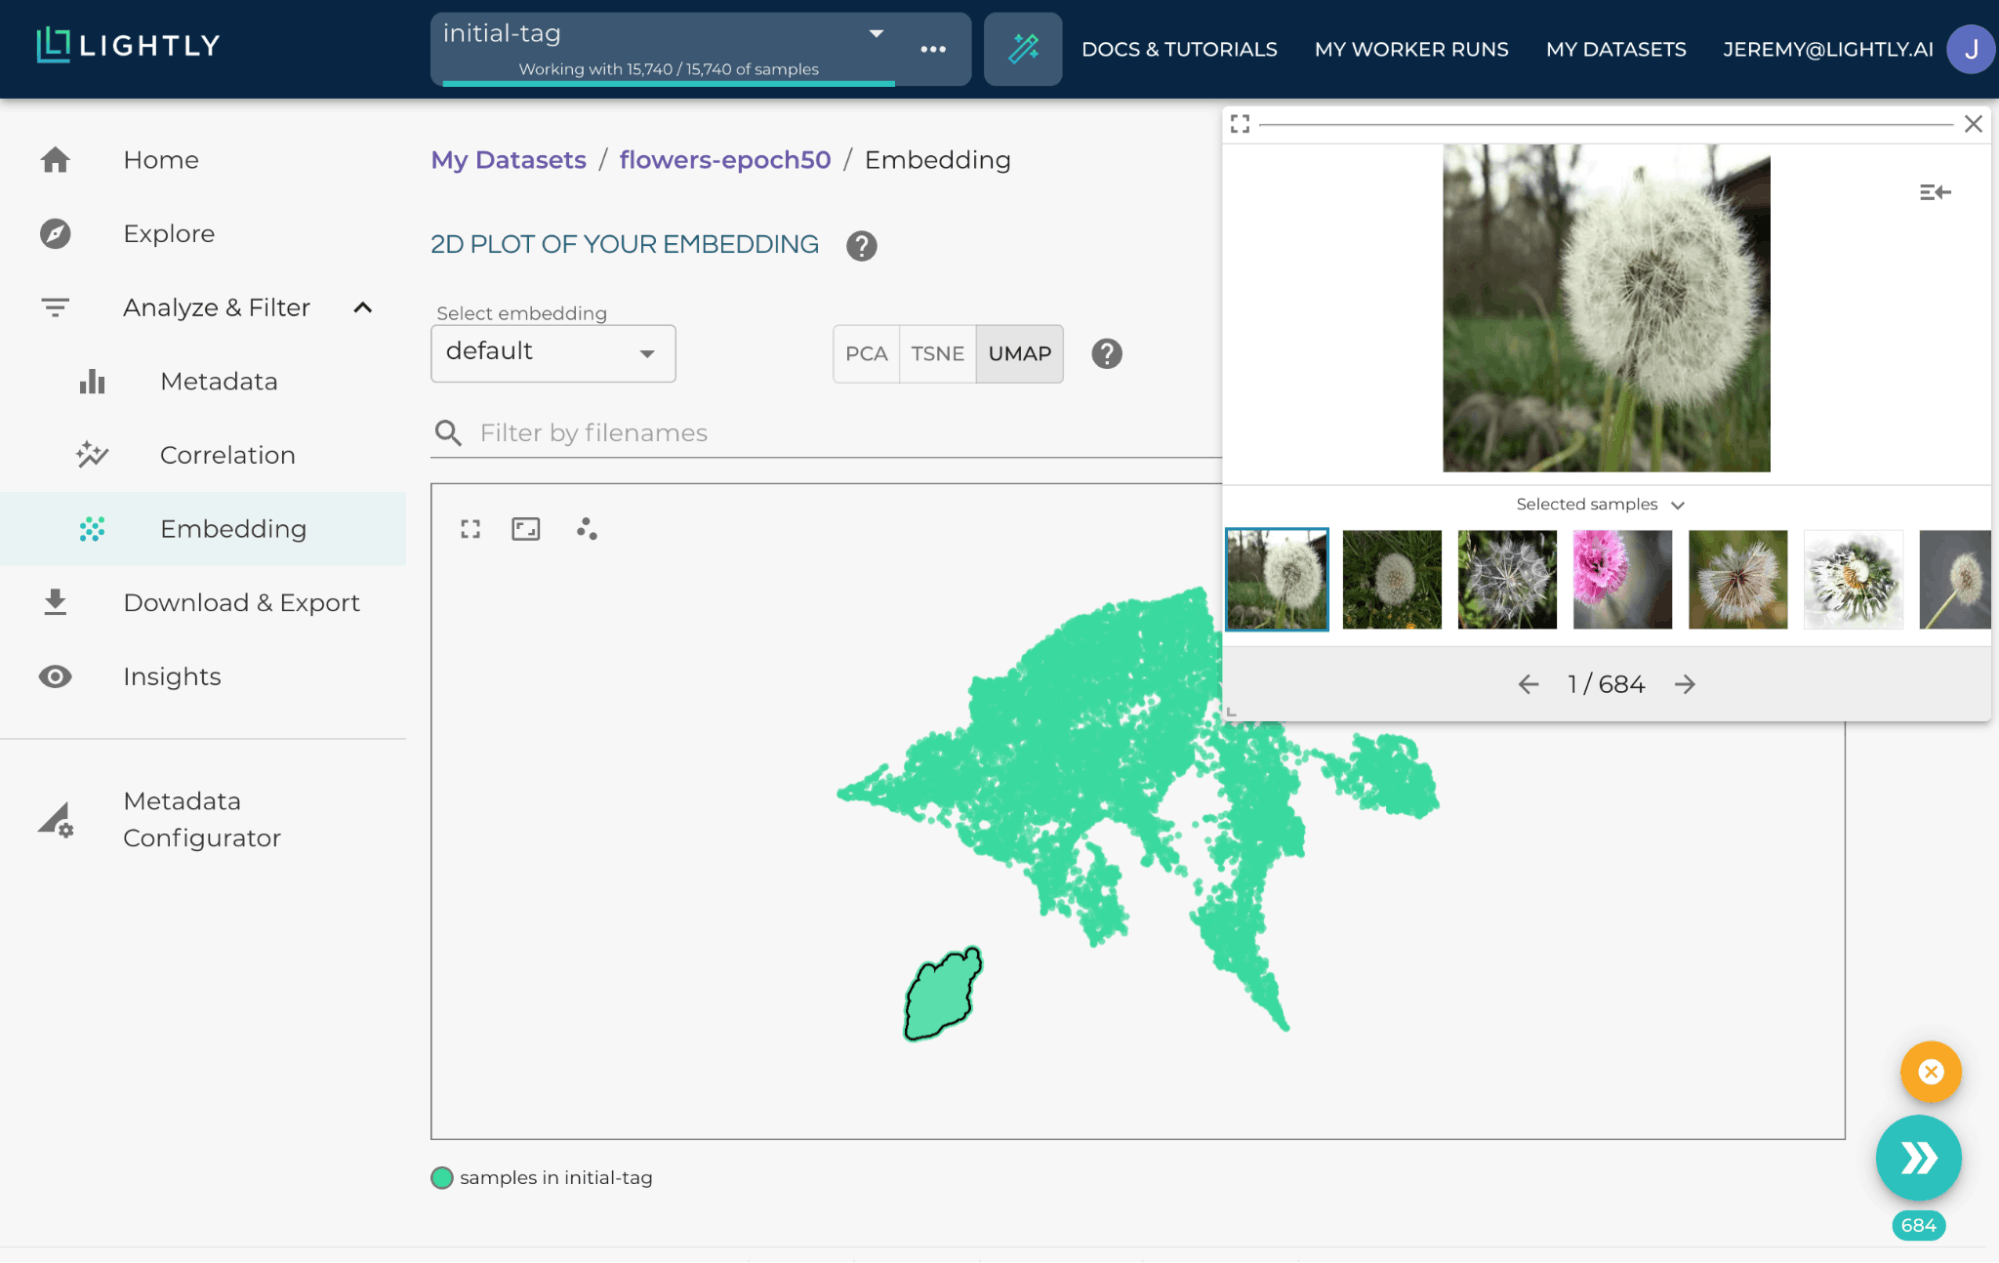
Lightly dashboard
Benefits & Key Features
- Data selection is done via active and self-supervised learning algorithms based on three input types: embeddings, metadata, and predictions.
- Automates image and video data curation at scale to mitigate dataset bias
- Built-in capability to check for corrupt images or broken frames
- Data drift and model drift monitoring
- Python SDK to integrate with other frameworks and your existing ML stack using scripts
- LightlyWorker tool – a docker container to leverage GPU capabilities
Best for Teams Who
- Require GPU capabilities to curate large-scale vision datasets, including special data types like LIDAR, RADAR, and medical.
- Want a collaborative platform for dataset sharing
Pricing
Lightly offers free community and paid versions for teams and custom plans.
Aquarium
Aquarium is an ML data operations platform that allows data management with a focus on improving training data. It utilizes embedding technology to surface problems in model performance.
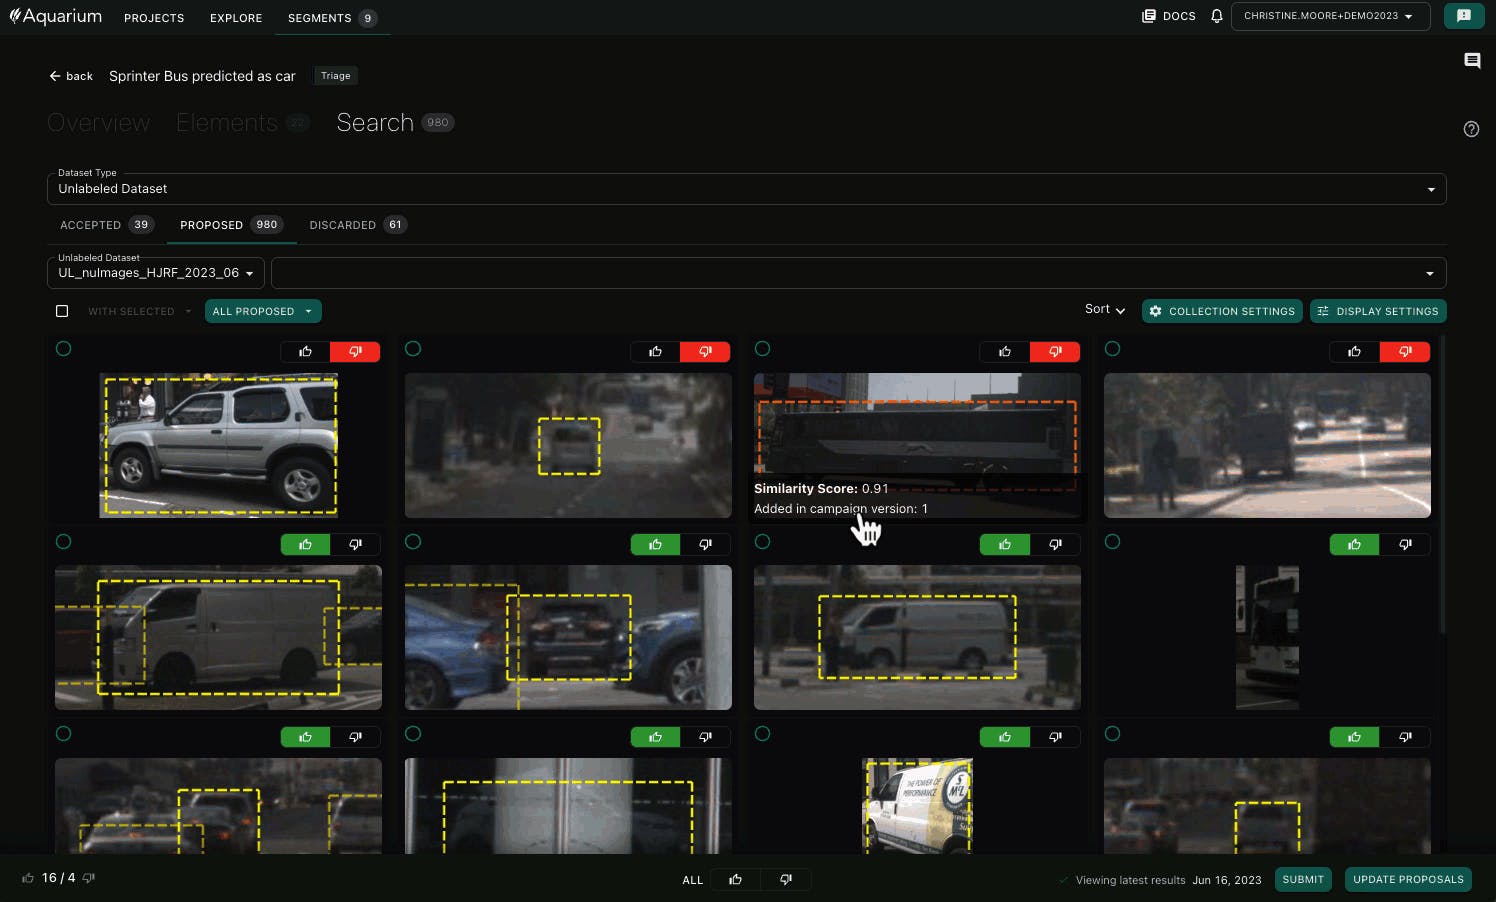
Aquarium dashboard
Users can upload streaming datasets into Aquarium's data operations platform. It retains the history of changes, enabling users to analyze the evolution of the dataset over time and gain insights.
Benefits & Key Features
- Generate, process, and query embeddings to find clusters of high-quality data from unlabeled datasets
- Allows for a variety of data to be curated, including images, 3D data, audio, and text
- Integrates with data labeling suppliers and ML tools like TensorFlow, Keras, Google Cloud, Azure, and AWS
- Inspects data and labels using visualization to find errors and bad data quickly
- Automatically analyze and calculate model metrics to identify erroneous data points
- Community and shared Slack channel support, as well as solution engineering assistance
Best for Teams Who
- Require integration of vendor systems with a data operations platform enabling efficient data flow
- Need ML team collaboration on data curation and evaluation tasks
Pricing
Aquarium offers a free tier for a single user. They also offer team, business, and enterprise tiers for multiple users.
Voxel51
Voxel51 is an open-source toolkit for curating high-quality datasets and building computer vision production workflows.
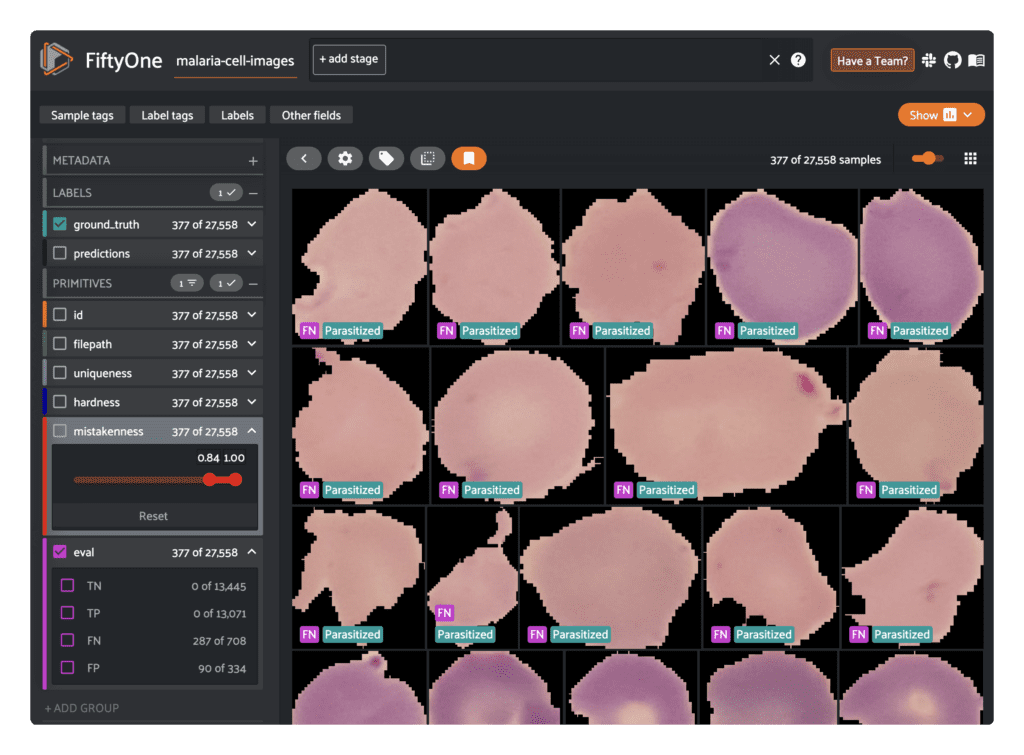
FiftyOne dashboard
Benefits & Key Features
- Integrates with ML tools to annotate, train, filter, and evaluate models
- Identifies your model’s failure modes
- Removes redundant images from training data
- Finds and corrects label mistakes to curate higher-quality datasets
- Dedicated slack channel for customer support
Best for Teams Who
- Want to start with open-source tooling
- Require a graphical user interface that enables them to visualize, browse, and interact directly with their datasets
Pricing
There are two core offerings: FiftyOne, a free, open-source platform, and FiftyOne Teams plan, which requires a support contact.
Deepchecks
Deepchecks is an ML platform and Python library for deep learning model monitoring and debugging. It offers validation of machine learning algorithms and data with minimal effort in the research and production phases.
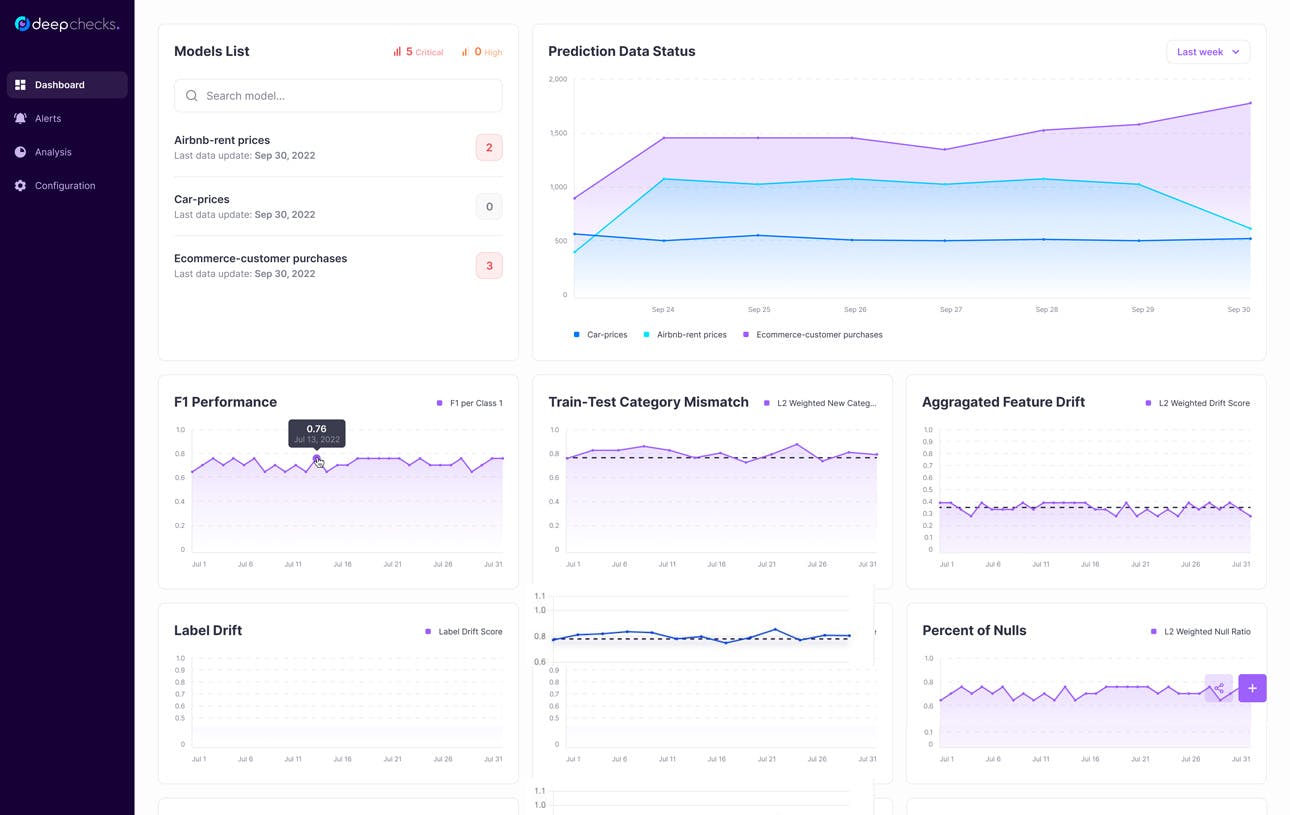
Deepchecks dashboard
The Deepchecks tool utilizes the LoOP algorithm, a method for detecting outliers in a dataset across multiple variables by comparing the density in the area of a sample with the densities in the areas of its nearest neighbors.
Benefits & Key Features
- Utilizes Gower distance with LoOP algorithm to identify outliers
- Real-time monitoring of model performance and metrics (such as label drift)
- Provides Role-Based Access Control (RBAC)
- Prioritizes data privacy by encrypting data during transit and storage
- Slack community and Enterprise support for users
Best for Teams Who
- Are required to monitor model performance and find and resolve production issues
- Deal with sensitive data and value a secure deployment
Pricing
Deepchecks offers open-source and paid plans depending on the team’s security and support requirements.
Arize
Arize is an ML observability platform to help data scientists and ML engineers detect model issues, fix their underlying causes, and improve model performance. It allows teams to monitor, detect anomalies, and perform root cause analysis for model improvement.
Arize dashboard
It has a central inference store and comprehensive datasets indexing capabilities across environments (training, validation, and production), providing insights and making it easier to troubleshoot and optimize model performance.
Benefits & Key Features
- Detect model issues in production
- Uses Vector Similarity Search to find problematic clusters containing outliers to fine-tune the model with high-quality data
- Automatic generation and sorting of clusters with semantically similar data points
Best for Teams Who:
- Require real-time model monitoring for immediate feedback on model prediction and forecasting outcomes
Pricing
Arize offers a free tier for individuals and paid plans for small and global teams.
Outlier Detection: Types & Methods
Outliers are data points with extreme values that are at disproportionately large distances from the normal distribution of the dataset. They represent an abnormal pattern compared to the regular data points. They can occur for various reasons, including data entry and label errors, measurement discrepancies, missing values, and rare events.
There are three main types of outliers:
- Global or Point Outliers: Individual data points that deviate significantly from the normal distribution of the dataset.
- Contextual Outliers: Data points with abnormal distances within a specific context or subset of the data.
- Collective Outliers: Groups or subsets of data that exhibit unusual patterns compared to the entire dataset.
Outliers are also classified based on the number of variables. These are:
- Univariate Outliers: Data points of a single variable that are distant from regular observations.
- Multivariate Outliers: A combination of extreme data values on two or more variables.
Illustration of outliers in 2D data
Now, let’s explore some common outlier detection methods that AI practitioners use:
Z-score Method
This method identifies outliers based on the number of standard deviations from the mean. In other words, the z-score is a statistical measurement that determines how distant a data point is from its distribution. Typically, a data point with a Z-score beyond +3 or -3 is considered an outlier. The Z-score results are best visualized with histograms and scatter plots.
Clustering Method
This method identifies various data clusters in the dataset distribution using techniques like:
- K-means clustering, a technique that creates clusters of similar data points, where each cluster has a centroid (center points or cluster representatives within a dataset), and data points within one cluster are dissimilar to the data points in another cluster.
- Density-based spatial clustering of applications with noise (DBSCAN) to detect data points that are in areas of low density (where the nearest clusters are far away)
In such methods, outliers are identified by calculating the distance between each data point and the centroid, and data points that are farthest from the cluster centers are typically categorized as outliers. The clustering results are best visualized on scatter plots.
Interquartile range (IQR) Method
The IQR method identifies outliers based on their position in relation to the data distribution's percentiles. The IQR is calculated as the difference between the third quartile (Q3) and first quartile (Q1) in a rank-ordered portion of data. Typically, an outlier is identified when a data point is more than 1.5 times the IQR distance from either the lower (Q1) or upper quartile (Q3). The IQR method results are best visualized with box plots.
Many outlier detection tools use similar or more advanced methods to quickly find anomalies in large datasets. And there are many out there. How can you pick the one that best suits your requirements?
Let’s compare our curated list of top outlier detection tools to help you find the right one. Our comparison will be based on key factors, including outlier detection features, support for data types, customer support, and pricing.
What Should You Look For in an Outlier Detection Tool?
Outlier detection is a crucial step in machine learning for ensuring data quality, accurate statistics, and reliable model performance. Various tools utilize different outlier detection algorithms and methods, so selecting the best tool for your dataset is essential.
Consider the following factors when selecting an outlier detection tool:
- Ease of Use: Choose a user-friendly outlier identification solution that allows data scientists to focus on insights and analysis rather than a complex setup.
- Scalability: Select a solution that can efficiently handle enormous datasets, enabling real-time detection.
- Flexibility: Choose a platform that provides customizable options tailored to your unique data and outlier analysis use cases. This is essential for optimal performance.
- Visualizations: Select a platform that delivers clear and interactive visualizations to help you easily understand and analyze outlier data.
- Integration: Choose a tool that connects effortlessly to your existing data operations system, making it simple to incorporate outlier identification into your data processing and evaluation pipeline.
Frequently asked questions
Outliers are data points that are at disproportionately large distances from the normal distribution of the dataset due to abnormal characteristics.
There are various methods for detecting outliers, and the most effective approach is determined by the nature of your data and the unique context of your data operations. However, the common methods are Z-score, K-means clustering, DBSCAN, and the IQR method.
The best plot for finding outliers is determined by the type of data and the specific characteristics you wish to display. The detection method is also important in selecting the plot; for instance, the results of clustering methods are best visualized with scatter and violin plots.
Detecting outliers in time series data can be a challenging task due to the temporal nature of the data. However, some effective techniques exist, such as the Z-score, modified Z-score, and IQR. These methods are effective in identifying abnormal data points within time series datasets.
The best data visualization method for finding outliers is determined by the type of data and the specific characteristics you wish to display. The detection method is also important in selecting the plot; for instance, the results of clustering methods are best visualized with scatter and violin plots.
Outliers can occur for various reasons, including data entry errors, measurement discrepancies, and rare events or sudden measurement spikes.
Outlier detection is essential for computer vision models because it improves model performance, minimizes overfitting, and aids in detecting noisy or unusual cases, resulting in more reliable predictions. As a result, this process increases interpretability and optimizes resource utilization.
To detect outliers with Encord Active, create an account for free and install the Python package in your development environment. Using Encord Active's easy-to-use interface for locating dataset outliers, go to the Data Quality > Summary page to get the Quality Metrics. Click on a specific metric to see moderate to severe outliers.
Encord provides a robust model monitoring setup that allows users to track various metrics during the inference phase in production. This includes checking for outliers on bounding boxes, implementing rule checks to ensure that certain tools do not appear together in a frame, and conducting heuristic checks to identify any flickering between classes. This comprehensive monitoring helps to gather important data for further iterations and ensures the accuracy of surgical video analysis.
Encord offers advanced algorithms that help identify relevant data by utilizing various sampling methods, including geofence sampling and random sampling. This capability allows users to focus on critical edge cases, such as traffic signals in specific areas, enhancing the model's performance in challenging scenarios.
While Encord currently relies on manual inspection for defect detection, it offers features that can be integrated into active learning processes. Users can leverage Encord's capabilities to enhance model performance by embedding videos and utilizing similarity searches to identify potential defects more efficiently.
Encord's curation tools allow users to sort and filter data based on various characteristics, such as brightness or uniqueness of frames. This functionality helps in identifying outliers and cleaning data, which is essential when working with live camera feeds or large datasets to ensure model accuracy.
Yes, Encord can assist in optimizing defect detection models by enabling users to focus on improving the model's performance using direct data labeling, rather than relying solely on segmentation models. This approach helps streamline the workflow and enhances overall model accuracy.
Encord streamlines the dataset curation process by providing tools to sort and filter images based on various metrics, such as brightness and uniqueness. This helps users quickly prioritize and clean their data, ensuring high-quality inputs for machine learning models.
Encord provides tools that facilitate the integration and analysis of data from robotic systems. This includes features that help in identifying anomalies and deviations in the workflow, ensuring efficient operations and timely interventions when issues arise.
Encord is equipped to support anomaly detection by allowing users to define various anomaly classes and event classes within their video annotations. This capability helps teams to quickly identify and address issues within their video datasets.
Encord offers specialized tools for anomaly detection, allowing users to identify unusual patterns or objects in both image and video data. This feature is critical for applications in robotics and automated systems where precision is vital.
Encord offers features that allow users to identify outlier data effectively. By integrating various metrics and utilizing visualization tools, users can spot anomalies and better understand their dataset.