
Insights for AI Builders
Encord Blog
All articles
417 of 417 articles
Introducing Merlin: The Agentic Intelligence Layer for Encord
Agents
Jun 16 2026![Logistics Data Labeling: the 6 best platforms and where they fit [2026]](https://images.prismic.io/encord/aKLLPKTt2nPbaZsa_Platformouterframe.png?auto=format%2Ccompress&fit=max)
Logistics Data Labeling: the 6 best platforms and where they fit [2026]
Data Annotation
Jun 15 2026
Audio Annotation for AI: From Speech to Sound Recognition
ContentHub
Jun 10 2026
Encord Integrates NVIDIA Cosmos Reason and Embed
Agents
Jun 03 2026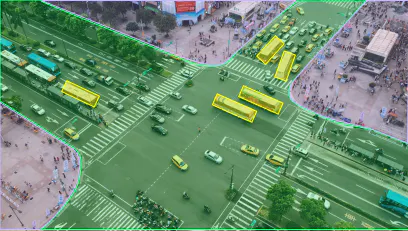
The Complete Guide to Security Video Annotation
Smart cities
Jun 02 2026
The Complete Guide to Data Labeling for Robotics
Data Annotation
May 26 2026
Annotate inconsistent real-world road images for smart cities (Vialytics case study)
Smart cities
May 12 2026
Will World Models Eat Physical AI?: What We Learned from Our Physical AI Panel
Physical AI
Apr 30 2026
What Does It Actually Take to Trust a Robot in Production? Warehouse Robotics Roundtable Recap
Physical AI
Apr 24 2026
How to Automate Video Annotation for Machine Learning
Computer Vision
Apr 15 2026The Complete Guide to Data Annotation [2026 Review]
Data Operations
Apr 08 2026
Gemini Robotics: Advancing Physical AI with Vision-Language-Action models
Computer Vision
Apr 05 2026