Contents
Introducing Customer: Neurolabs
Problem: Training models with synthetic data to solve real-world problems
Solution: Encord Active Quality Metrics and model failure modes
Result: Improved overall last-mile performance by 2% and performance of edge-case class by 67%
Takeaways
Appendix
Improving Synthetic Data Generation with Encord Active

This is a guest report fully written by Neurolabs. You can read it to discover how Neurolabs is changing retail performance with synthetic computer vision and how Encord Active enhances its data generation efforts to improve model performance.
Introducing Customer: Neurolabs
At Neurolabs, we’re on a mission to revolutionize the world of in-store retail performance with our cutting-edge image recognition technology, ZIA.
Our advanced technology empowers Consumer Packaged Goods (CPG) brands, Field Marketing Agencies, and Sales Force Automation companies to optimize retail execution, elevate the customer experience, and boost revenue growth.
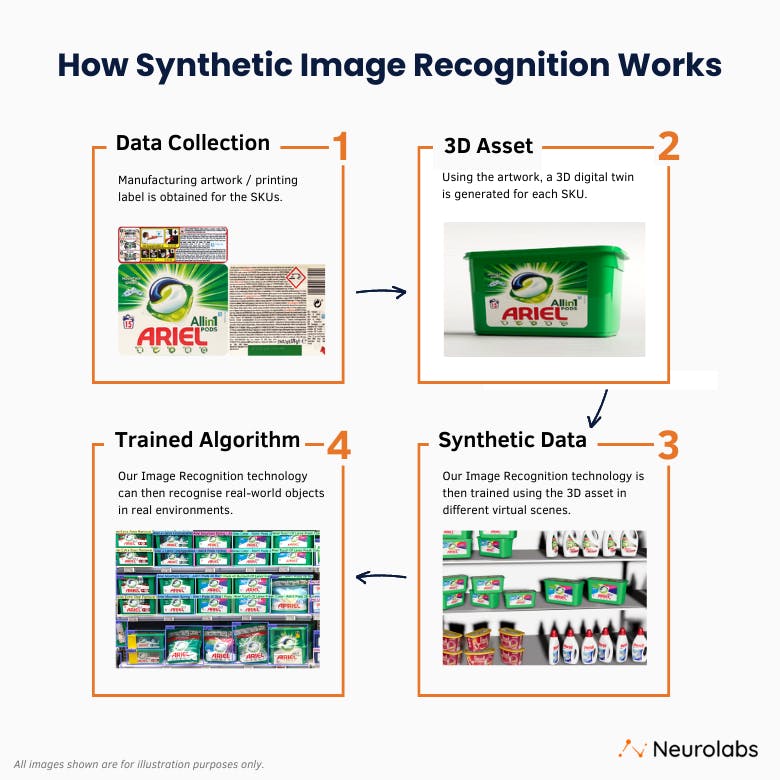
By building the most comprehensive 3D asset library for product recognition in the CPG industry, we are at the forefront of innovation. Our state-of-the-art synthetic image recognition technology sets new standards and drives remarkable results.
With a steadfast commitment to a data-driven approach, we provide our customers with invaluable insights, enabling them to make informed decisions and outpace the competition.
Problem: Training models with synthetic data to solve real-world problems
Transferring knowledge trained on synthetic data to the real world remains a major challenge in computer vision.
When evaluating our models using synthetic data, we noticed certain classes were underperforming compared to real-world data, so we set out to analyze the source of this discrepancy. By understanding the root cause, we hoped to improve our synthetic data generation process.
Solution: Encord Active Quality Metrics and model failure modes
By leveraging Encord Active and its Quality metrics, we gained a better understanding of our data and identified areas for improvement.
In practice, we addressed issues for synthetic images of individual classes such as 3D object scaling, pose, image brightness, and blur.
This methodical data-centric approach can be used to generate better synthetic data and improve model performance across various use-cases.
Result: Improved overall last-mile performance by 2% and performance of edge-case class by 67%
We started with implementing the recommendations for 1 of 6 low-performing classes we got based on Encord Active insights into our synthetic data generation pipeline. With this, we improved the per-class performance from 0% to 67% (AP50) and 0% to 100% (P1). The next steps are to implement changes for all low-performing classes in our dataset based on our insights.
In this guest post, we will:
- Analyze our current model performance and identify gaps
- Analyze our training and test dataset using Encord Active
- Perform targeted improvements to our synthetic data to improve overall model performance and class-based performance.
Let’s dive in!
Analysing Current Model Performance
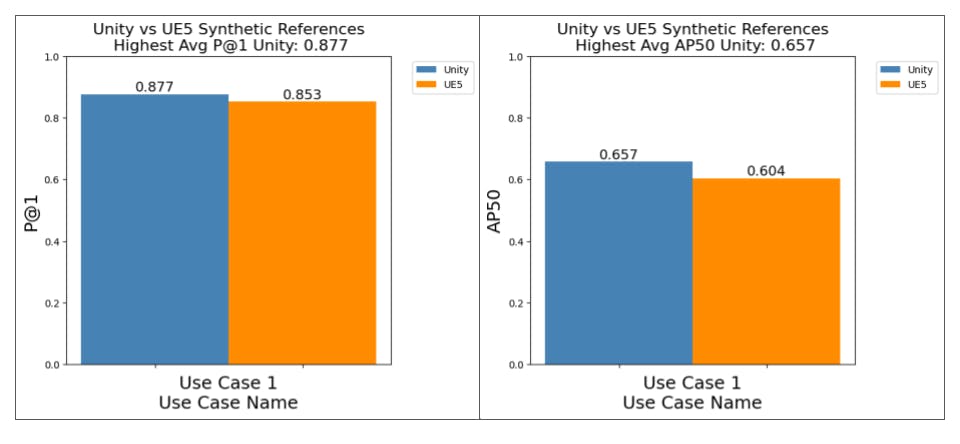
This analysis was prompted by having a closer look at the per-class performance plots obtained when first creating benchmarks between our Unity renderer setup and our more recent UE5 data generation pipeline.
When evaluating our models on real-world data, it revealed large performance drops for certain classes that performed well when using Unity.
The overall performance plot, such as the ones below for AP50 and P@1, provides an insight into how a particular set of references perform.
Transition unity to UE
 💡Tip: You can read all about computer vision model performance and how to evaluate them here.
 If we inspect the per-class performance between two of our first use-case, we notice that there are classes with low performance.
An example is the “Ariel + Revita Black” class

Class example “Ariel + Revita Black”
When we isolated the class performance we got an AP50 and P@1 of 0.0. With Encord Active’s functionality to analyze model performance based on quality metrics and its data visualization features, we can gain a better understanding of what causes this issue.

AP50 when using UE5 References achieves 0.0

P@1 when using UE5 References achieves 0.0
Analysing Data Inputs
The data we use during our evaluation stage can have a significant impact on our decisions regarding data generation and model improvements in the future.
Gaining insight into the data in greater detail is essential for us as a team. We want to be well-informed about our experiments' findings, and why they may be the way they are so we can successfully implement improvements. By having a better comprehension of the data, we can move towards bettering our results with confidence.
When it comes to data analysis, we leveraged Encord Active’s per-class performance plots. This enabled us to pinpoint areas of strength and areas for improvement.


If we tackle the lowest-class performers in our dataset, we should be able to push the overall performance up. To do this, we should take a look at the individual data inputs to the evaluation stage to get a better understanding of what we are working with.
Encord Active is a powerful tool, offering many features. In this article, we won’t provide an exhaustive list of all the features we utilized; instead, we will highlight a few of the most useful features and quality metrics that offered us beneficial information and actionable insights into our data.
{light_callout_start}}💡Tip: read all about Quality Metrics and how to use them.
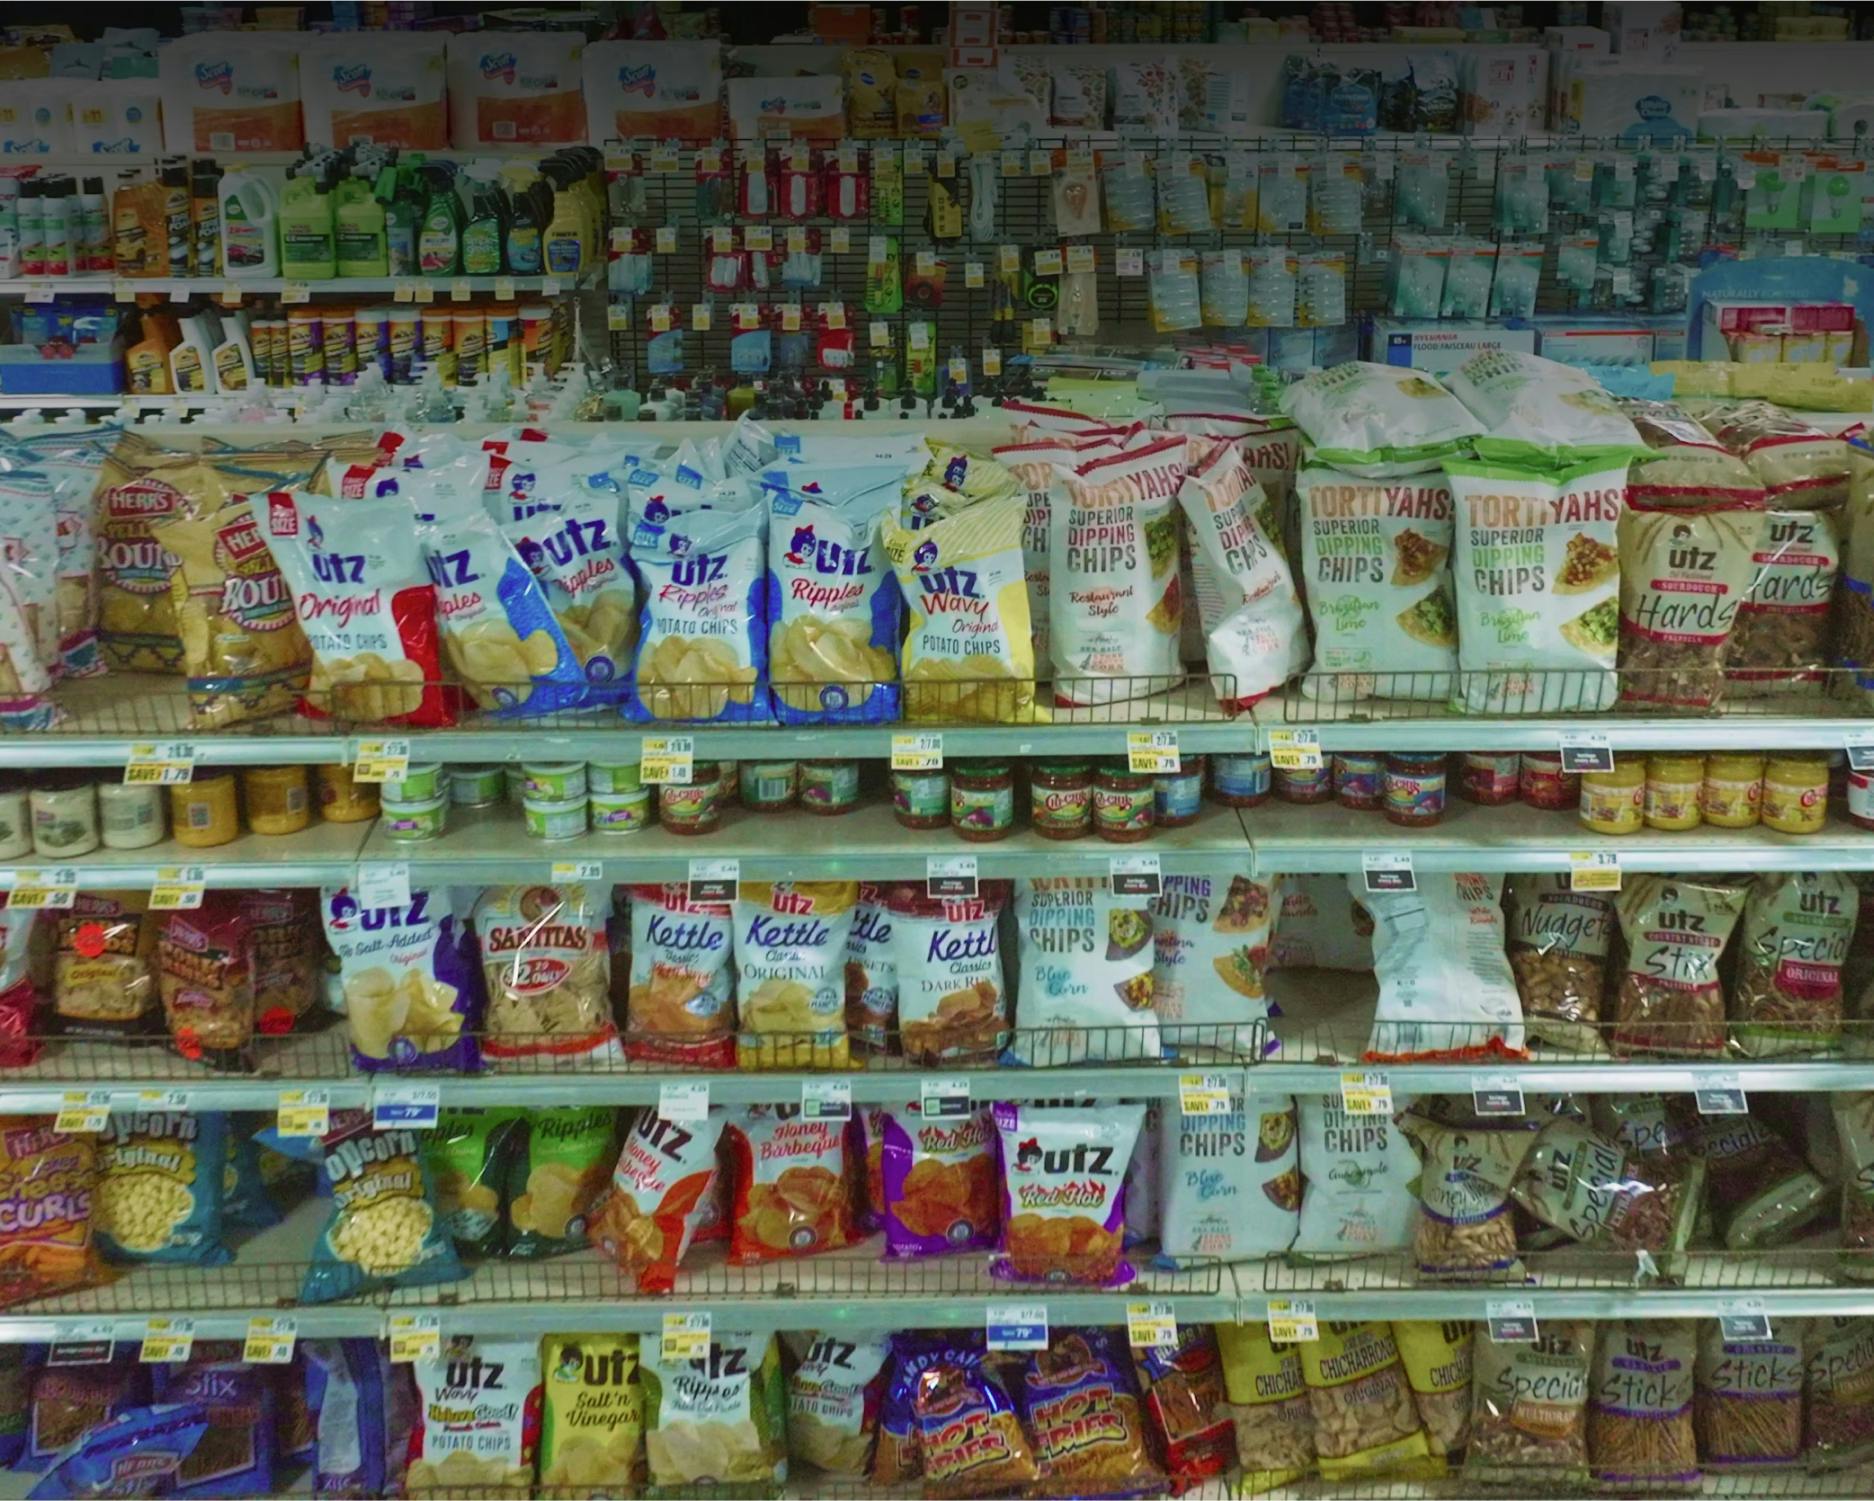
Real-World Test Set — “Query set”
We started our investigation by examining our real-world query set. This is the type of data we typically use to evaluate how well our model is performing when using some set of references — either synthetic, real, or mixed.
The data here plays a vital role in the evaluation phase, and we need to pay close attention to some key points:
- Do we have a balanced test set?
- Do we have outliers in our test set?
- Do we have issues with the annotations?
- Do we have duplicate samples?
Using Encord Active, we got a better understanding of these points and more.
To begin with, we generated a new project in Encord Active, using the test set for our first use case. Using the Data Quality feature, we visualized our data and interpreted classes of interest.
First, we investigated the distribution of samples per class.
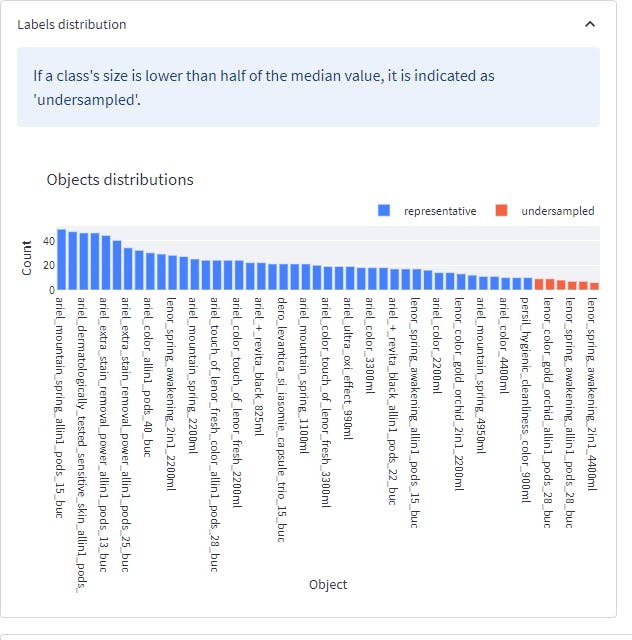
Here, we identified six under-sampled classes, as illustrated in the image above.
Gaining this insight enabled us to understand better whether lower performance on a per-class basis is related to fewer data samples for those particular classes.
This would be a good indication for us to investigate ways to increase the number of samples for those particular classes in our test set that are underrepresented.
At the top end of the scale, we can see that we are performing well in situations where we have a lot of samples, as it’s more forgiving when we make an incorrect prediction. In addition to finding the lowest-class performers, keeping an eye out for under-sampled classes is a good way to isolate problems.
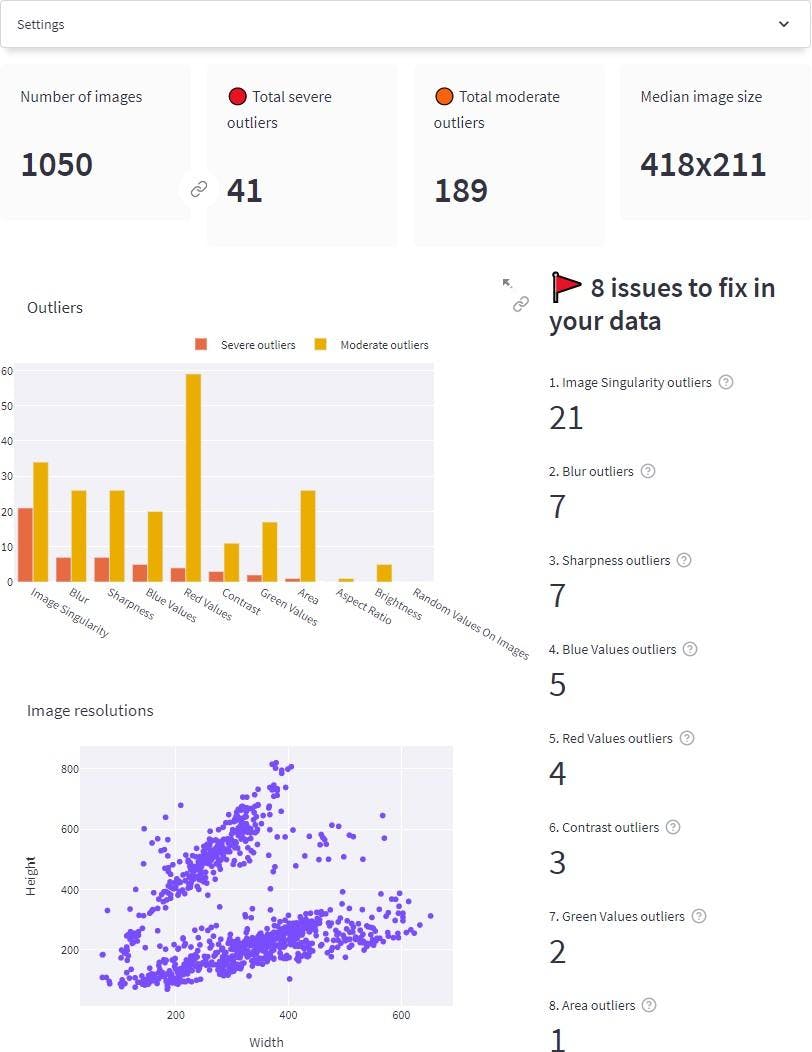
Overview of the query dataset from the Data Quality page. The Data quality summary can be accessed by going to Data Quality → Summary on the left pane.
In the above figure, we can see several issues being raised in our query set.
- Our test set contains several outliers across different quality metrics. Image singularity, blur, and sharpness are the ones with the most severe outliers.
- Our test dataset contains a variety of different image resolutions ranging from 50x50 to 600x400.
Next, we will explain how we analyzed the outliers from one of the quality metrics, Image Singularity:
Image Singularity Outliers
The Image Singularity quality metric enabled us to accurately spot unique images and duplicates in our query set. This was highly advantageous in the identification of low-quality data in our test set.
To illustrate, the figure below displays several samples flagged as being unique in our test set.

Unique samples
In the figure above, we can see that several samples in our test set are cut off, occluded, blurry, and rotated in a more challenging way to predict. This was an unexpected benefit of our analysis, and we noted down and tagged these cases to investigate further how they could impact our performance.
Ultimately, we aim to tackle these challenging scenarios to make our models more robust.
However, if this is a frequent occurrence, it frames the problem in a manner that may reshape how we approach generating the data for particular classes of interest. To ensure accuracy, it was important to analyze other metrics, and Encord Active was a great tool for tagging and keeping track of any issues we encountered during our evaluation. This allowed us to gain a better understanding of the impact of using these datasets.
Real-World Training Set — References
We performed a data quality analysis similar to the above on the training set to understand why we may be getting much higher performance on real data compared to using synthetic data.
Here, we visualized the Object Annotation Quality metric and took a closer look at samples from the training set that was classified as low quality.
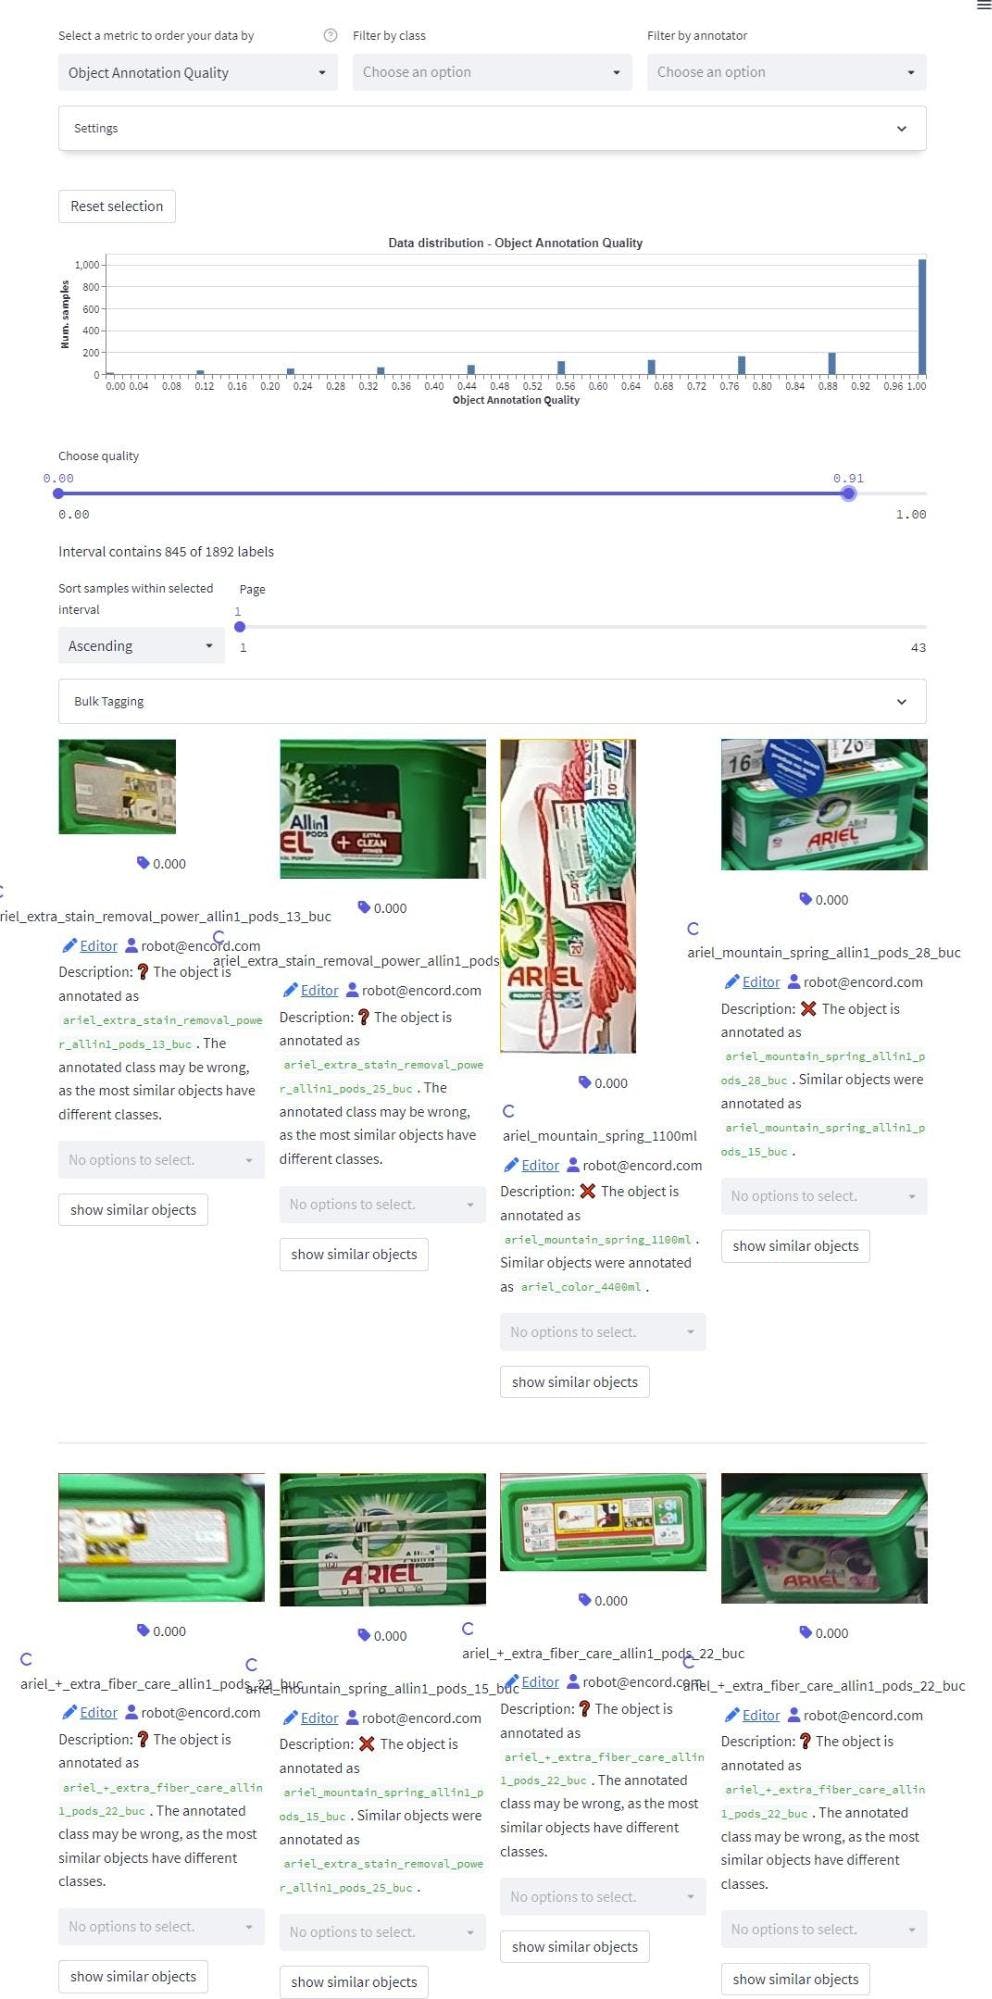
This analysis helped us better identify which particular classes have close associations with each other.
Notice that the low-quality samples are classes of interest, and there may be a chance that these classes have similar-looking samples in the test set that wouldn’t appear in a synthetically trained model.
An example of this can be seen below, where the image on the left is a sample from the real-world training set, and the sample on the right is from the test set.
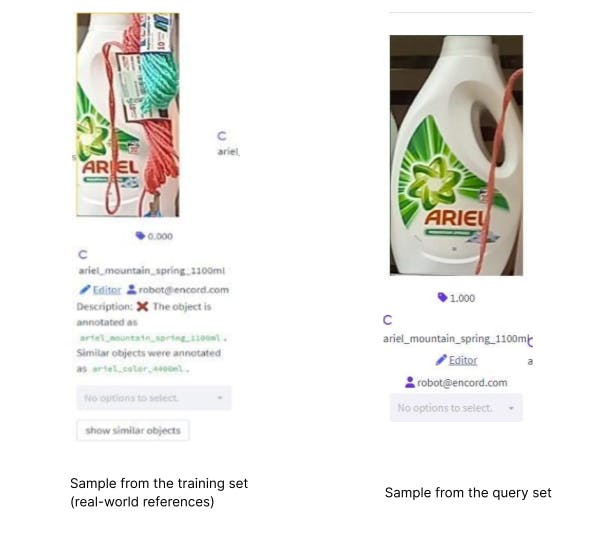
Notice how both objects of interest contain some string occluding them. This situation would not occur when using our current synthetic data. This means that for this particular sample, we may be underperforming on synthetic data compared to real, as we do not model the two similarly.
The more samples of this kind that we include in our real-world training set, the more pronounced the impact will be. This divergence in performance between synthetic and real data is due to differences between the types of data used as references.
UE5 Synthetic Data — References
Referring back to this figure that shows a particular class of synthetic data underperforming relative to our Unity rendering pipeline, we aim to get a better understanding of the potential reasons behind this.
AP50 when using UE5 References achieves 0.0
P@1 when using UE5 References achieves 0.0
Using Encord Active to isolate this particular class, we inspected the images using various quality metrics and noted several differences between the real samples and synthetic ones.
- Small synthetic images that do not match real-world images
- Rotated synthetic images that deviate from real-world images
- Dark synthetic images that do not match real-world images
At first, we discovered a significant number of synthetic images that were really small in scale and did not resemble their real-world counterparts in terms of size.
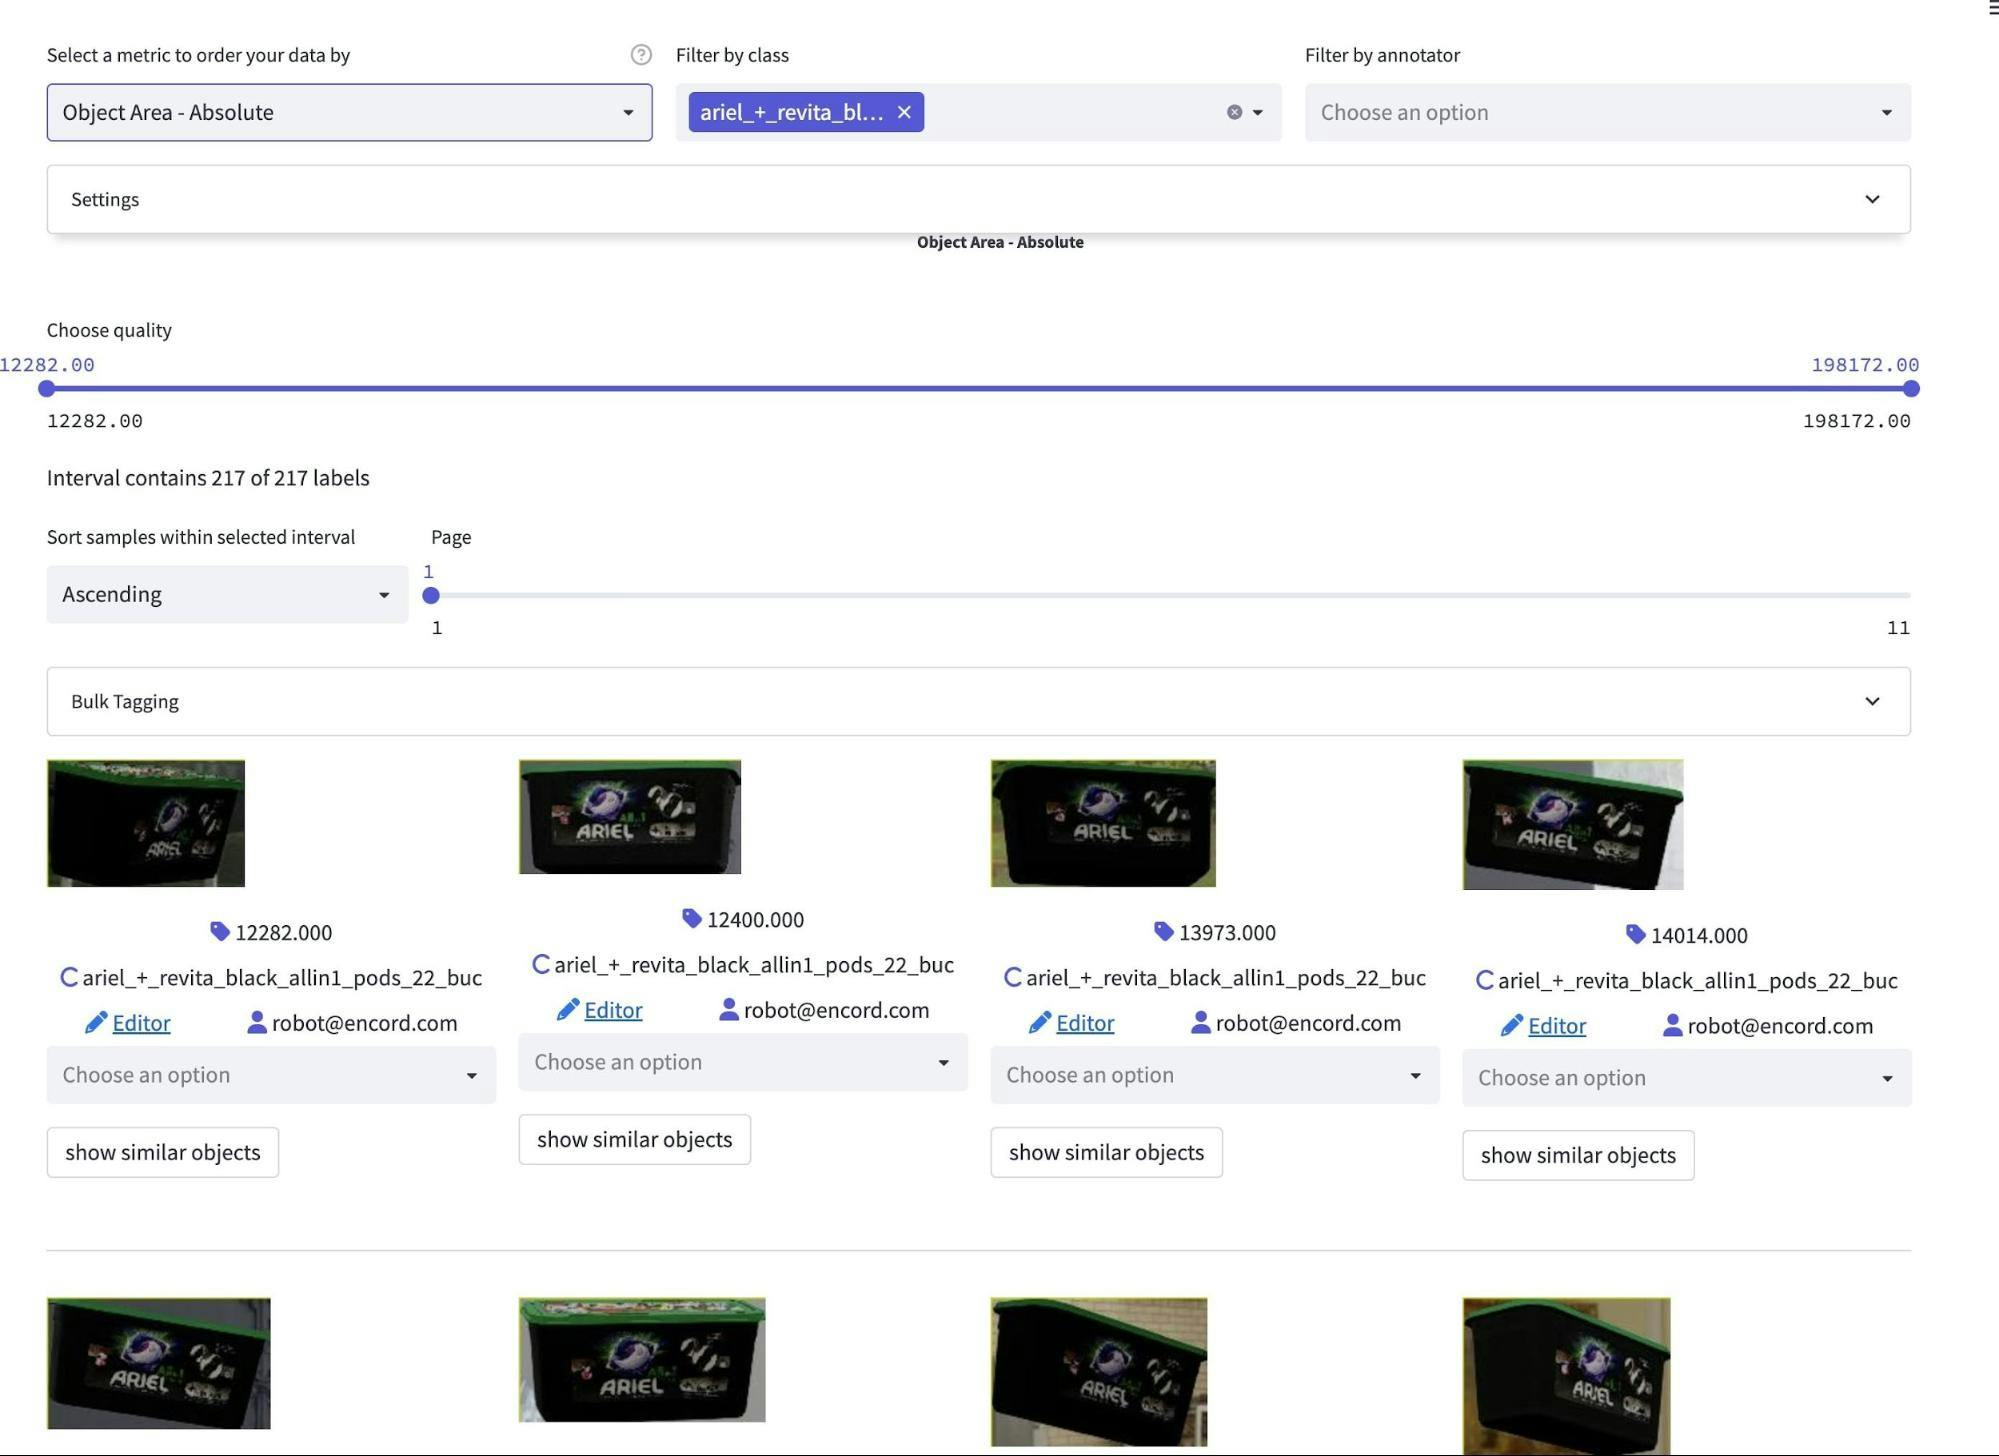
Object scaling is much smaller for this particular class compared to the real data.
Secondly, we included rotations that deviate quite far from reality. These samples may be sub-optimal to include in the training set, as shown below, as they are unlikely to be encountered in the real world for our current use case.
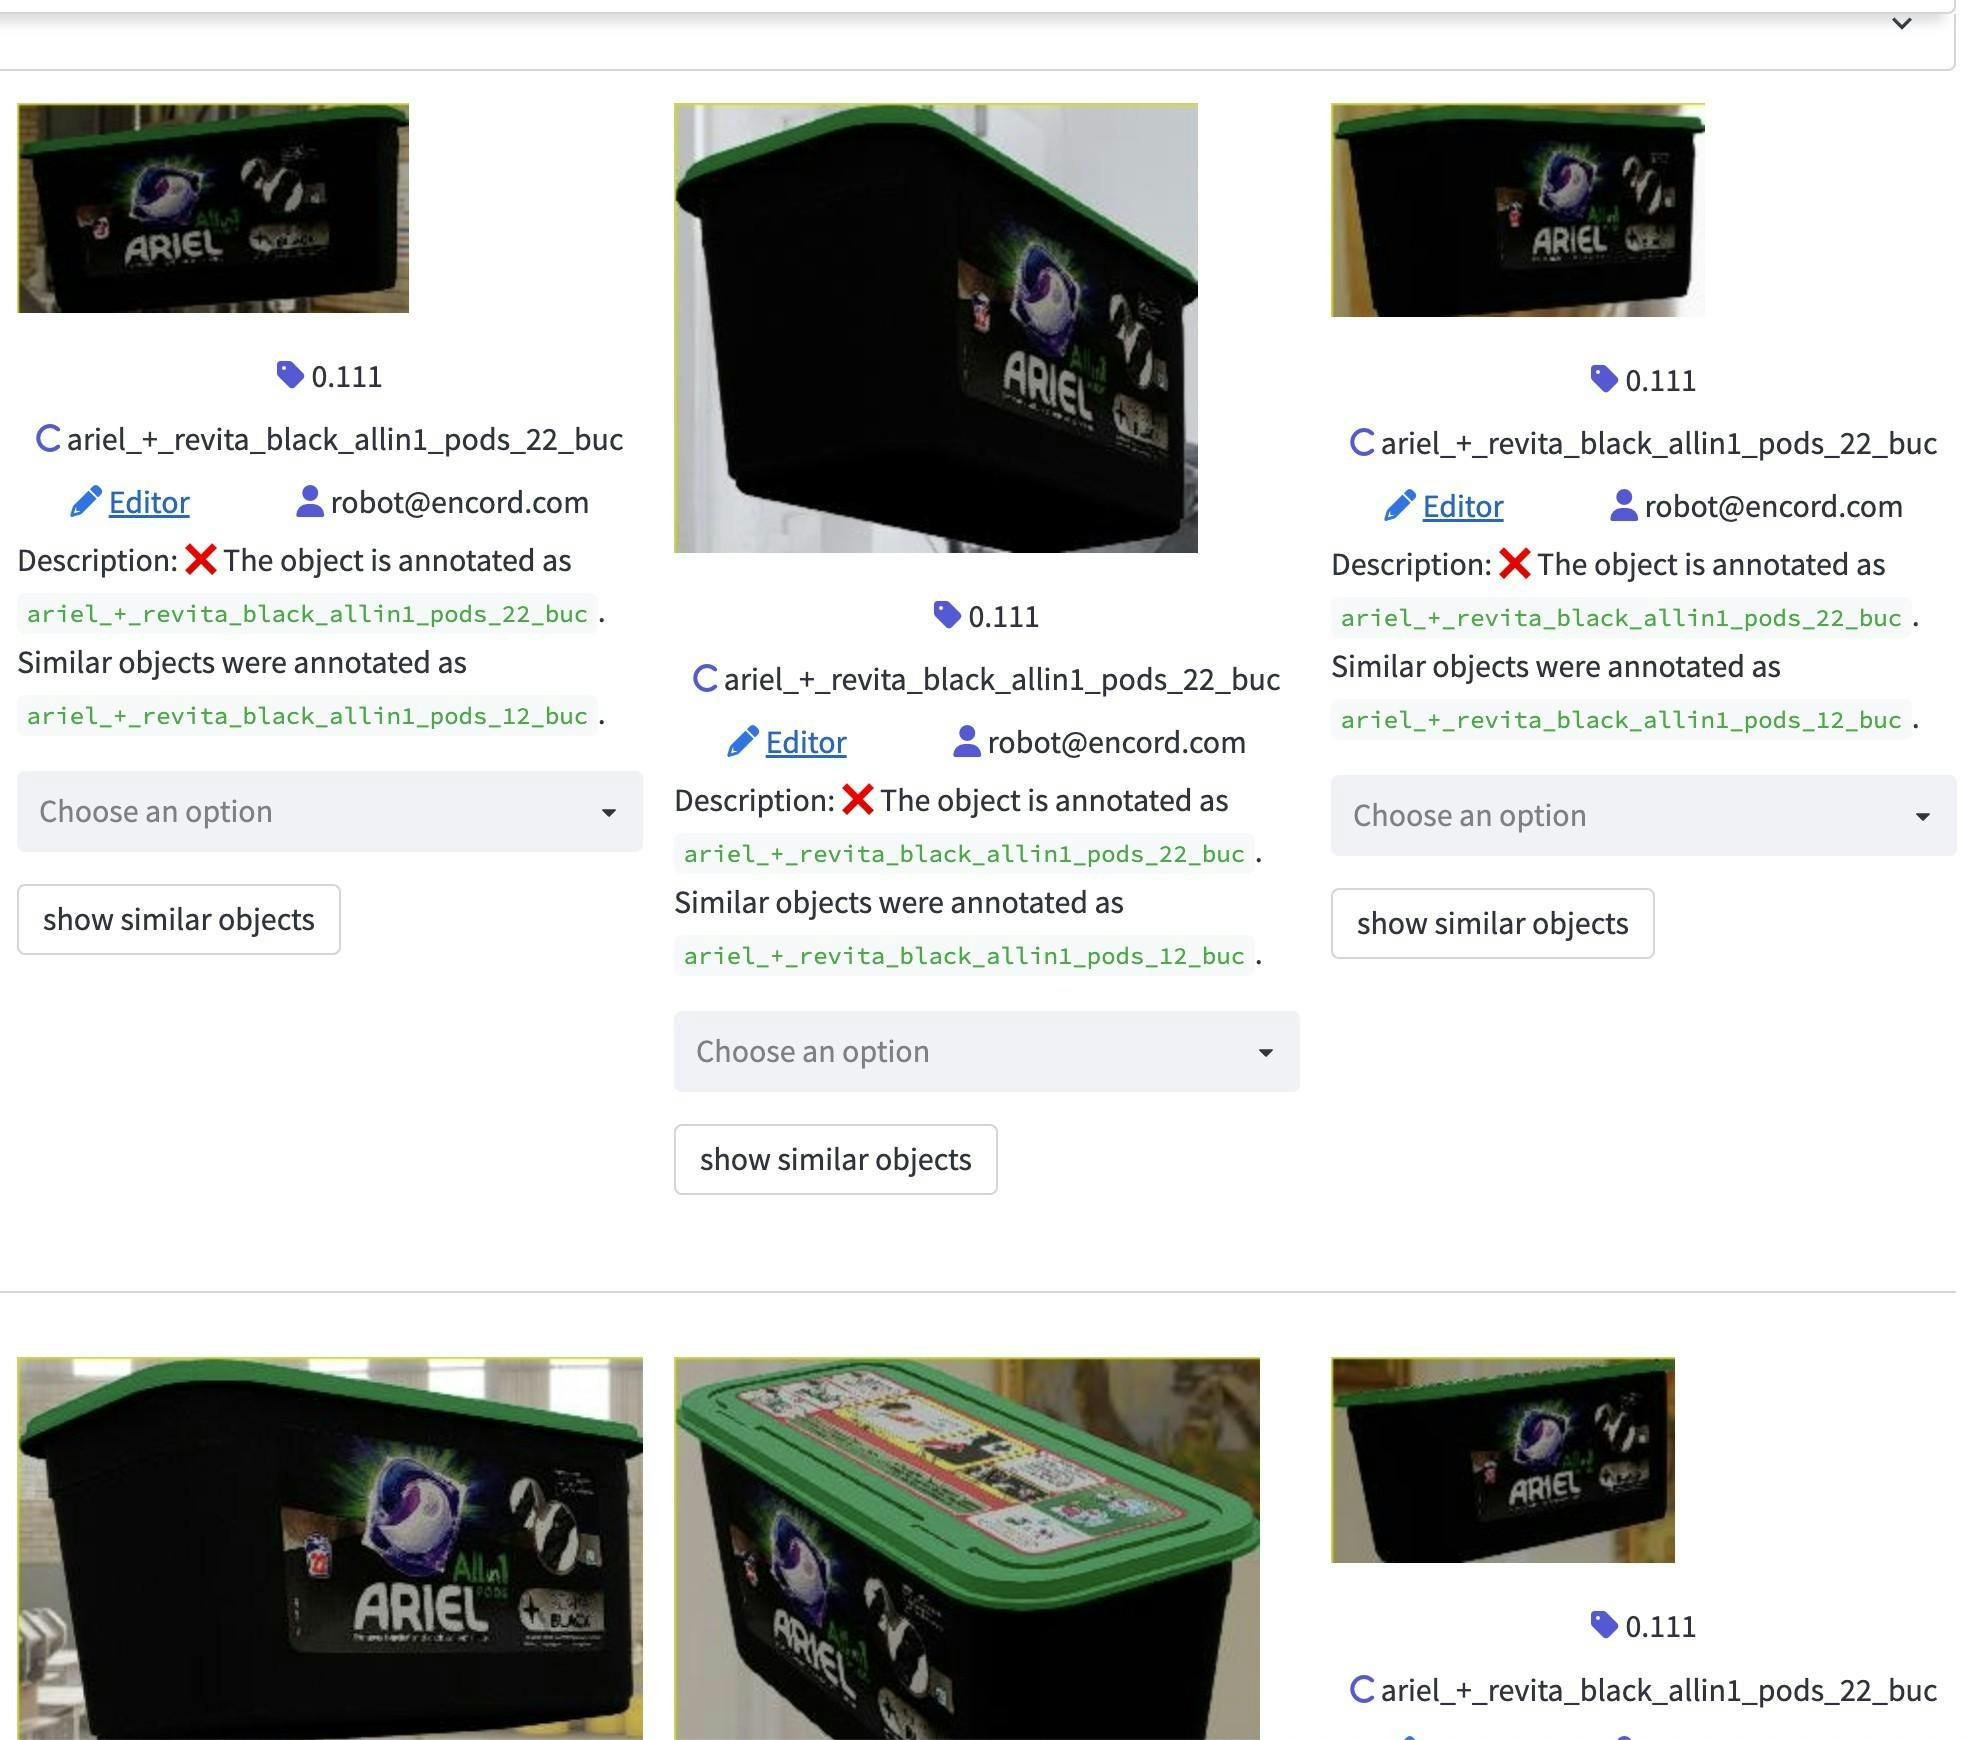
Rotations
Lastly, we identified several samples with a much darker tone when compared to the real data. This can make it quite challenging to distinguish the object of interest from the background.

Brightness metric

Brightness, rotation, and scaling issues for this ariel_+_revita_black_allin1_pods_22_buc getting an AP50 of 0 and P@1 of 0.
After addressing the above issues and re-generating the data for that class, we ended up with samples that looked much closer to the real-world data.
We re-generated the data by looking at samples from the real-world references (training set) to avoid introducing additional bias in targeting performance specific to the real-world test set.
The images on the left are synthetic with the changes, and the right is real-world samples.

Left side synthetic examples with changes, right side real-world samples.
As shown in the P@1 plot below, the blue bar shows the performance of using the updated samples for that class resulting in P@1 jumping from 0.85 to 0.891 and AP50 from 0.604 to 0.622.
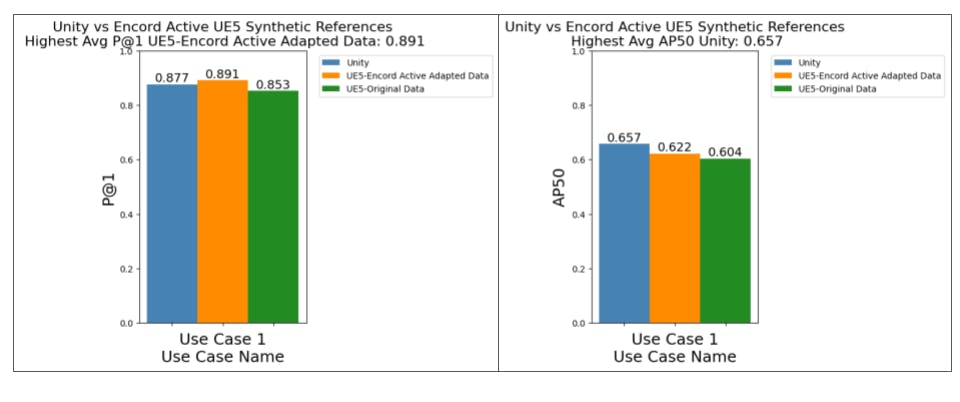
We also found that the previously problematic class that obtained a P@1 and AP50 of 0.0 subsequently increased.

AP50 when using updated UE5 References results in 0.676 compared to 0.0 previously.

P@1 when using updated UE5 results in a P@1 of 1.0 compared to 0.0 previously.
Takeaways
By taking a data-centric methodical approach and analyzing the data closely, we gained a better understanding of what type of synthetic data we needed to generate to achieve the highest performance from our models.
Diving deep into the performance on a class-by-class basis allowed us to tackle some of the worst-performing classes and improve their performance based on insights from analysis of the datasets and models in Encord Active.
Appendix
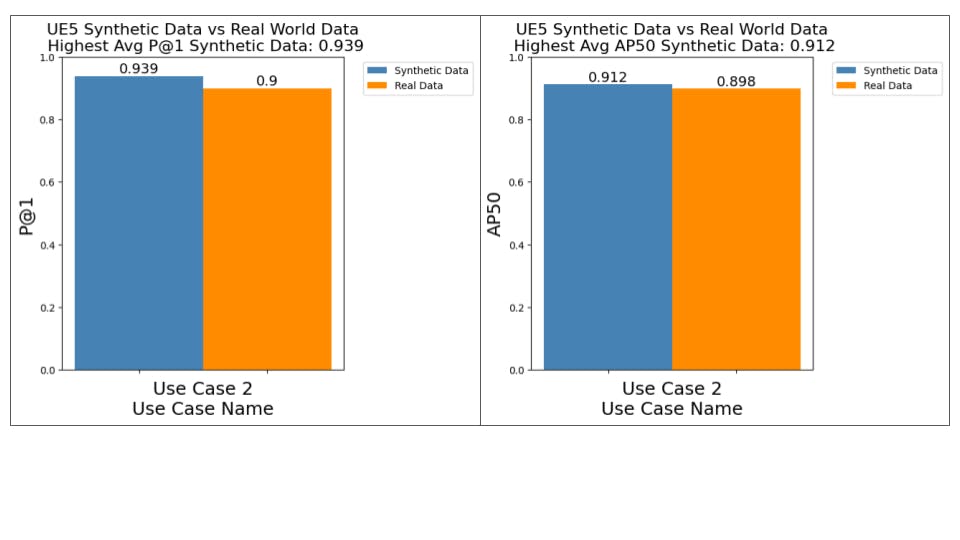
We can extend the ideas above to better approach data generation on a different use case. For example, a second use case contains a proportion of the training and test set with blurry image samples for our classes of interest. By inspecting object scaling, poses, image brightness, and image blur, we can better generate synthetic data for the use-case. The updated synthetic data outperforms our models trained on real data.

Left side Synthetic Data and right side Real-world data
After blurring the images to the same degree as the real-world data and retraining our model, performance surpassed the same model trained on real-world data.