Encord Blog
How to Label a Dataset (with Just a Few Lines of Code)
The purpose of this tutorial is to demonstrate the power of algorithmic labelling through a real world example that we had to solve ourselves.
In short, algorithmic labelling is about harvesting all existing information in a problem space and converting it into the solution in the form of a program.
Here is an example of a algorithmic labelling that labels a short video of cars:
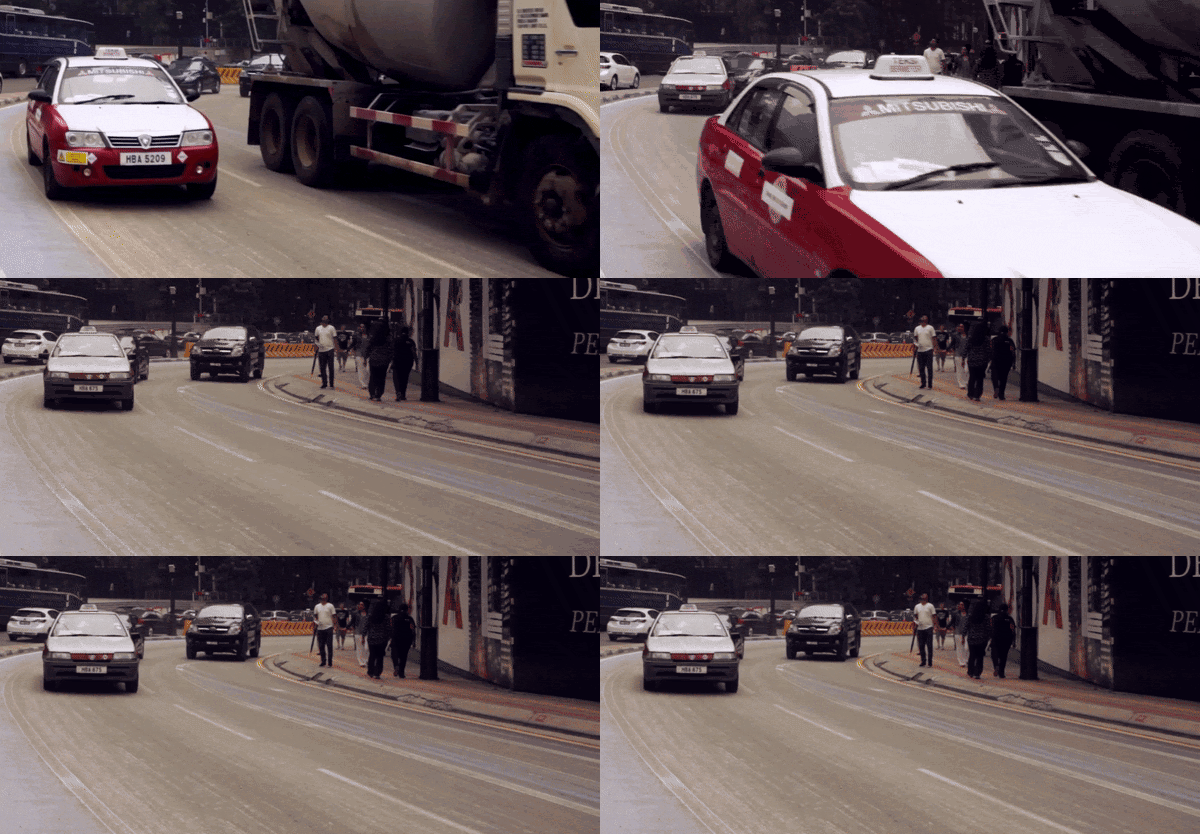
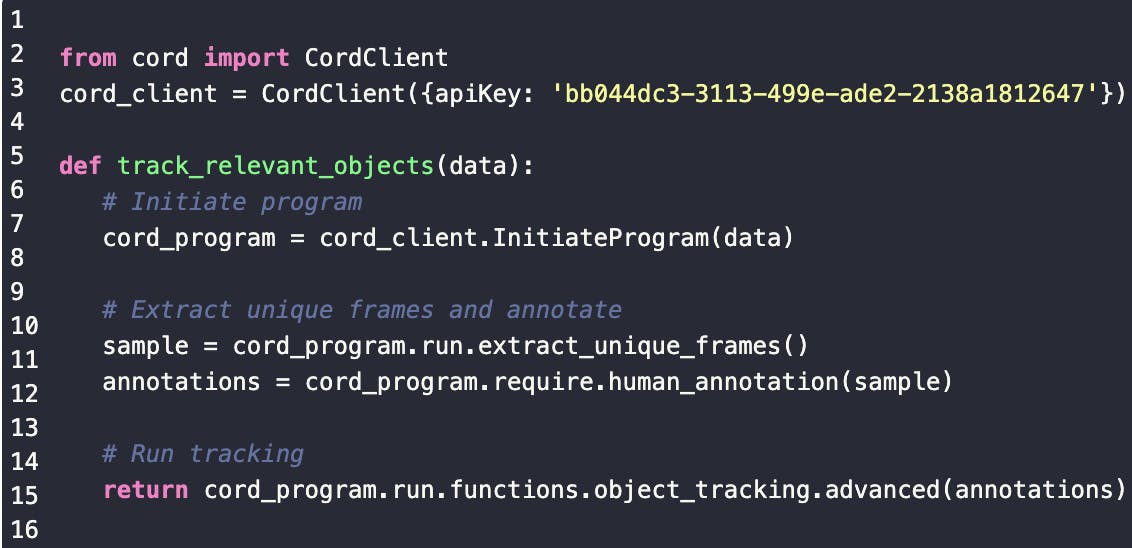
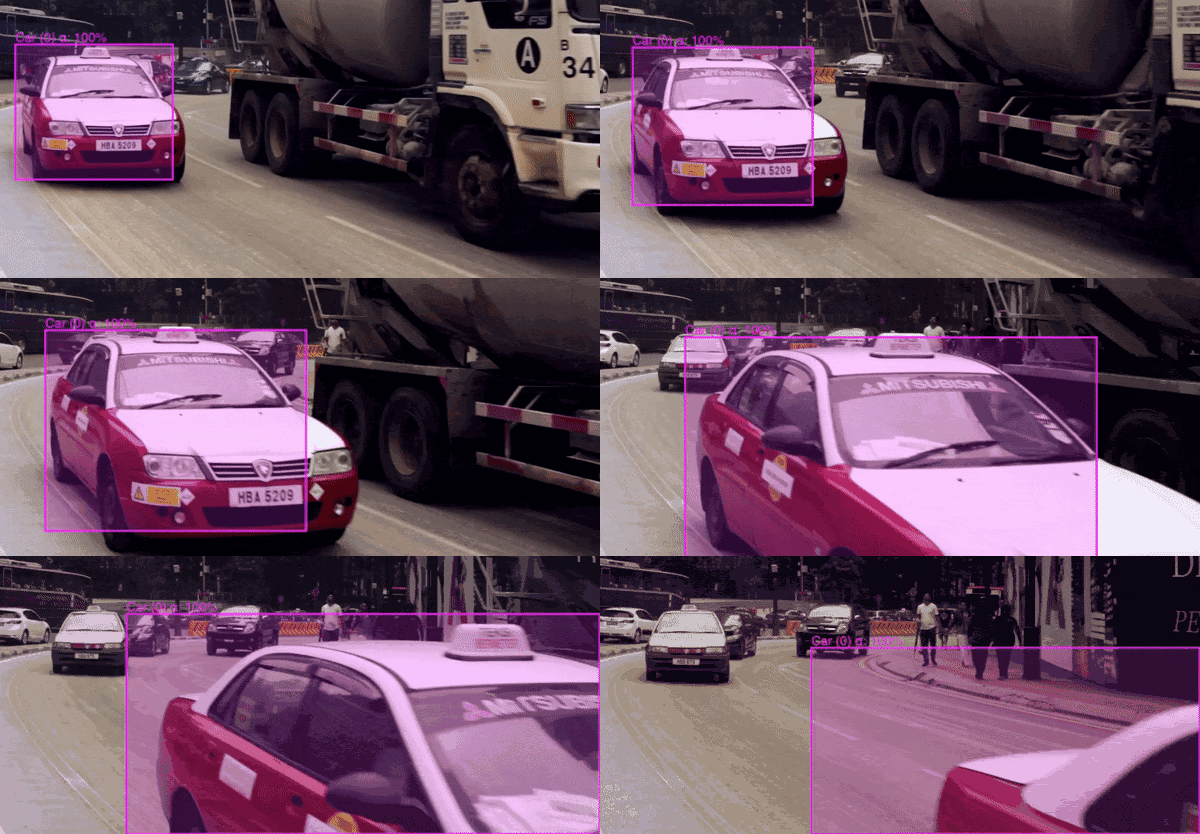
a) Raw Data b) Data Algorithm c) Labelled data
Our usual domain of expertise at Encord is in working with video data, but we recently came across a problem where the only available data was in images. We thus couldn’t rely on the normal spatiotemporal correlations between frames that are reliably present in video data to improve the efficiency of the annotation process. We could, however, still use principles of algorithmic labelling to automate labelling of the data. Before we get into that, the problem was as follows:
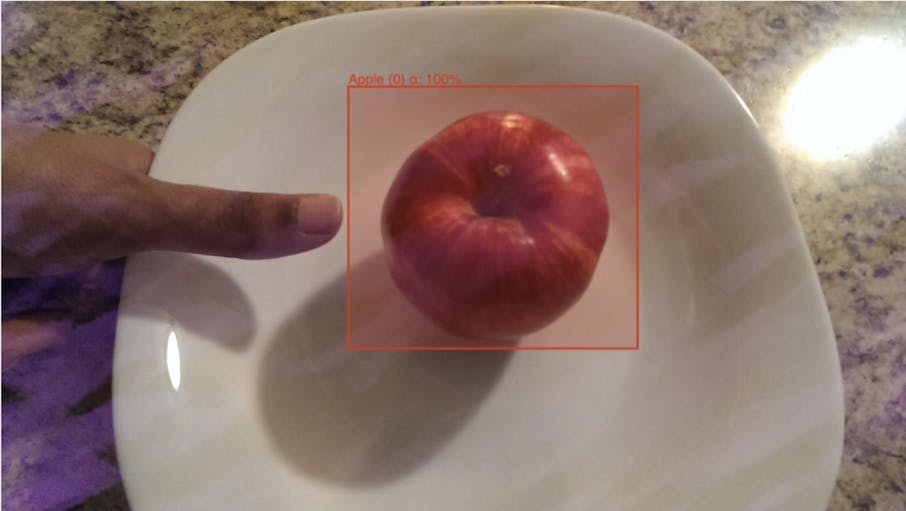
Company A wants to build a deep learning model that looks at a plate of food and quantifies the calorie count of that plate. They have an open source dataset that they want to use as a first step to identify individual ingredients on the plate. The dataset they want to use is labelled with an image level classification, but not with bounding boxes around the “food objects” themselves. Our goal is to re-label the dataset such that every frame has a correctly placed bounding box around each item of food.
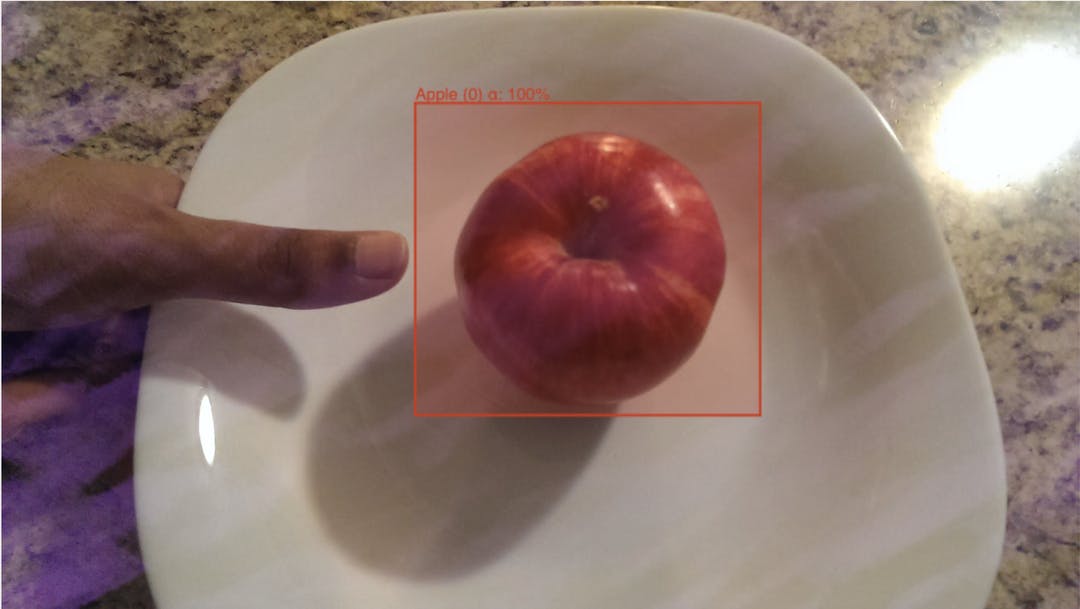
Example Food Item with Bounding Box
Instead of drawing these bounding boxes by hand we will label the data using algorithmic labelling.
Why Algorithmic Labelling?
So before we talk about solving this with algorithmic labelling, let’s look at our existing options to label this dataset. We can:
- go ahead and hand label it ourselves. It takes me about six seconds to draw a bounding box, and with ~3000 images, it will take me about five hours to label all the images manually.
- send the data elsewhere to be labeled. An estimated outsourced cost will likely be around $0.15 per image with total cost about $450. It will additionally take some time to write a spec and get a round trip of the data through to an external provider.
Big Data Jobs
If we look at the cost/time tradeoffs of algorithmic labelling against our first two options, it might not seem like a slam dunk. Writing a good program will take time, maybe initially even more time than you would be spending annotating the data yourself. But it comes with very important benefits:
- Once you have an algorithm working, it is both reusable for similar problems, and extensible to fit slightly altered problems.
- The initial temporal cost of writing a program is fixed, it does not increase with the amount of data you have. Writing a good label algorithm is thus scalable.
- Most importantly, writing label algorithms improves your final trained models. The data science process does not start once you have a labelled dataset, it starts once you have any data at all. Going through the process of thinking through an algorithm to label your data will give you insight into the data that you will be missing if you just send it to an external party to annotate.
With algorithmic labelling there is a strong positive externality of actually understanding the data through the program that you write. The time taken is fixed but the program, and your insight, exists forever.
With all this in mind, let’s think through a process we can use to write a program for this data. The high level steps will be
- Examine the dataset,
- Write and test a prototype
- Run the program out of sample and review
Examine the dataset
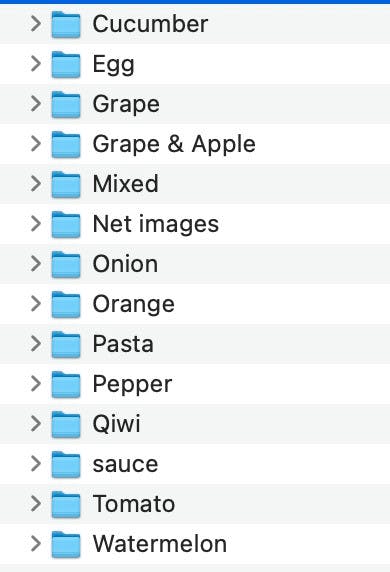
The first step to any data science process should be to get a look at the data and take an inventory of its organisational structure and common properties and invariants that it holds. This usually starts with the data’s directory structure:
We can also inspect the images themselves:
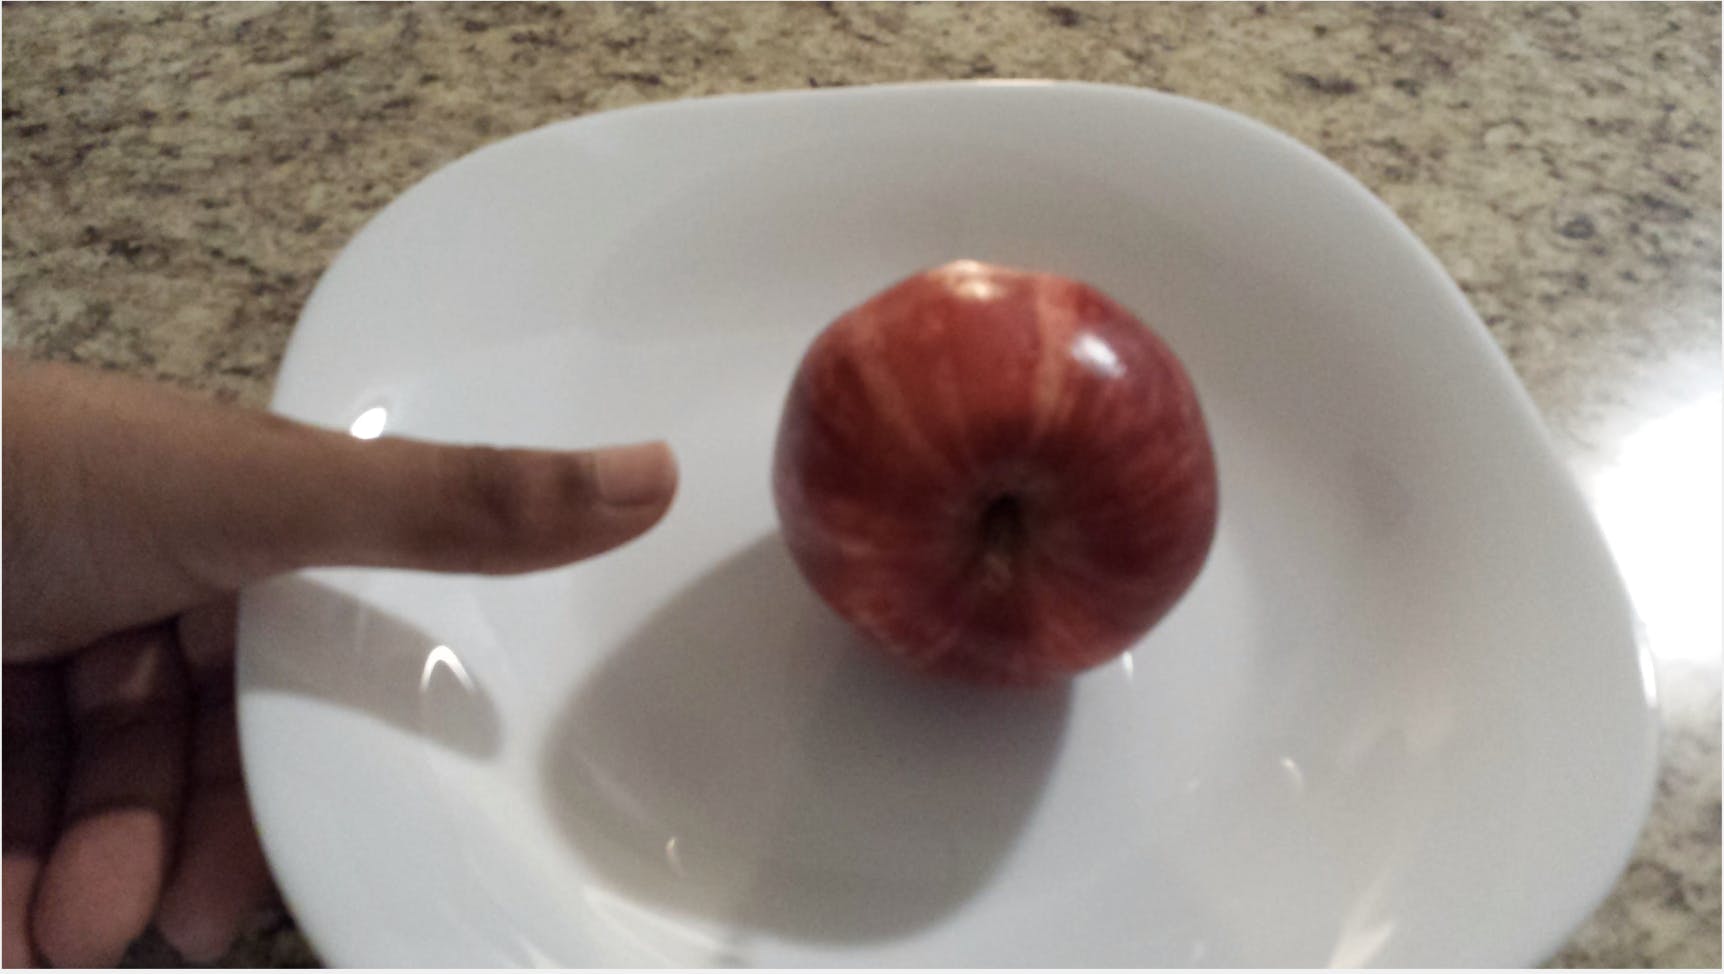
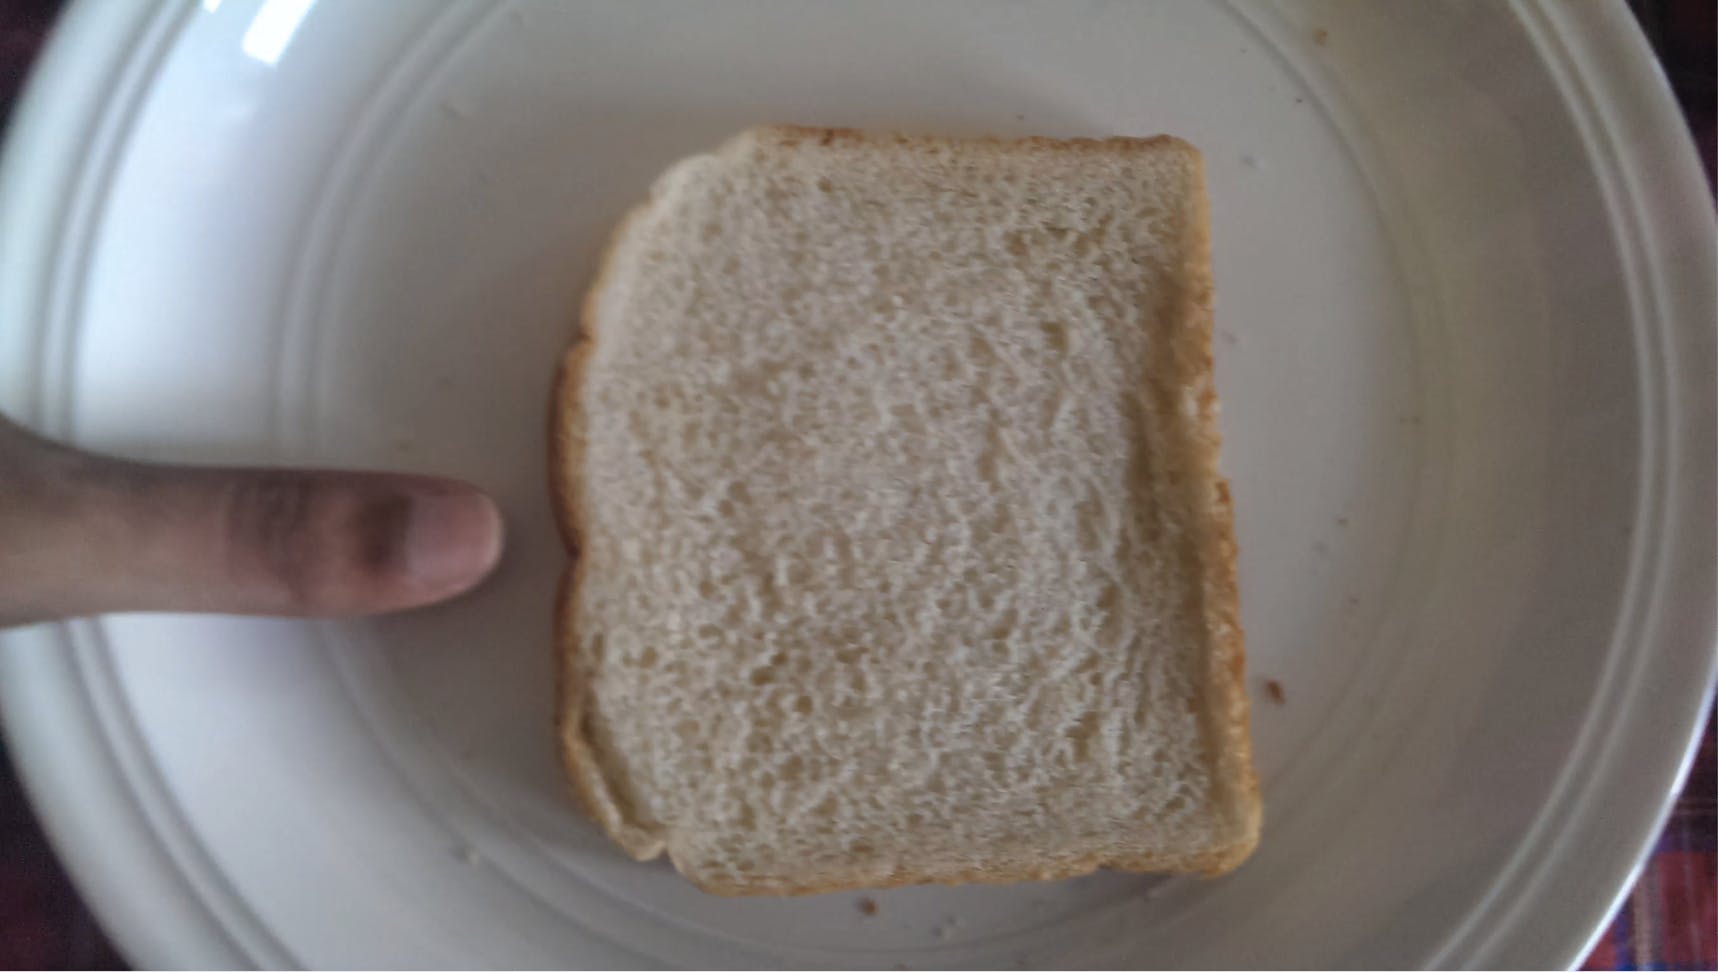
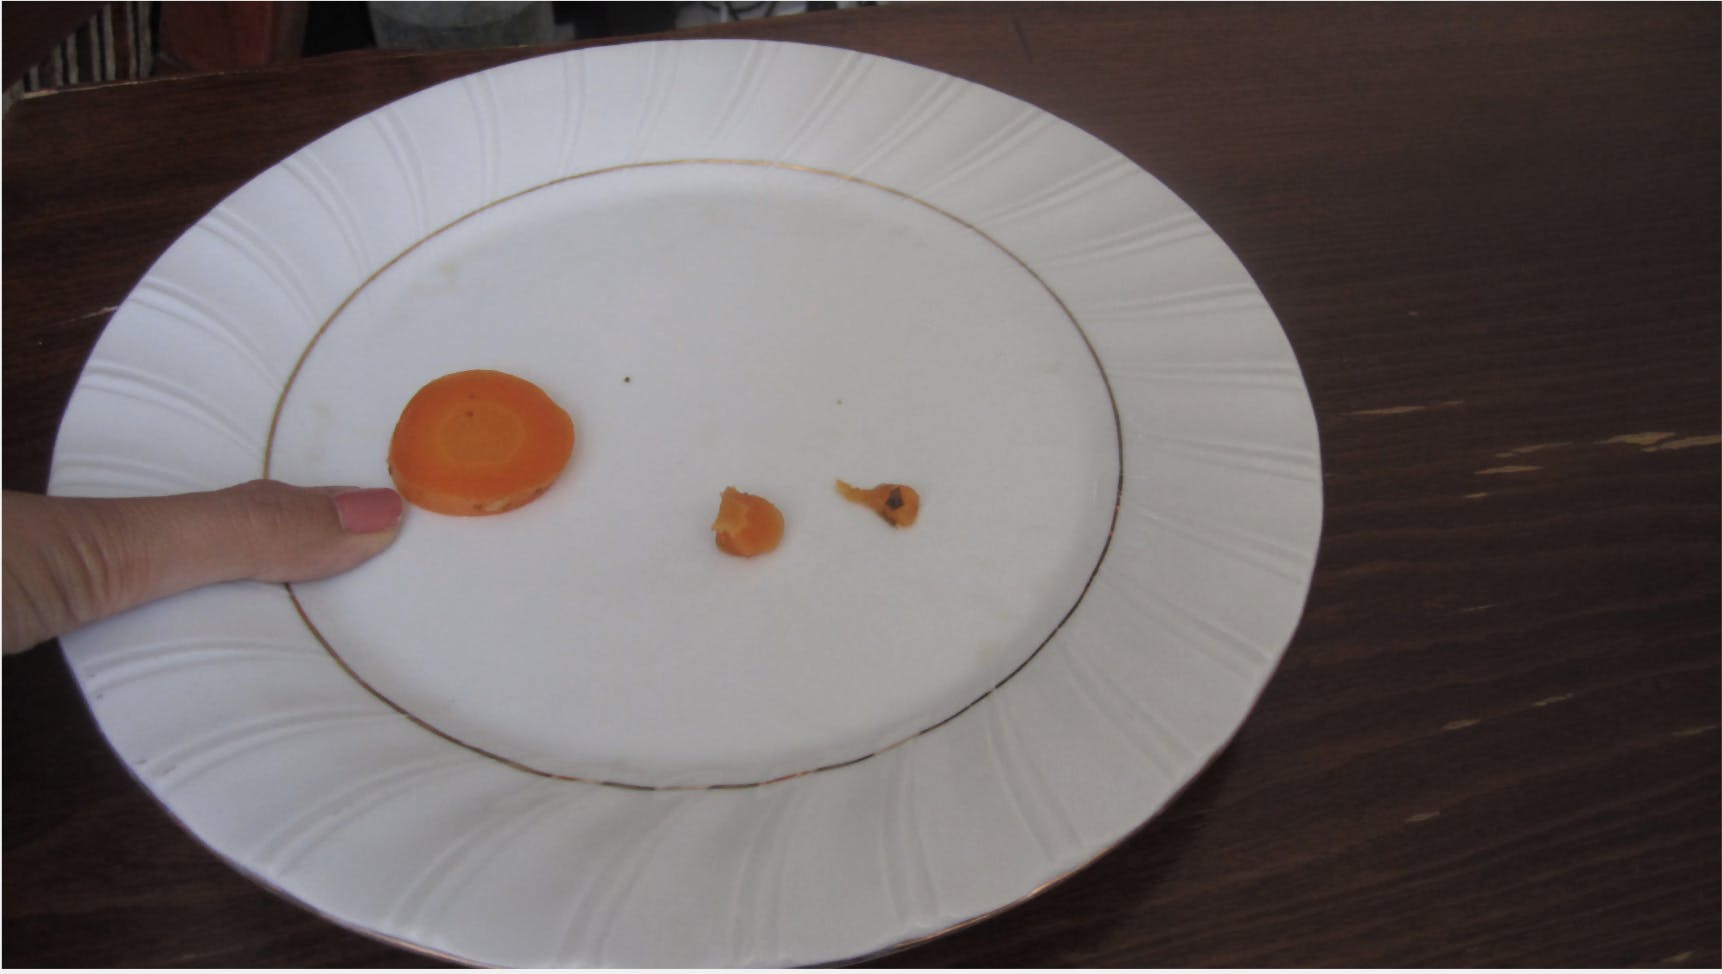
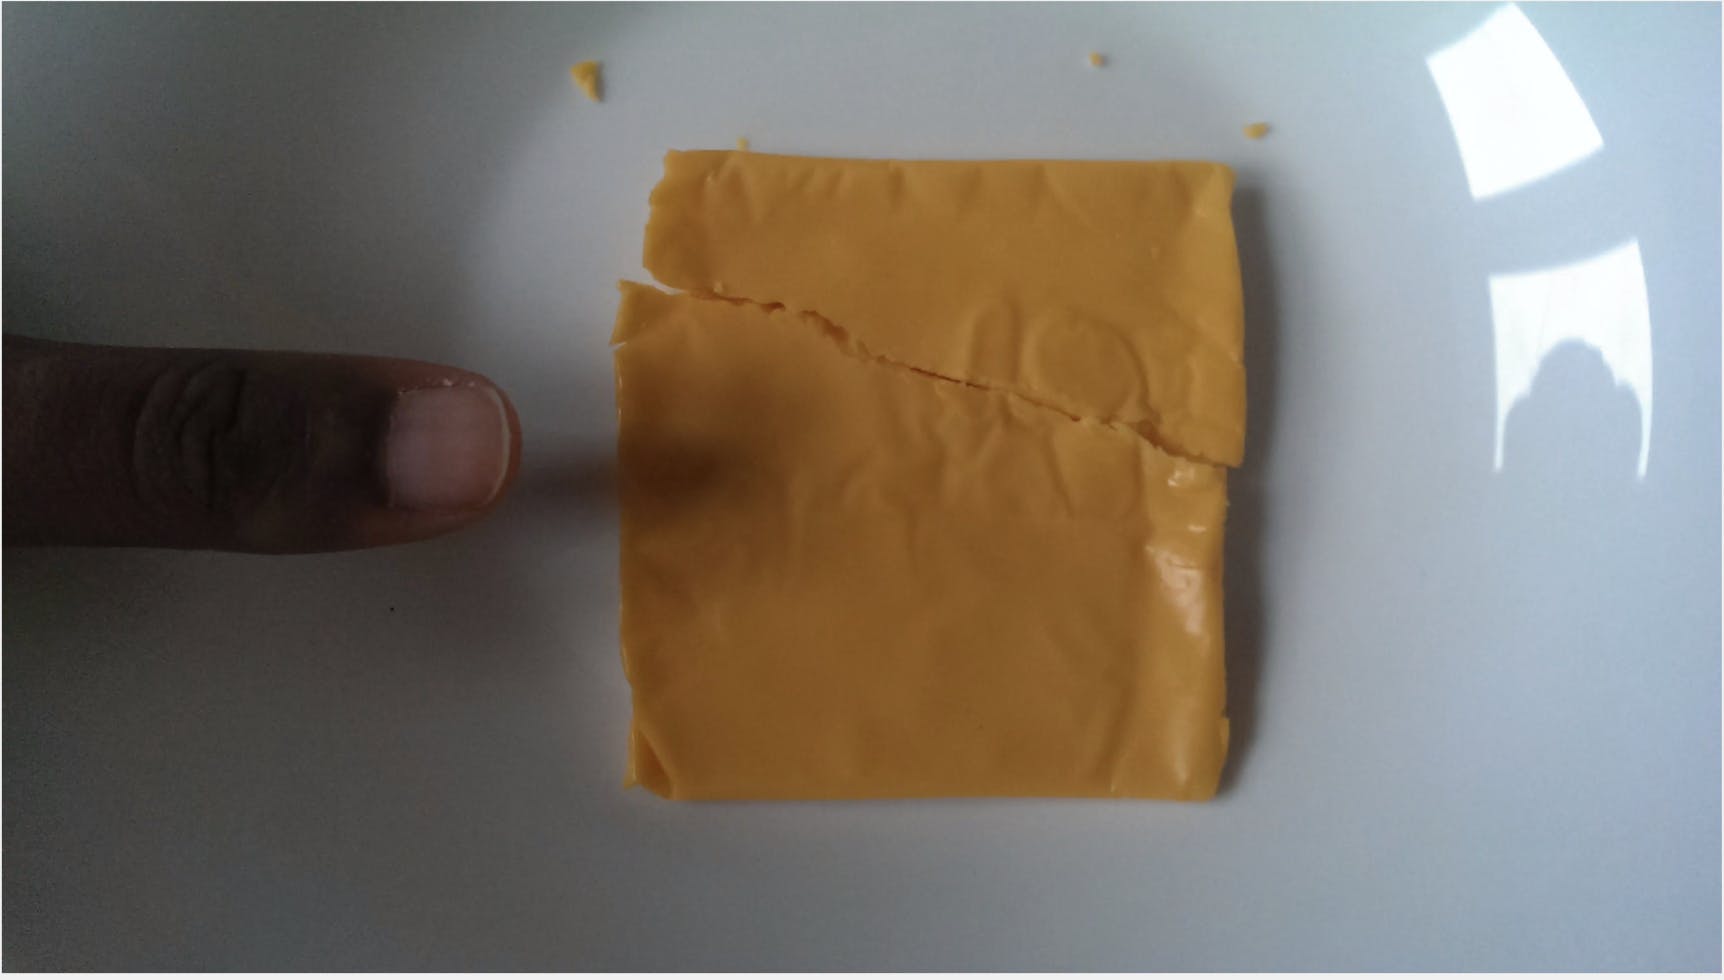
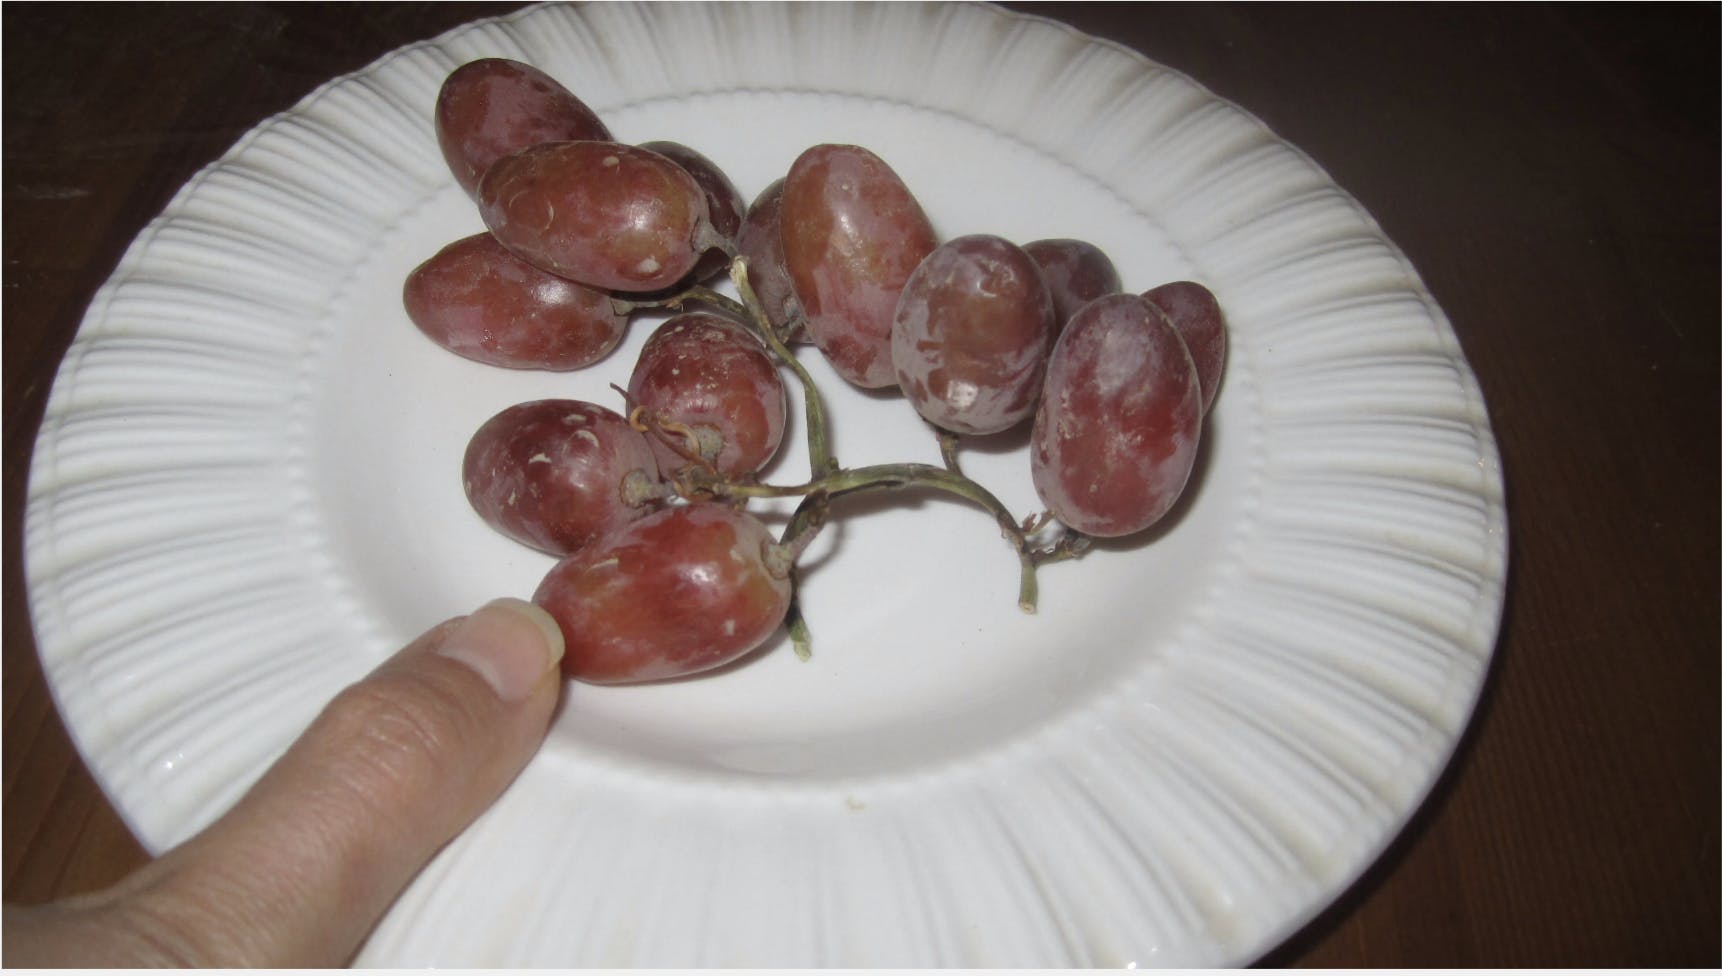
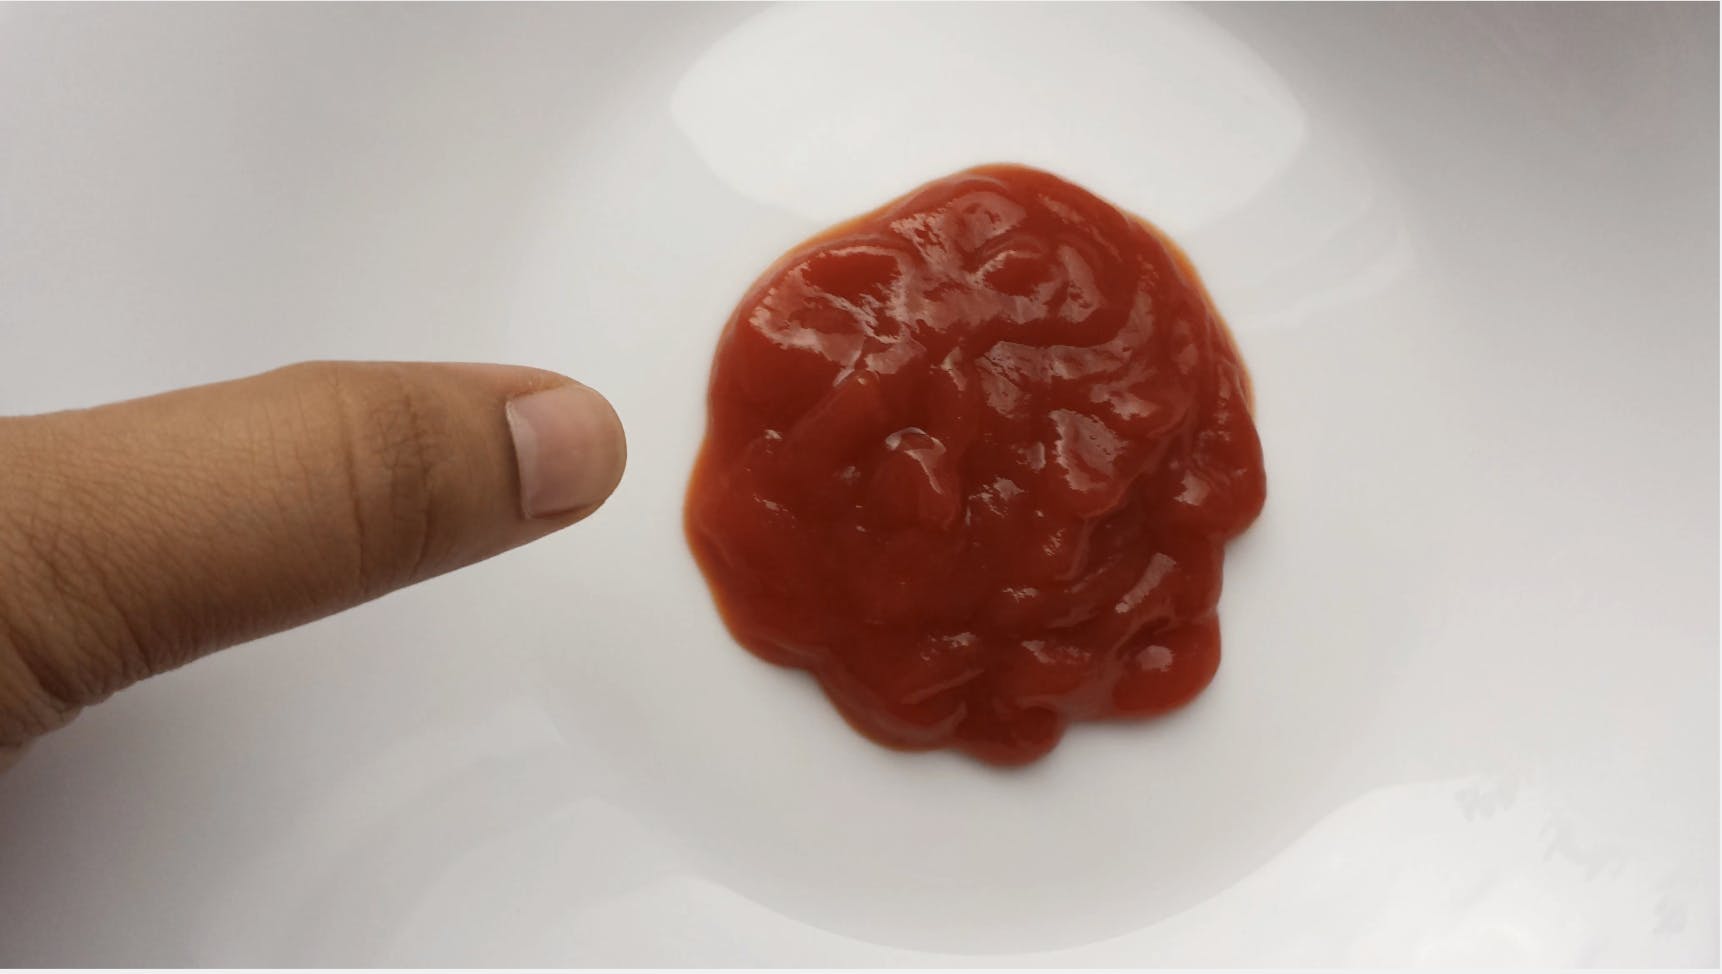
Sample images
Let’s go ahead and note down what we notice:
- The data is organised in groups of images of photographs of individual items of food on a plate.
- The title of each folder containing the images is the name of the piece of food that is being photographed
- There is only one piece of food per image and the food is the most prominent part of the image
- The food tends to be on average around the centre of the frame
- The colour of the food in most images stands out since the food is always on a white plate sitting on a non colourful table
- There is often a thumb in the picture that the photographers likely used for a sense of size scaling
There are some food items that look more challenging than others. The egg pictures, for instance, stand out because the colour profile is white on white. Maybe the same program shouldn’t be used for every piece of food.
The next step is to see if we can synthesise these observations into a prototype program.
Write a prototype
There are a few conclusions we can draw from our observations and a few educated guesses we can make in writing our prototype:
Definites
-We can use the title of the image groups to help us. We only need to worry about a particular item of food being in an image group if the title includes that food name. If we have a model for a particular item of food we can run it on all image groups with that title.
-There should only be one bounding box per frame and there should be a bounding box in every single frame. We can write a function that enforces this condition explicitly.
-We should add more hand annotations to the more “challenging” looking food items.
Educated Guesses
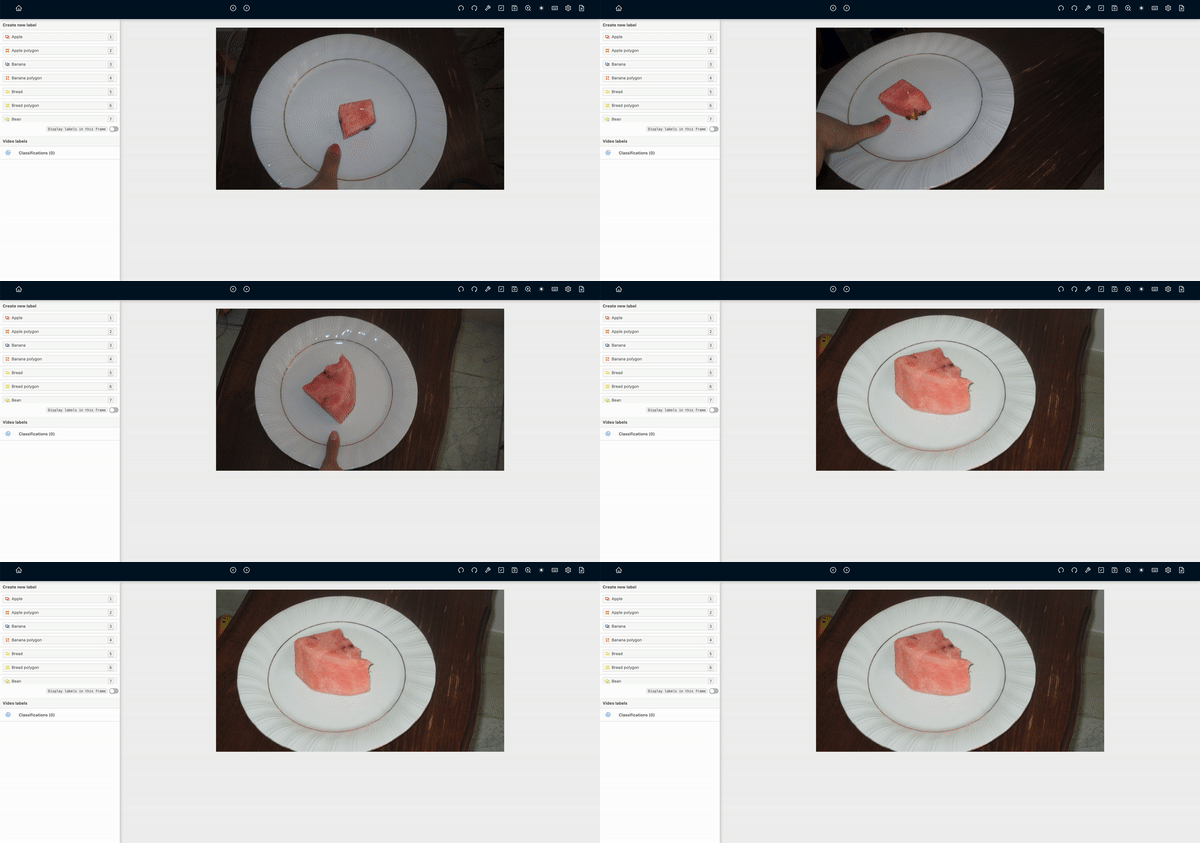
-Because the food location doesn’t jump too much from image to image, we might want to try an object tracker as a first pass to labelling each image group
-Food items are very well defined in each picture so a deep learning model will likely do very well on this data
-The colour contrasts within the pictures might make for good use of a semantic segmentation model
Let’s synthesise this together more rigorously into a prototype label algorithm. Our annotation strategy will be as follows:
- Use the Python SDK to access the API and upload the data onto the Encord annotation platform using the directory structure to guide us. We will use a Encord data function to concatenate the separate images into a video object so that we can also make use of object tracking
- Hand annotating two examples for a piece of food, one on the first image and one on halfway point image. For what we think are going to be trickier food items like eggs, we will try ten annotations instead of two.
- Run a CSRT object tracker across images. Again this dataset is not a video dataset, but with only one object per image that is around the same place in each frame, an object tracking algorithm could serve as a decent first approximation of the labels.
- Train a machine learning model with transfer learning for each item of food using tracker-generated labels. We can start with a segmentation model. The objects have a stark contrast to the background. Training a model with the noisy labels plus the stark contours might be enough to get a good result. We already converted our bounding boxes to polygons in the previous step, so now the Encord client can train a segmentation model.
- Run the model on all image groupings with that piece of food in the title. Convert the polygonal predictions back to bounding boxes and ensure that there is only box per image by taking the highest confidence prediction.
That’s it.The data function library and full SDK are still in private beta, but if you wish to try it for yourself sign up here.
Let’s now run the program on some sample data. We will choose bananas for the test:
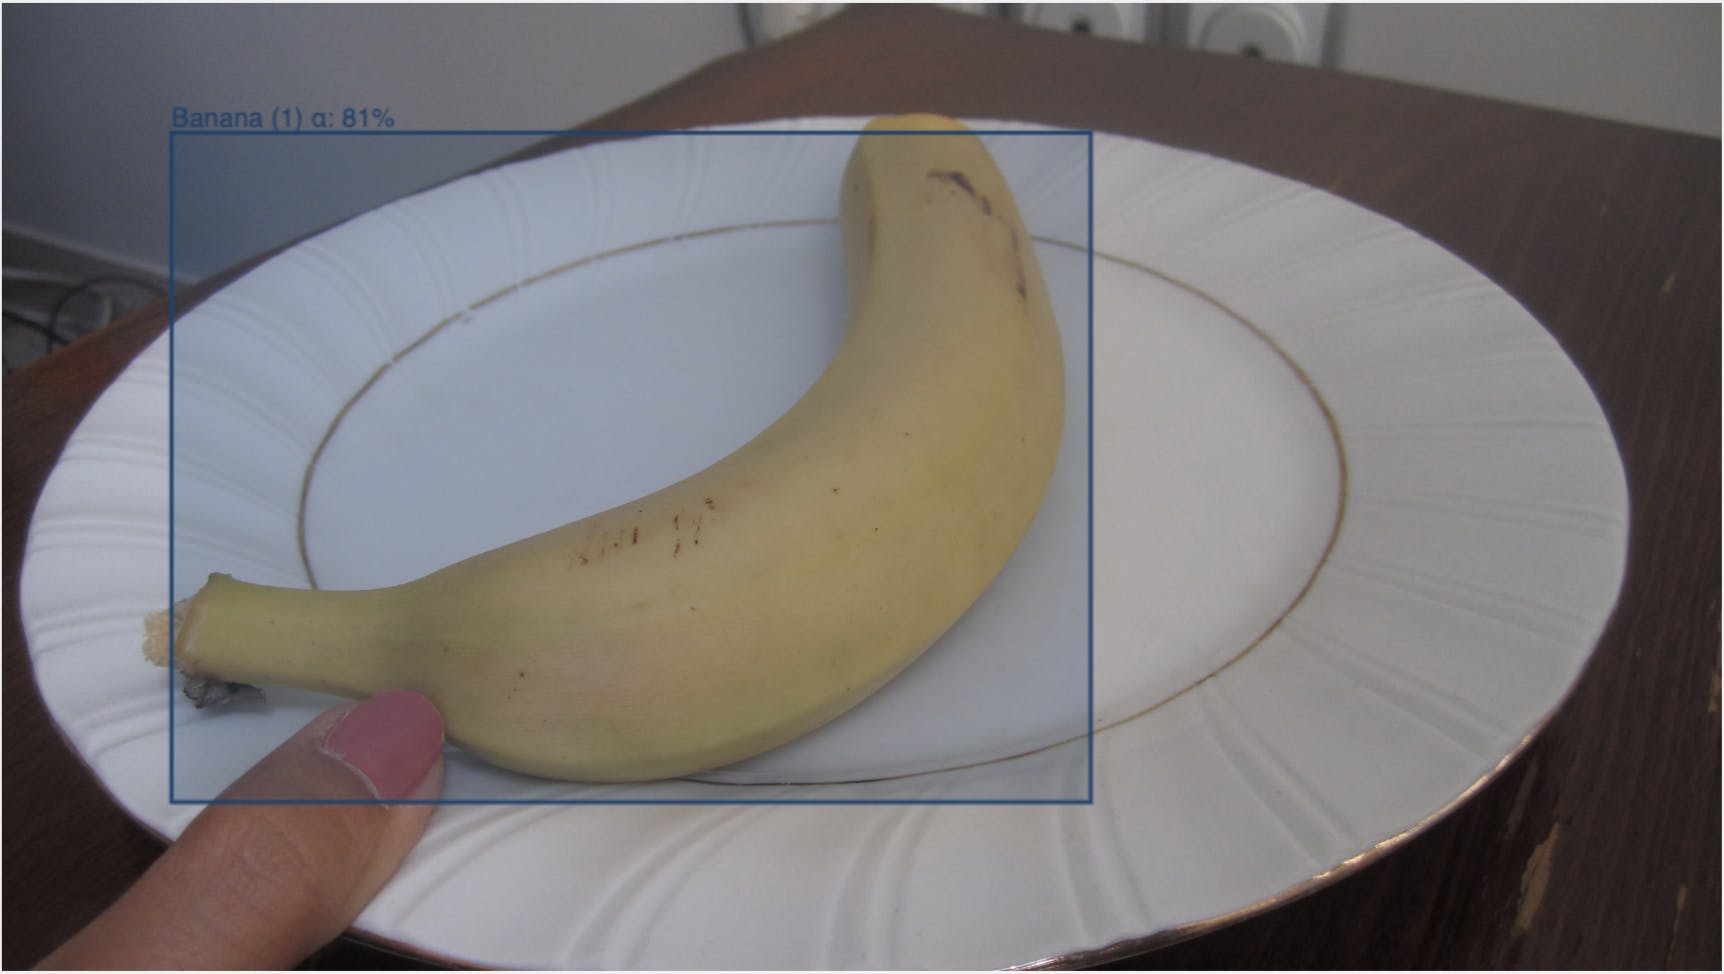
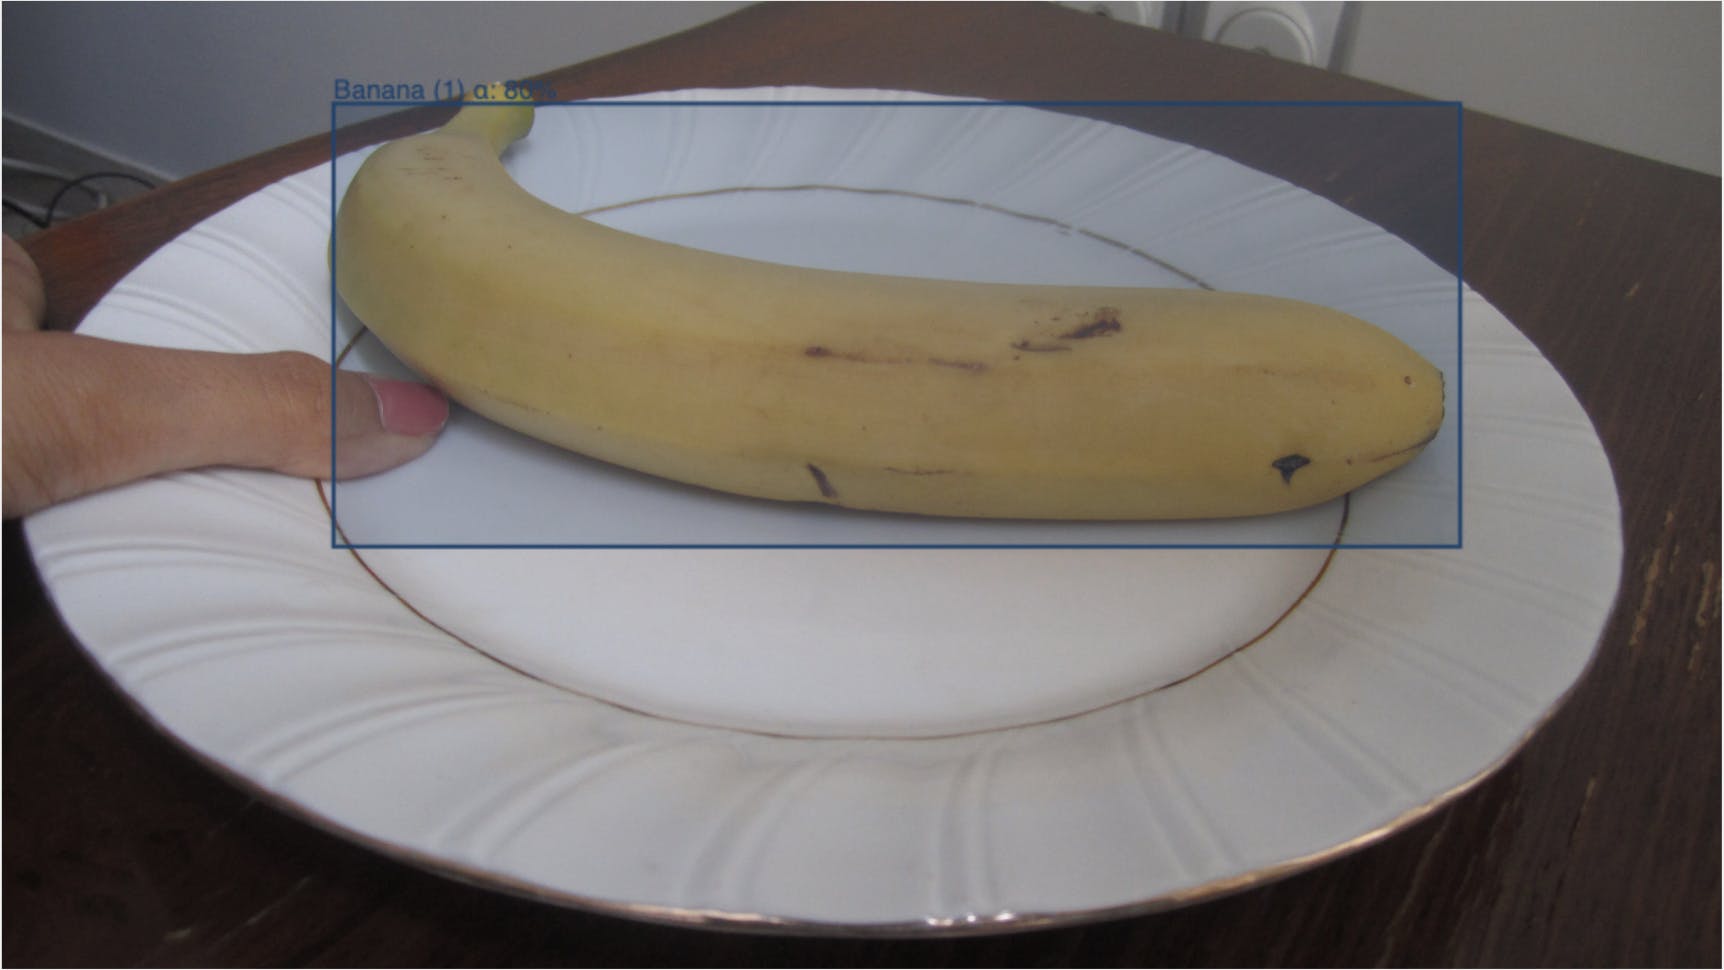
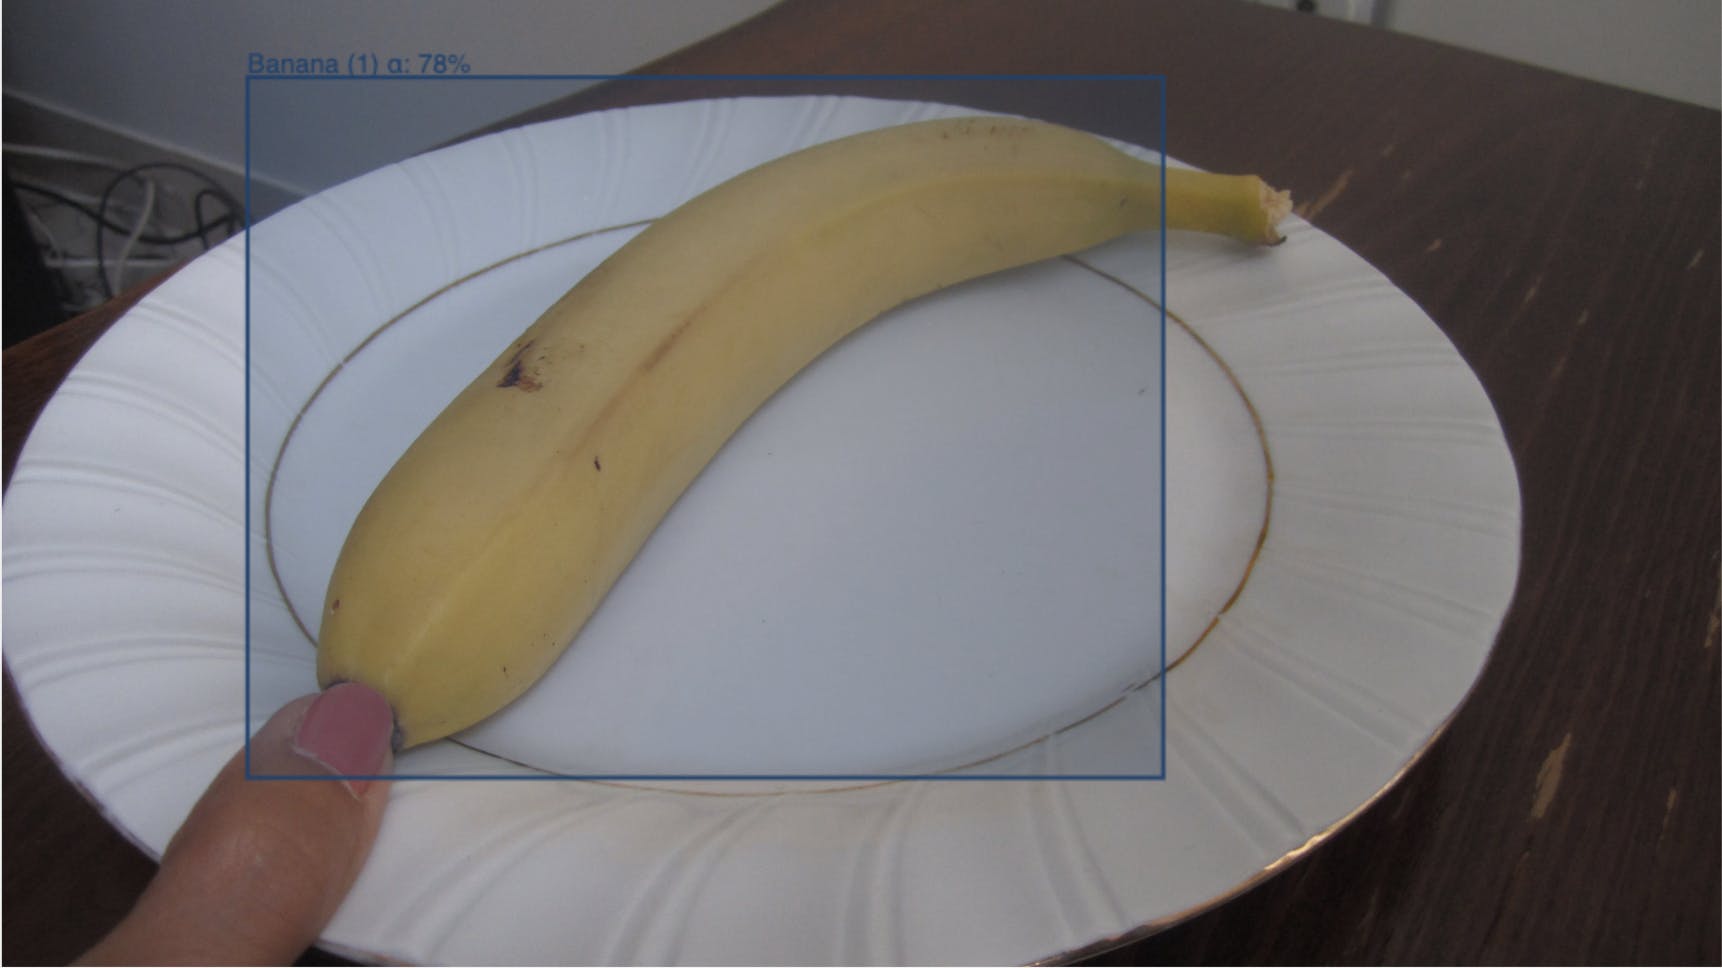
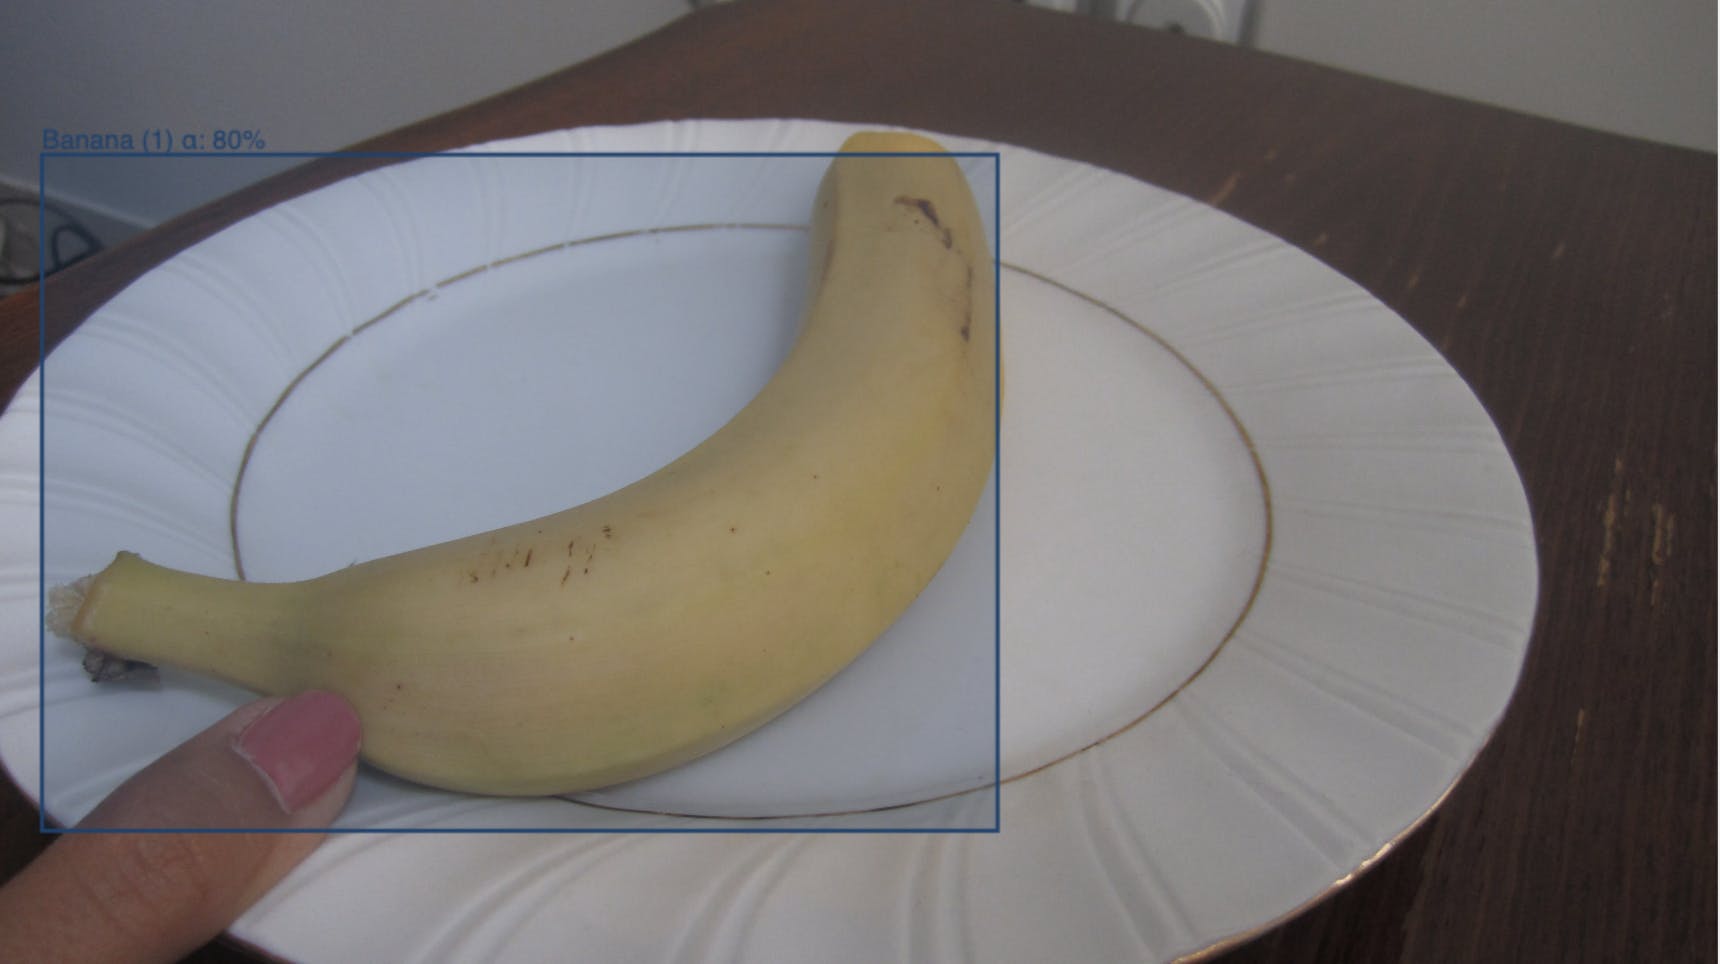
It seems to do a relatively good job getting the bounding boxes.
Run the algorithm “out of sample” and review
Now that we have a functioning algorithm, we can scale it to the remaining dataset. First let’s go through and annotate the few frames we need. We will add more frames for the more difficult items such as eggs. Overall we only hand annotate 90 images out of 3000.We can now run the program and wait for the results to come back with all the labels. Let’s review the individual labels.
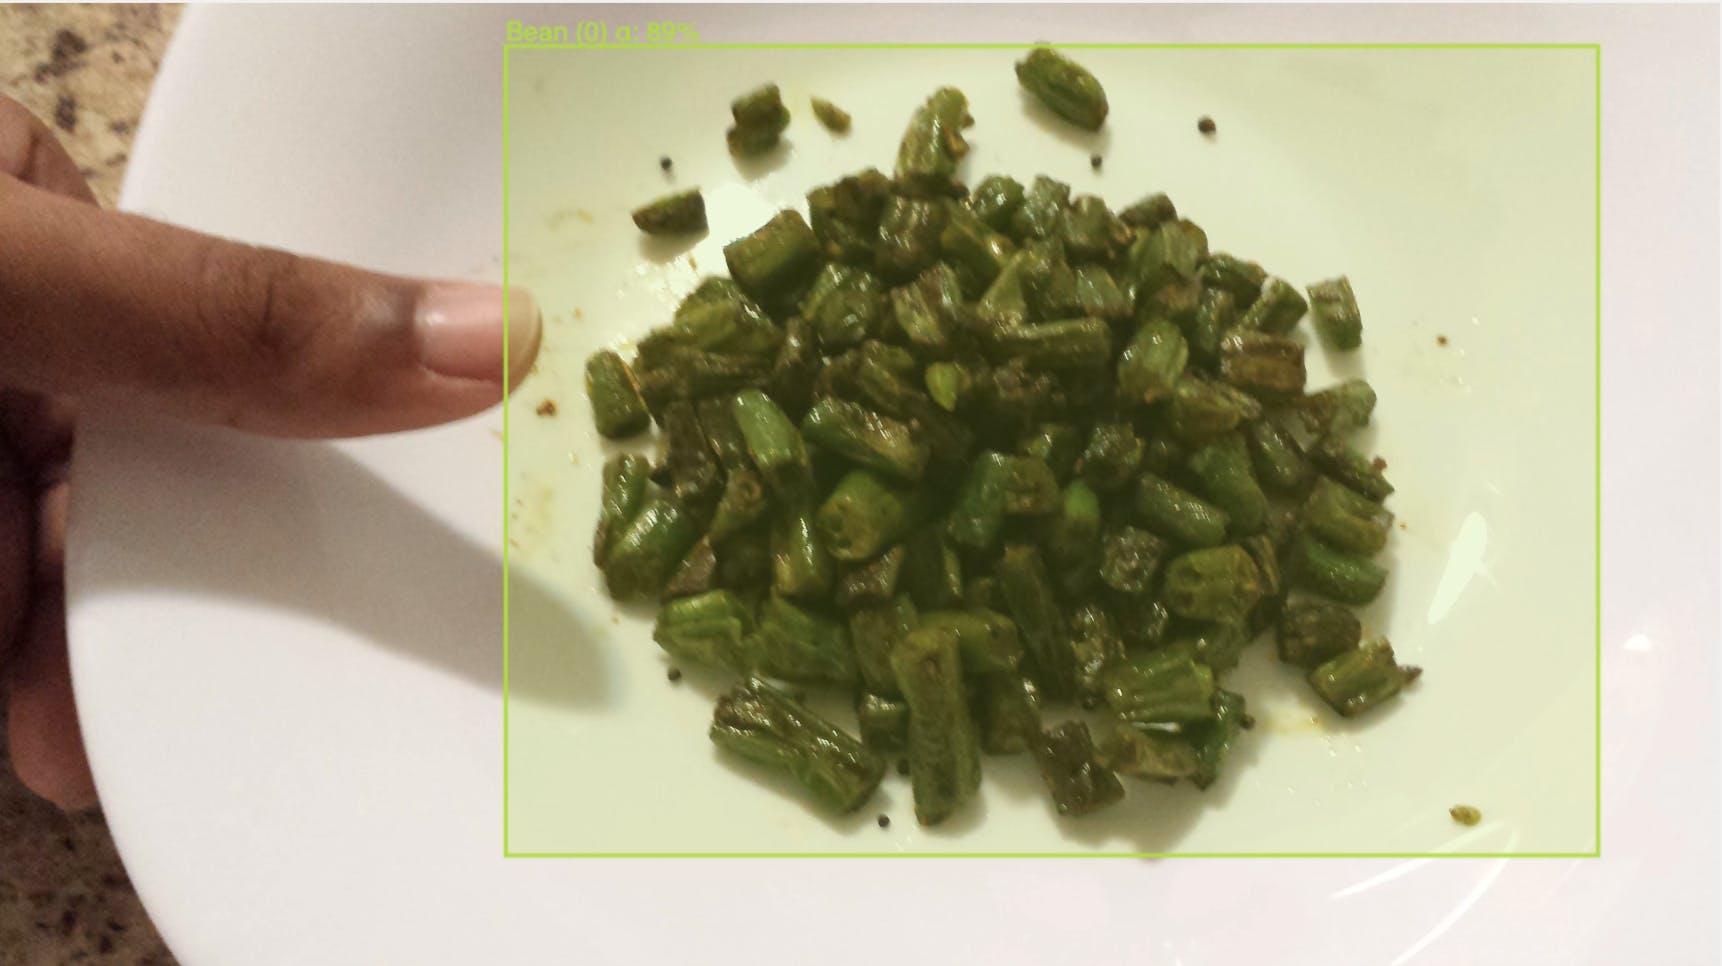
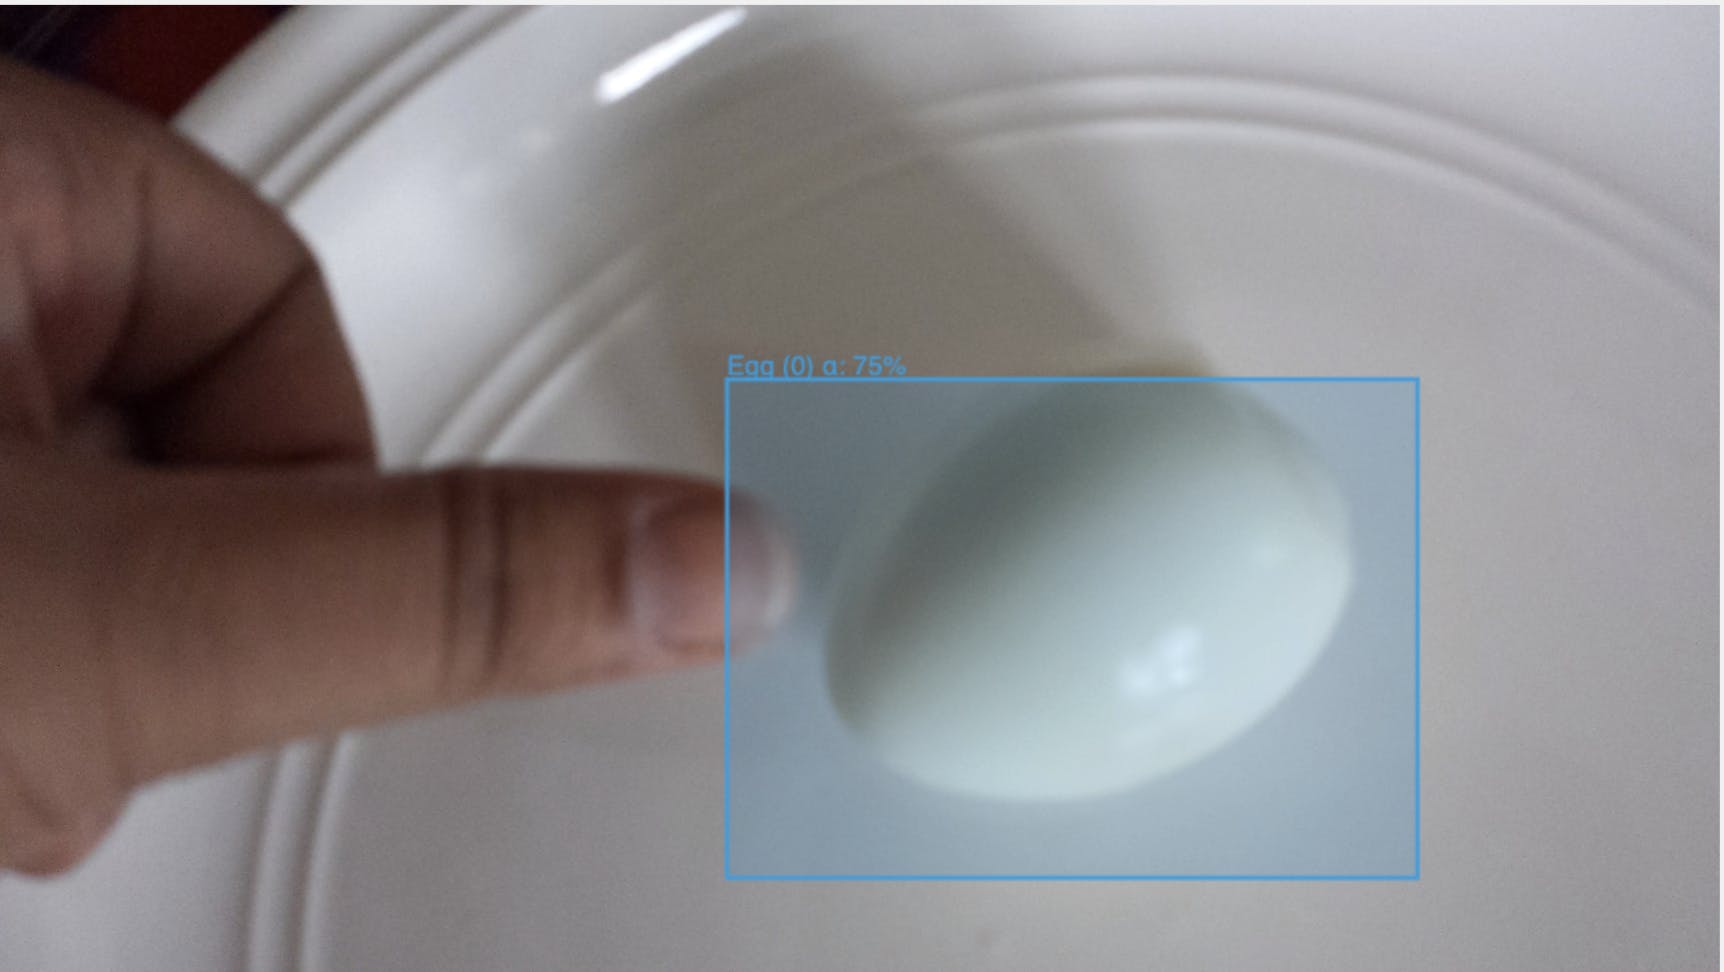
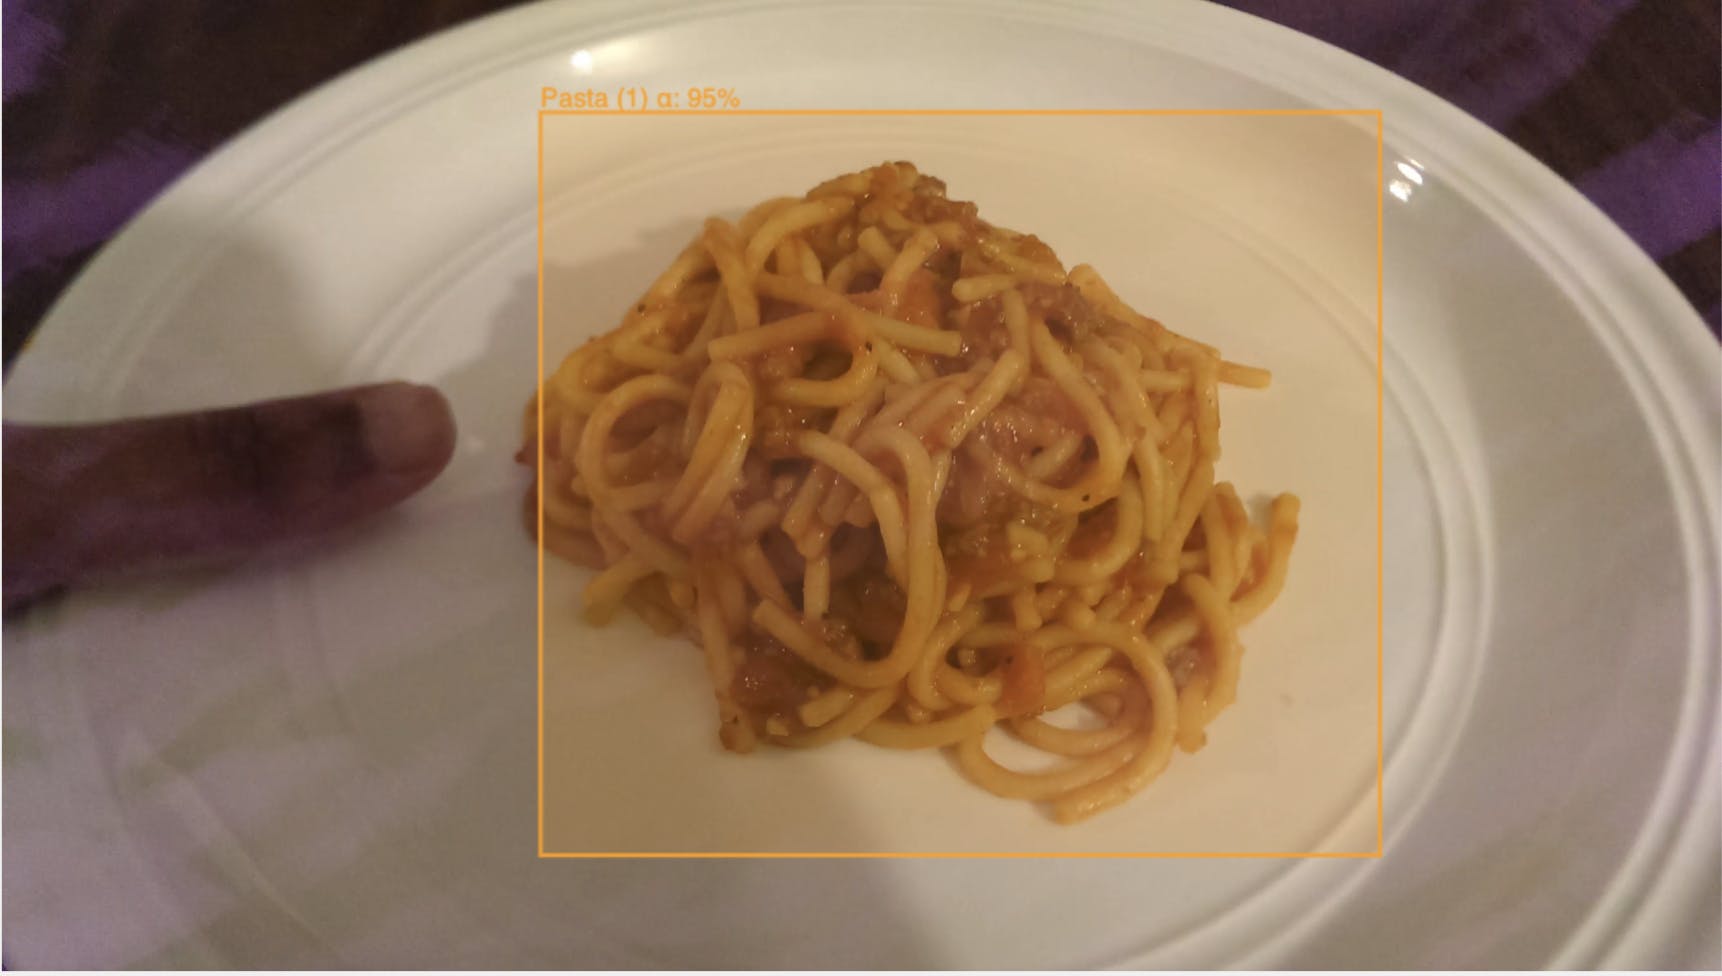
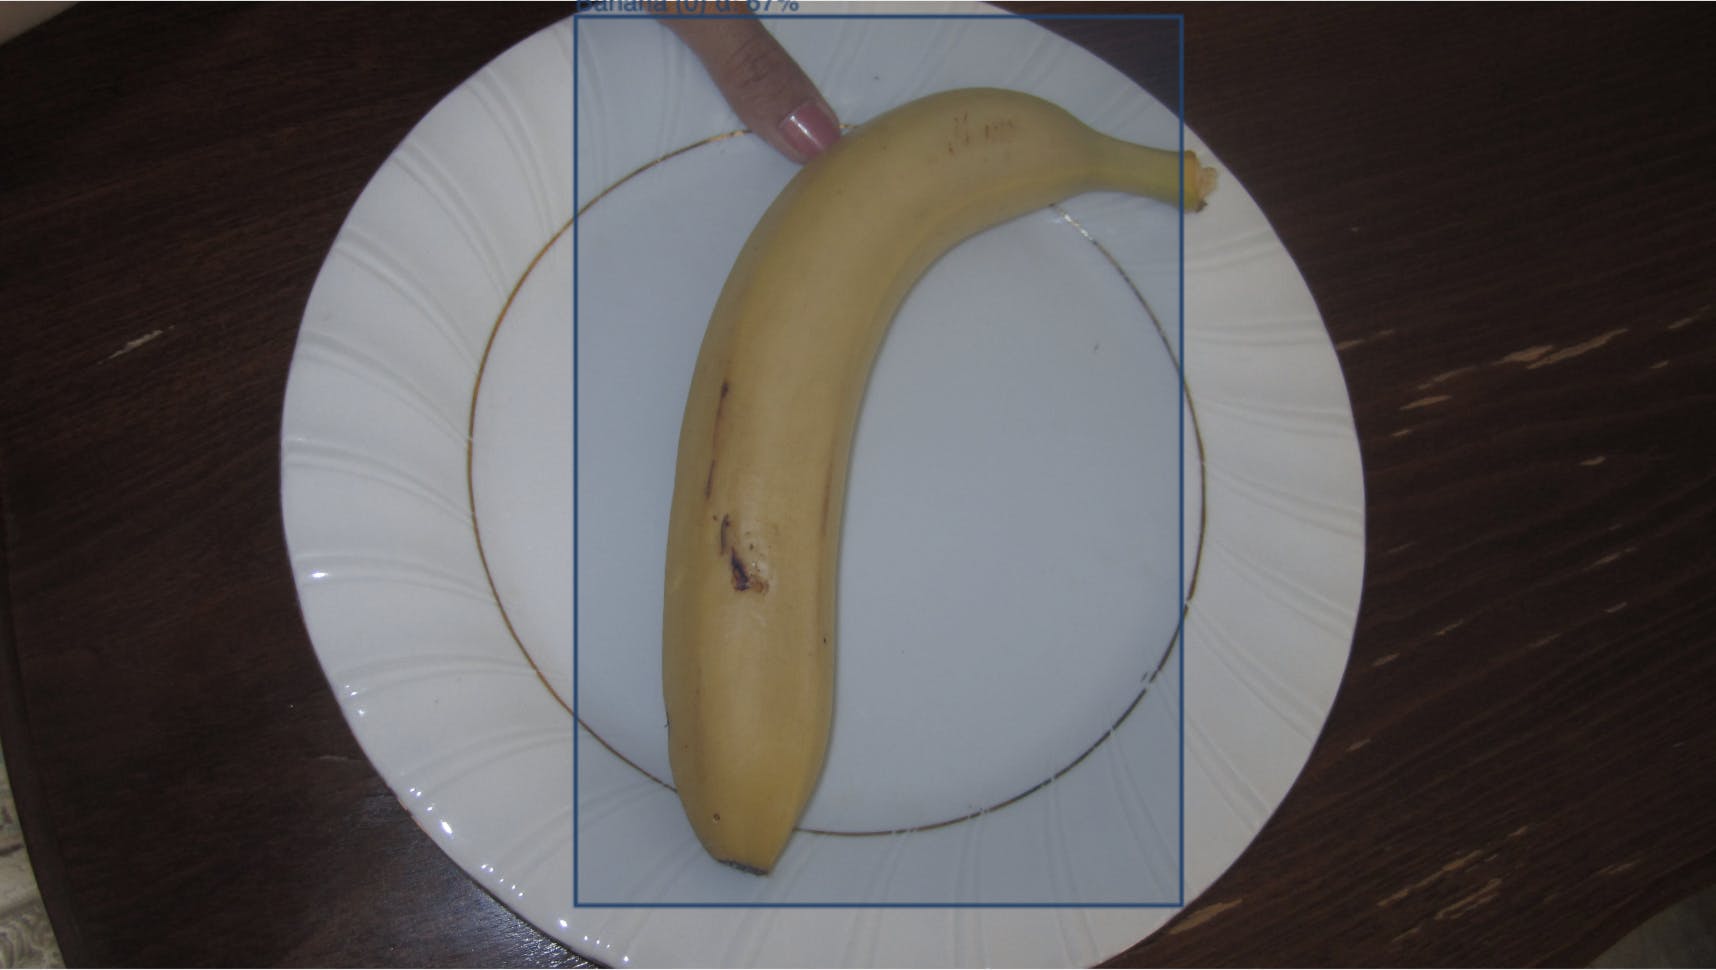
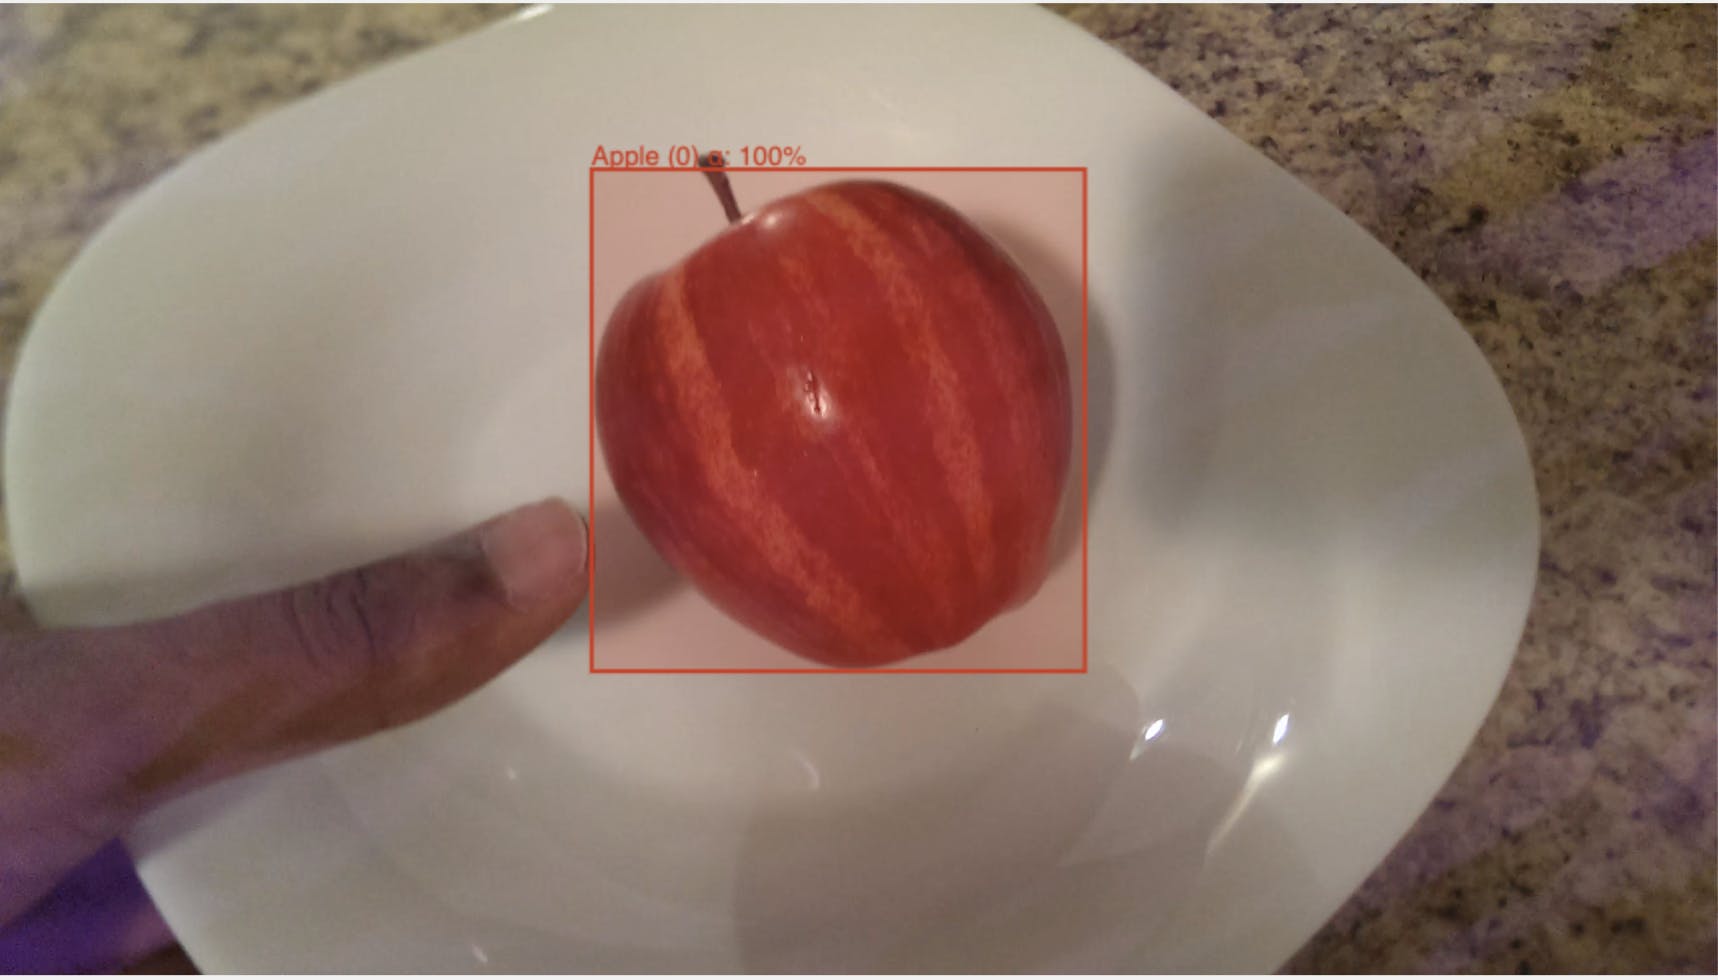
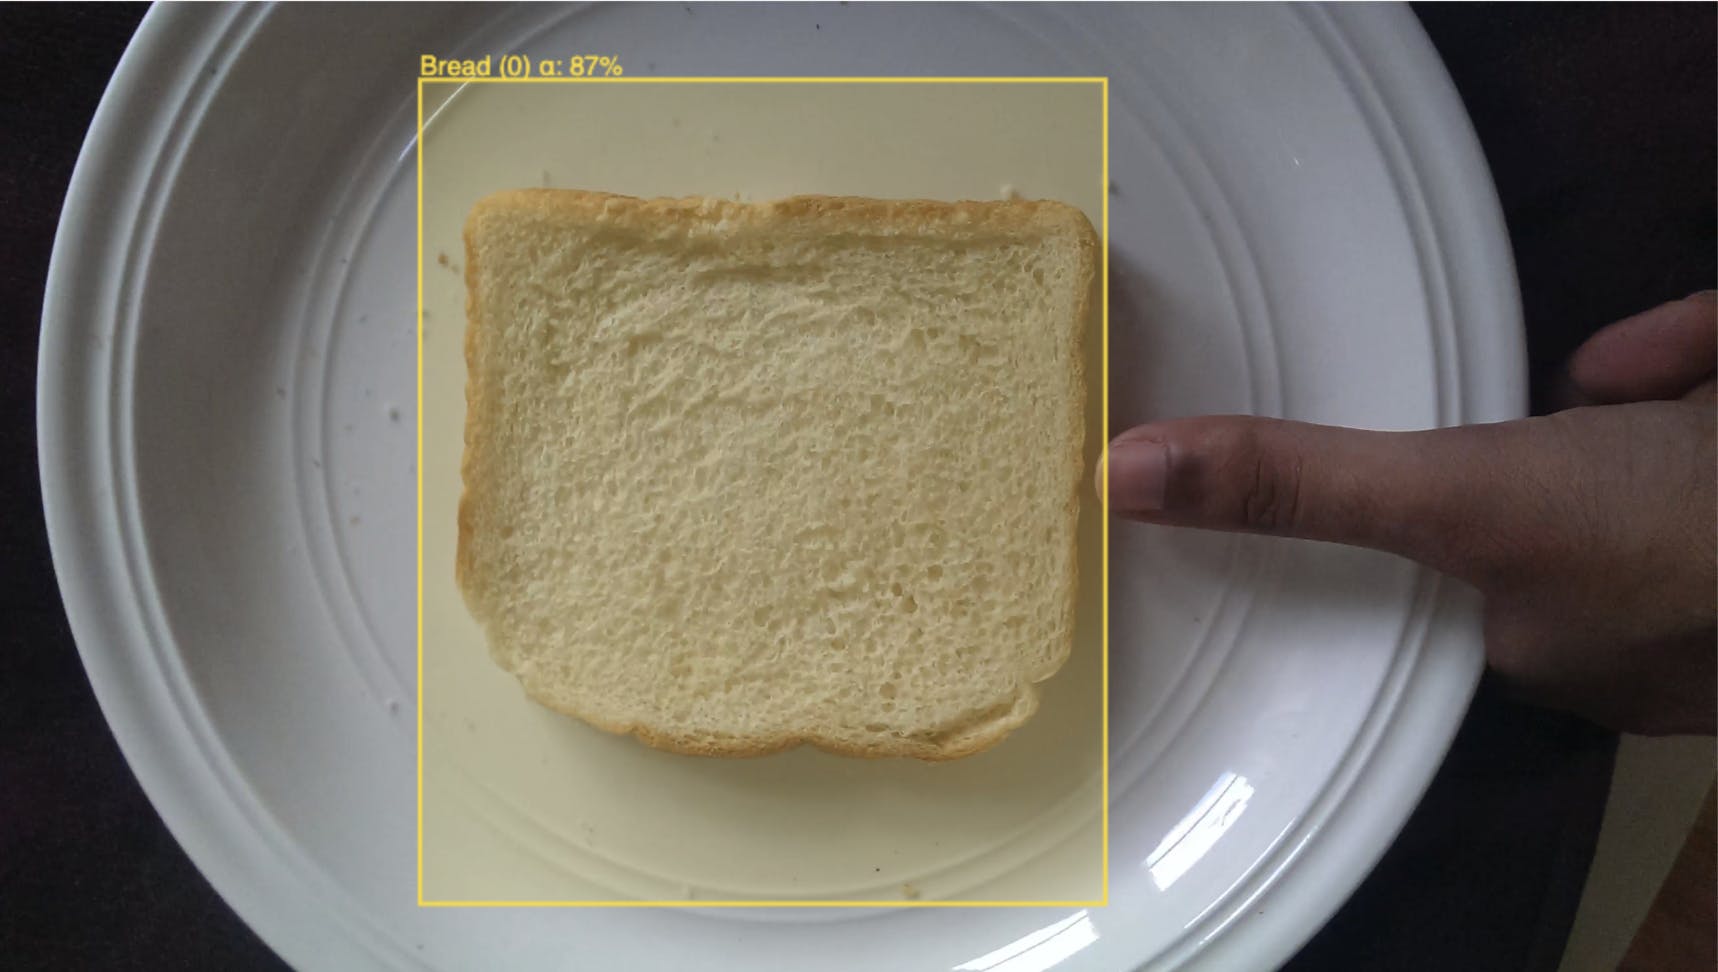
We can see for the most part it’s done a very good job.
The failure modes are also interesting here because we get a “first-look” of where our eventual downstream model might have trouble.
For these “failures” I can go through and count the total number that I need to hand correct. That’s only 50 hand corrections in the entire dataset. Overall, the label algorithm requires less than 5% of hand labels to get everything working.
And that’s the entire process. We made some relatively simply observations about the data and converted those into automating labelling of 95% of the data.
We can now use the labelled dataset to build our desired calorie model, but critically, we can also use many of the ideas we had in the algorithmic labelling process to help us as well.
- Real world examples are always better than concocted examples in that they are messy, complex, and require hands-on practical solutions. In that vein, you exercise a different set of problem-solving muscles than would normally not be used in concocted examples with nice closed formed type solutions.
Explore the platform
Data infrastructure for multimodal AI
Explore product
Explore our products
Encord streamlines the annotation process by providing options for both internal and external annotators, ensuring high-quality labeling. The platform allows for tailored solutions based on the specific dataset and geographical context, which is particularly important for accurately annotating culturally distinct data, such as traffic signs in different countries.
Encord provides a comprehensive annotation platform equipped with various annotation tools tailored to different use cases. This includes both in-house annotation capabilities as well as a dedicated annotation service to ensure that datasets are accurately labeled, enhancing the quality of training data for machine learning models.
Yes, Encord is designed to manage both production-level annotations and data collection, providing a flexible solution for teams. While it excels in real-time annotations for immediate use, it can also be integrated into broader data workflows for comprehensive data management and quality assurance.
Yes, Encord is equipped to handle complex annotation tasks that involve multiple data sources and formats. The platform is built to manage diverse datasets effectively, ensuring that teams can annotate data from various factories and machines without compromising on quality.
Encord includes a comprehensive suite of data labeling tools designed to support various AI projects. These tools enable users to annotate data efficiently, ensuring high-quality input for training machine learning models, which is crucial for enhancing robotics performance.
Encord's annotation software is designed to facilitate easy review and adjustments, especially for ambiguous data scenarios, such as distinguishing between multiple similar items. This can be particularly beneficial for industries with non-standardized data.
Encord streamlines the data annotation process by allowing users to easily send data for labeling. The platform supports both internal and external annotators, ensuring a seamless workflow for getting annotated data back for further analysis and training.
Encord allows users to define custom labeling schemas through its ontology feature. This enables teams to create tailored labeling processes that meet their specific project requirements, improving the accuracy and relevance of the annotations.
Absolutely. Encord's active platform allows users to analyze both labeled and unlabeled data. This flexibility enables users to calculate metrics on raw data or review auto-generated labels before prioritizing them for human review.
Typically, classes are defined before annotators begin their work to ensure uniformity in labeling. Therefore, labels or classes are usually fixed to maintain a consistent distribution of data.
