Smart city computer vision: A practical guide to training data

Head of Forward Deployed Engineering at Encord
TL;DR: Smart city computer vision powers everything from AI traffic management to pedestrian detection and infrastructure monitoring, but most teams underestimate what the training data actually involves. Real-world urban datasets are noisy, geographically inconsistent, and expensive to annotate. This guide breaks down what smart city training data looks like, why it's uniquely difficult to build, and how to make better decisions when scoping and managing it at scale.
Cities have never been more instrumented. Fixed cameras, mobile survey vehicles, drone feeds, traffic sensors, and modern urban infrastructure generate more visual data per day than most research labs see in a year. And yet, deploying computer vision that actually works in a smart city remains one of the hardest data engineering challenges in applied AI.
The gap isn't in the models. YOLO variants, transformer-based detectors, and multi-object tracking architectures have matured significantly. The gap is in the training data: how it's collected, what it needs to contain, how it's annotated, and how you build pipelines that can handle the sheer variability of urban environments at scale.
This guide is about that gap. Whether you're building systems for AI traffic management, pedestrian safety monitoring, road infrastructure assessment, or anomaly detection in public spaces, the decisions you make about training data will determine whether your model performs in production or fails the moment conditions change.
What does computer vision actually do in a smart city?
Computer vision gives cities a way to interpret what their cameras actually see, turning raw video feeds into structured, actionable data. Here's where it's being applied today:
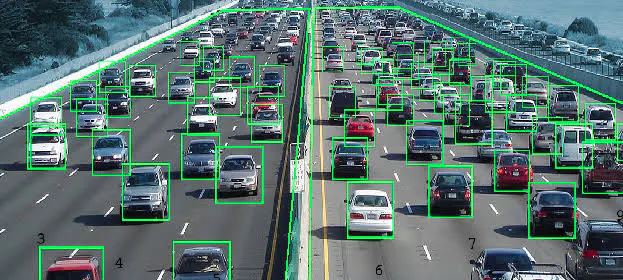
1. AI traffic management
- Detects and classifies vehicles across dozens of categories: cars, buses, trucks, cyclists
- Tracks movement across frames to measure flow, speed, and trajectory
- Identifies incidents, sudden stops, lane violations, collision precursors, in real time
- Feeds signal optimization systems to reduce congestion and cut emissions
- Training data need: dense multi-frame video sequences with trajectory labels, event annotations, and coverage across time-of-day and weather conditions
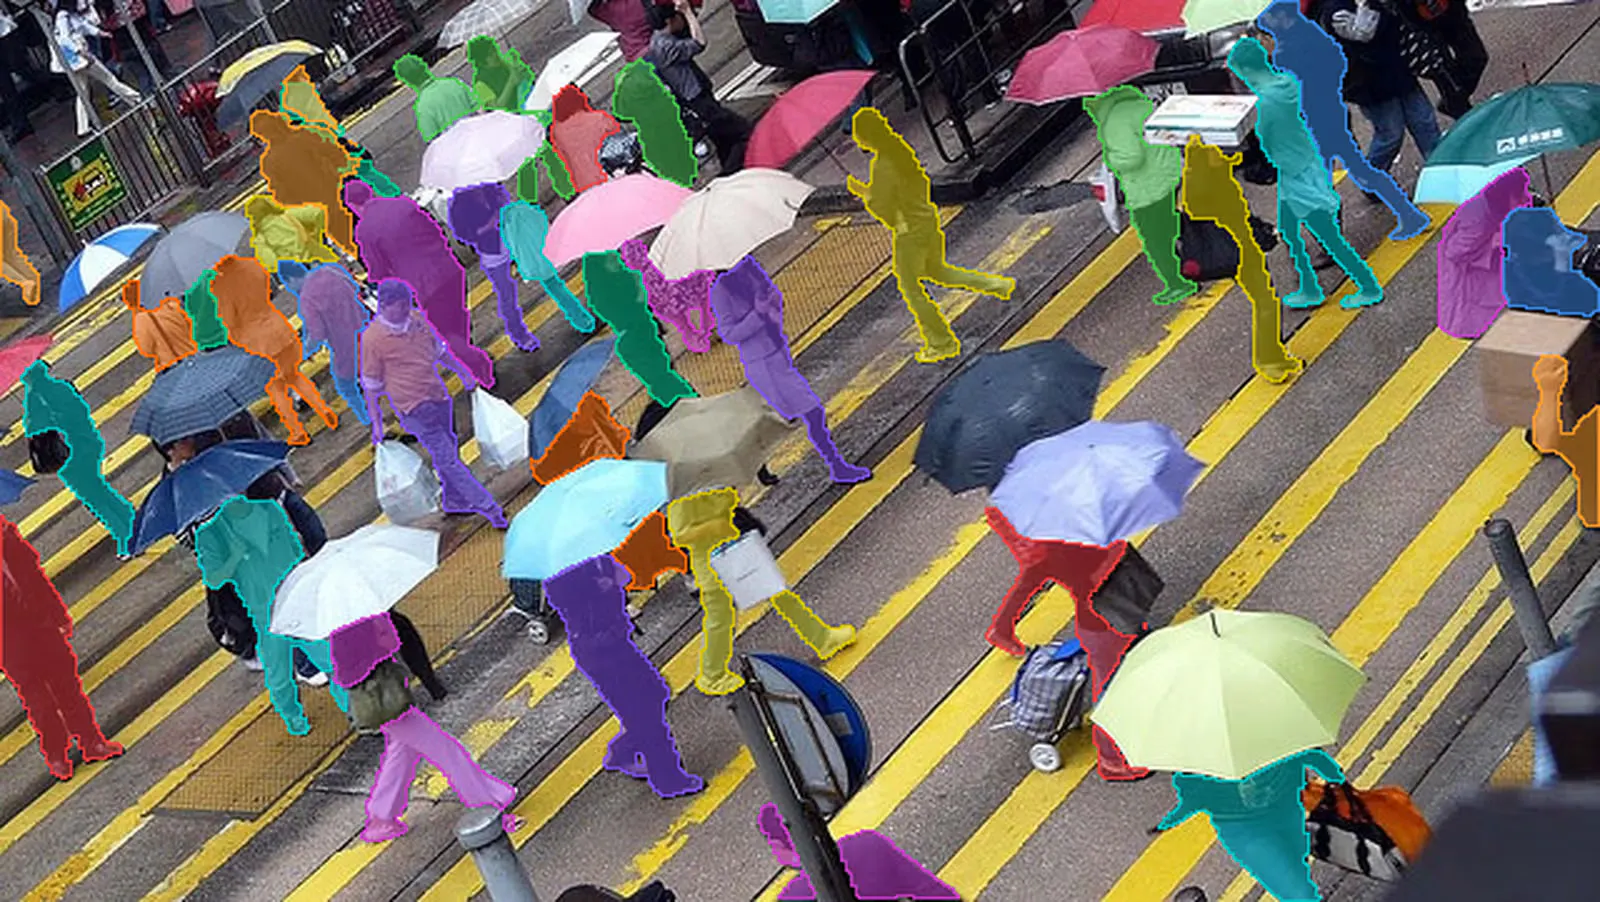
2. Pedestrian detection and public safety
- Monitors crosswalks for near-miss events between pedestrians and vehicles
- Estimates crowd density in transit hubs, event venues, and public squares
- Detects unsafe behavior , jaywalking, crowd surges, erratic movement
- Supports nighttime safety monitoring in poorly lit areas
- Training data need: diverse annotations across occlusion states, lighting conditions, crowd densities, and pedestrian sizes , not just clean, well-lit, spaced-out examples
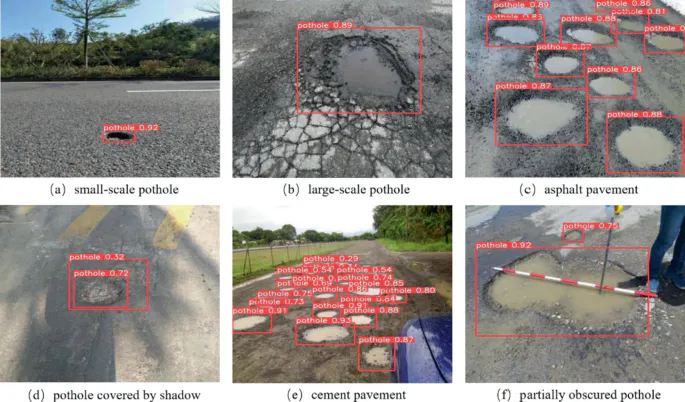
3. Infrastructure monitoring
- Classifies road surface defects: potholes, cracks, surface degradation
- Inventories traffic signs, markings, and utility assets from moving vehicles
- Flags maintenance needs before they become safety hazards
- Training data need: fine-grained classification labels, high-resolution imagery, and geographic diversity , road standards and sign conventions vary significantly by region
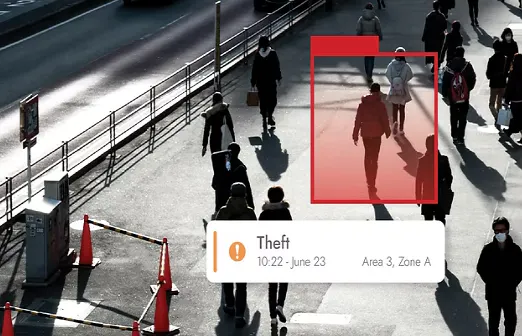
4. Anomaly detection and event recognition
- Flags abandoned objects in airports, transit stations, and public spaces
- Detects physical altercations, vandalism, and unusual crowd behavior
- Identifies structural anomalies in infrastructure assets
- Training data need: deliberately curated anomaly examples , rare events don't appear naturally in passive data collection, so datasets require scripted scenarios and careful negative example coverage
What does smart city training data actually look like?
Most guides describe what smart city AI can do. Few explain what the underlying training data actually contains. Here's a concrete breakdown.
Where does the data comes from?
Smart city training data doesn't come from one source , and the capture modality shapes everything downstream:
- Fixed CCTV and infrastructure cameras: continuous, location-specific coverage, but introduce fixed-angle bias. A model trained on footage from one camera height won't automatically generalize to a camera mounted three meters higher across town
- Mobile survey vehicles: high-volume, geographically diverse footage collected at speed. Introduces motion blur, variable lighting, and inconsistent conditions that make annotation significantly harder
- UAVs and aerial cameras: top-down perspectives useful for crowd density and large-scale traffic analysis, but require separate annotation workflows and don't transfer to ground-level models
- Dashcam and in-vehicle footage: abundant and useful for pre-training, but the perspective mismatch with fixed surveillance cameras means it works better as supplementary data than a primary source
Critical point: most synthetic urban datasets are built from egocentric, vehicle-mounted cameras , the perspective used for autonomous driving research. Smart city surveillance cameras have fundamentally different geometry: steep downward angles, wider focal lengths, greater heights. Models trained on egocentric data do not generalize well to overhead surveillance angles (Neto et al., 2025).
Annotation types , matched to use case
| Use case | Annotation type | Why |
| Vehicle detection | 2D bounding boxes | Fast, sufficient for localization |
| Pedestrian tracking | Instance segmentation | Pixel-level precision needed for dense scenes |
| Traffic flow analysis | Trajectory annotations | Multi-frame movement paths, not just single frames |
| Depth estimation / sensor fusion | Depth maps | Distance from camera per pixel |
| License plate recognition | OCR / text annotations | Character-level accuracy required |
| Road defect classification | Fine-grained class labels | Severity distinctions matter for maintenance prioritization |
Real-world vs. synthetic data , the trade-off
- Real-world data: high fidelity, directly reflects deployment conditions, but slow and expensive to annotate (Cordts et al.,2016) reported annotation times exceeding 1.5 hours per image for fine-grained segmentation in the Cityscapes dataset
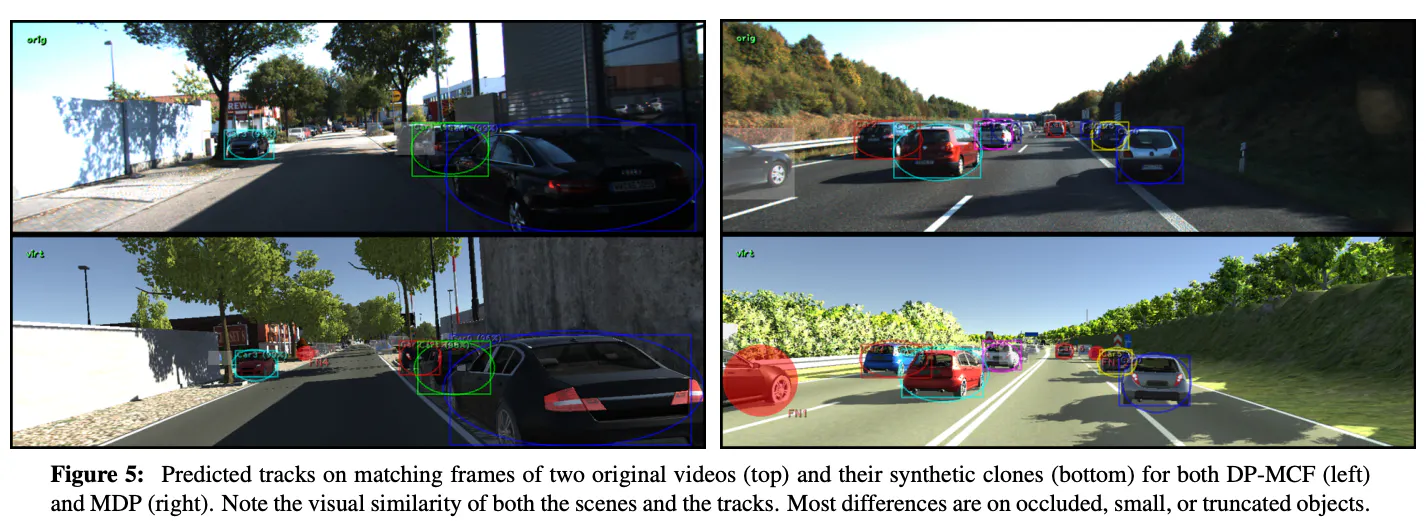
- Synthetic data: automatically annotated, scalable, privacy-safe , the ENDLESS framework (Neto et al., 2025) generated 378,751 labeled frames across 40 camera viewpoints, 8 city maps, 5 weather conditions, and 3 times of day with a single script execution
- The reality gap: models trained exclusively on synthetic data can fail on real deployments in ways that are hard to predict (Tobin et al., 2017)
- The proven approach: pre-train on synthetic, fine-tune on real. (Gaidon et al.,2016) demonstrated this consistently outperforms training on real data alone for multi-object tracking tasks
How much data does a smart city model actually need?
Published benchmarks give useful reference points:
- Cityscapes (Cordts et al., 2016) : 25,000 frames, fine + coarse annotation, the standard baseline for urban scene understanding
- KITTI (Geiger et al., 2012): ~15,000 frames, vehicle-mounted camera, object detection and depth estimation
- Synthehicle (Herzog et al., 2023): 612,000 synthetic frames, multi-camera tracking from surveillance perspectives
- ENDLESS (Neto et al., 2025): 378,751 frames, 40 camera views, full weather and lighting diversity
Volume matters less than coverage. A 50,000-frame dataset spanning diverse lighting, weather, and camera angles will typically outperform a 200,000-frame dataset captured under uniform conditions.
Why are Smart City Computer Vision datasets are uniquely difficult to build?
smart city and urban environments create data challenges that don't exist in controlled settings. Here's what teams consistently underestimate:
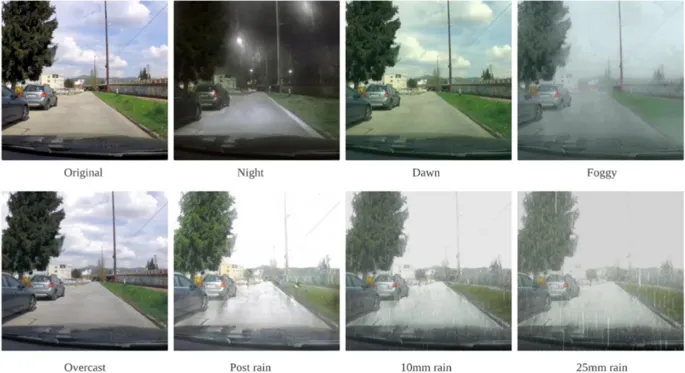
1. Lighting and weather variation
- A single intersection looks completely different at 8am in summer sun, 6pm in winter rain, and midnight in fog
- Models trained only on clear-sky footage fail in adverse conditions , not partially, but significantly
- The ENDLESS framework (Neto et al., 2025) models five distinct weather states specifically because each creates meaningfully different visual characteristics
- Vialytics captured this in practice: municipal vehicle cameras produce images with glare from bonnets, reflections from wet road surfaces, and extreme sun-shadow transitions that standard models weren't built to handle
- What this means for dataset design: weather and lighting coverage requirements must be specified explicitly upfront, not assumed to emerge from a large enough dataset
2. Camera angle and viewpoint diversity
- Most publicly available urban datasets , including most synthetic datasets , use vehicle-mounted, egocentric cameras at roughly eye level
- Smart city infrastructure uses cameras mounted on buildings and streetlights at steep downward angles with wider focal lengths
- These aren't minor variations , they represent completely different perspective geometry
- What this means for dataset design: if your training data camera geometry doesn't match your deployment camera geometry, you will see the gap in production performance
3. Occlusion and object overlap
- Pedestrians stand in front of vehicles. Cyclists pass behind buses. Multiple objects overlap at busy intersections
- Partial visibility is the norm in high-density urban footage, not the exception
- Annotation guidelines that don't specify how to handle occlusion create inconsistent ground truth , one annotator draws a box around only the visible portion, another estimates the full extent. Both choices are defensible; mixing them silently degrades model performance
- What this means for dataset design: explicit occlusion policies in annotation guidelines, automated consistency checks, and review workflows that specifically surface disagreements on occluded objects
4. Geographic and regional variance
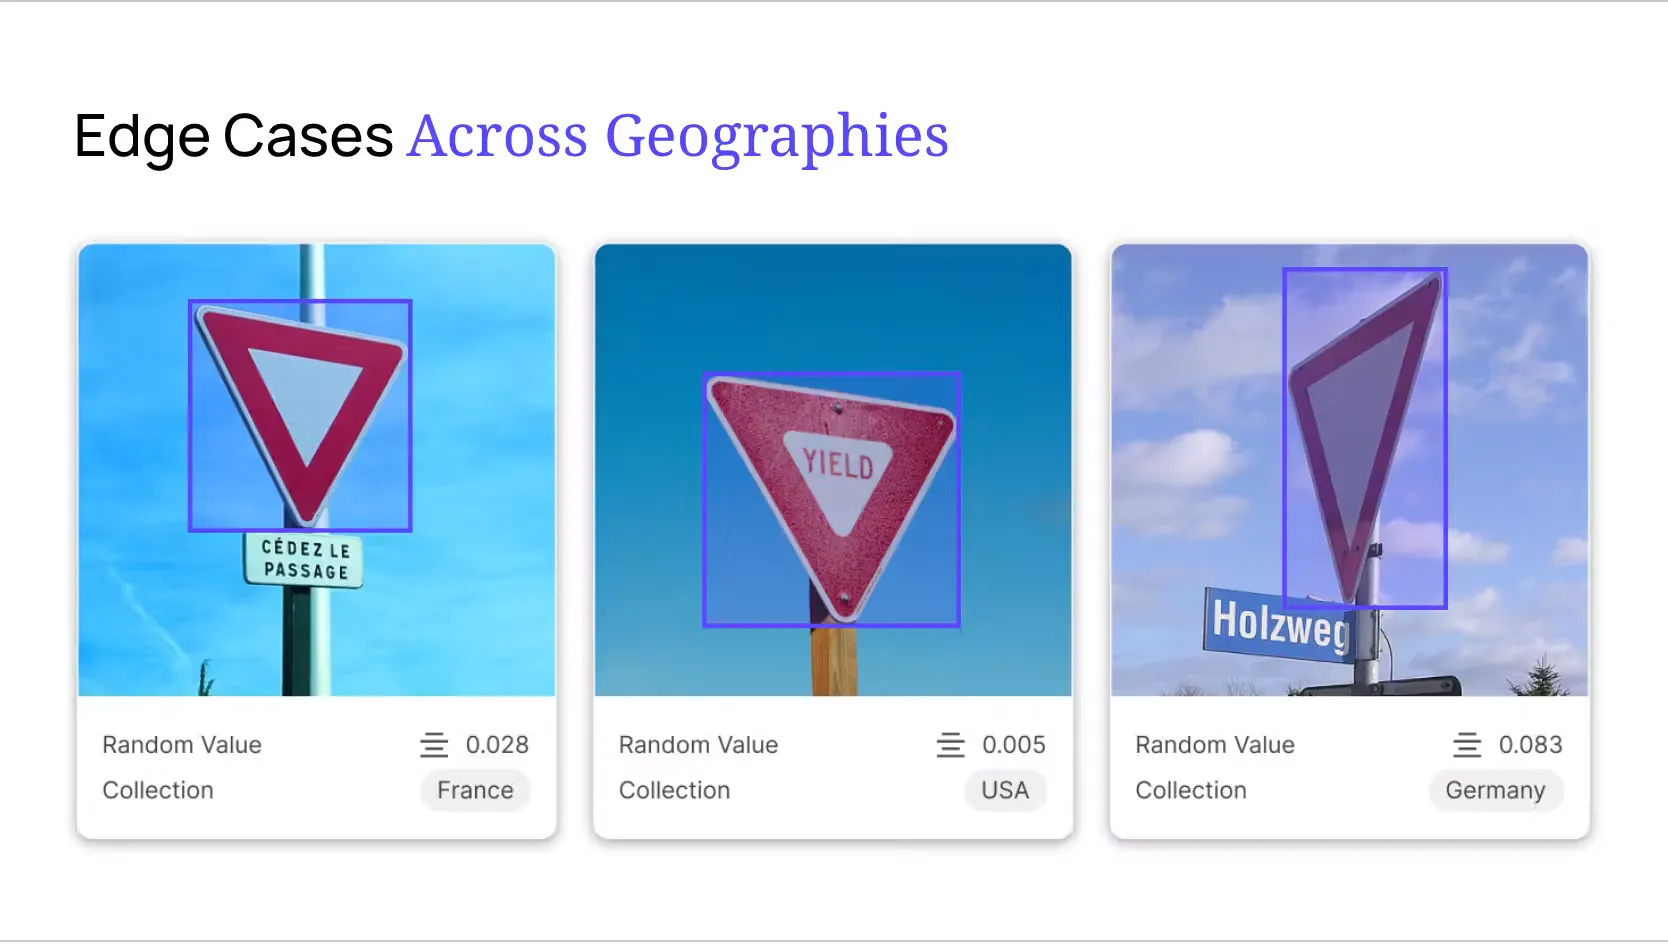
- Road signs, surface types, vehicle fleets, and urban layouts vary meaningfully between cities and countries
- Road damage detection proved more geographically transferable, because pavement failure modes are relatively consistent regardless of location
- Vialytics found that road signs in Germany share visual similarity with other European countries but carry different meanings , requiring country-specific classifiers rather than a single unified model
- What this means for dataset design: identify which aspects of your task are geographically invariant and which require regional specialization before building a single global dataset that ends up mediocre everywhere
5. Privacy and data governance constraints
- Urban imagery at scale captures faces, license plates, and behavioral data about identifiable individuals
- Depending on jurisdiction, using that data to train commercial AI models requires specific legal bases, anonymization steps, or consent frameworks
- In practice: automated face blurring and license plate redaction must be built into the pipeline before data surfaces to annotation teams
- Synthetic data sidesteps this entirely , a CARLA-generated urban scene contains no personally identifiable information by definition.
- What this means for dataset design: compliance requirements belong in the pipeline architecture, not as an afterthought after collection
How to Build a smart city dataset? 5 decisions that determine model performance
1. Define your task before you collect a single frame
- Traffic flow analysis, pedestrian re-identification, road defect classification, and anomaly detection each require different annotation types, frame rates, and coverage requirements
- A trajectory annotation workflow built for traffic monitoring is overly complex for infrastructure inspection
- An annotation schema designed for pothole detection will miss everything needed for crowd density estimation
- Define the task → define the model architecture → define annotation requirements → then design data collection around those requirements. Not the other way around
2. Design for edge cases from day one
- The failure modes of smart city models are almost always edge cases: unusual lighting, rare vehicle types, low-visibility conditions, atypical pedestrian behavior
- Passive data collection underrepresents all of these by definition
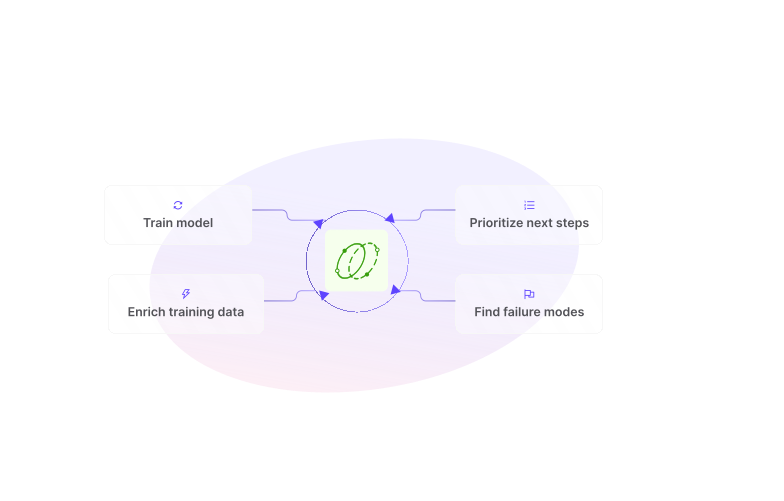
- Vialytics built this into their pipeline explicitly: continuously mining hard-to-annotate examples , frames where the model was uncertain, annotator disagreements, conditions outside the clean central distribution , and prioritizing those for labeling
- This approach (active learning / disagreement mining) produces significantly better model performance per annotation dollar than random sampling
- Finding where your model is uncertain is more valuable than confirming where it's already confident
3. Mix real and synthetic data for faster iteration
- Pure real-data pipelines are too slow, too expensive, or too privacy-constrained for most teams to get a working model off the ground quickly
- The proven workflow: generate synthetic data to cover the conditions you know you need (weather variation, lighting, camera angle diversity) → build initial model → use active learning to identify real-world performance gaps → direct real annotation effort at closing those specific gaps
- Gaidon et al. (2016) and Ros et al. (2016) both demonstrated that synthetic + real consistently outperforms either in isolation
4. Treat annotation consistency as an engineering problem
- Inconsistent annotations are a silent model killer , varying bounding box tightness, different occlusion handling, different thresholds for flagging defects all create contradictory training signal
- Vialytics implemented a two-stage review process: initial annotation followed by QA review, with specific focus on edge cases and disagreements
- Annotation guidelines were treated as living documents that evolved as new edge cases emerged , not a fixed specification written once and never revisited
- Platform-level quality controls (automated disagreement detection, annotator quality metrics, high-uncertainty routing) make this scalable
5. Know when to add LiDAR, radar, or sensor fusion
- Camera-only systems have real limitations: low-light performance degrades, monocular depth estimation is imprecise, distance to objects is inferred not measured
- LiDAR and depth maps address these directly , and frameworks like ENDLESS (Neto et al., 2025) generate automatic depth map annotations alongside RGB frames, making multimodal synthetic data tractable
- For initial deployments or lower-stakes use cases , camera-only with well-designed training data can achieve production-viable accuracy first
The future of Smart City AI , what the data stack needs to support.
The trajectory of smart city computer vision points toward three developments that will significantly shape data requirements over the next several years.
Self-supervised and semi-supervised learning to reduce annotation costs
- Self-supervised and semi-supervised approaches , which learn representations from unlabeled data and require labels only for a fraction of the training corpus , are increasingly viable for urban applications (Haoping et al., 2021).
- As these methods mature, the calculus of how much labeled data a smart city model needs will shift. The requirement for high-quality labeled data for fine-tuning and evaluation will remain, but the volume needed to bootstrap useful representations will fall significantly.
Synthetic data pipelines becoming standard practice
- Synthetic data generation is moving from research novelty to standard practice. Frameworks like ENDLESS (Neto et al., 2025) demonstrate that it's now possible to generate hundreds of thousands of automatically annotated, diverse urban training frames with a single script execution.
- As simulation environments become more realistic and domain randomization techniques improve, the reality gap will narrow , making synthetic data an increasingly reliable first-pass data source rather than a secondary one.
City-scale multimodal datasets and digital twins
- The most capable smart city AI systems will increasingly operate over multimodal inputs: camera feeds, LiDAR scans, radar data, IoT sensor streams, and geospatial data integrated into unified representations.
- Digital twins , real-time virtual models of physical urban environments , are the architectural direction that makes city-scale multimodal reasoning tractable. Building training data for these systems requires infrastructure that can handle heterogeneous data types, cross-modal annotation, and alignment between physical sensor data and simulated representations.
How Encord helps smart city teams build better training datasets
Smart city computer vision is a data problem as much as it is a modeling problem. Getting the training data right , the diversity, the annotation quality, the edge case coverage, the pipeline infrastructure , determines whether models work in production or fail when conditions change.
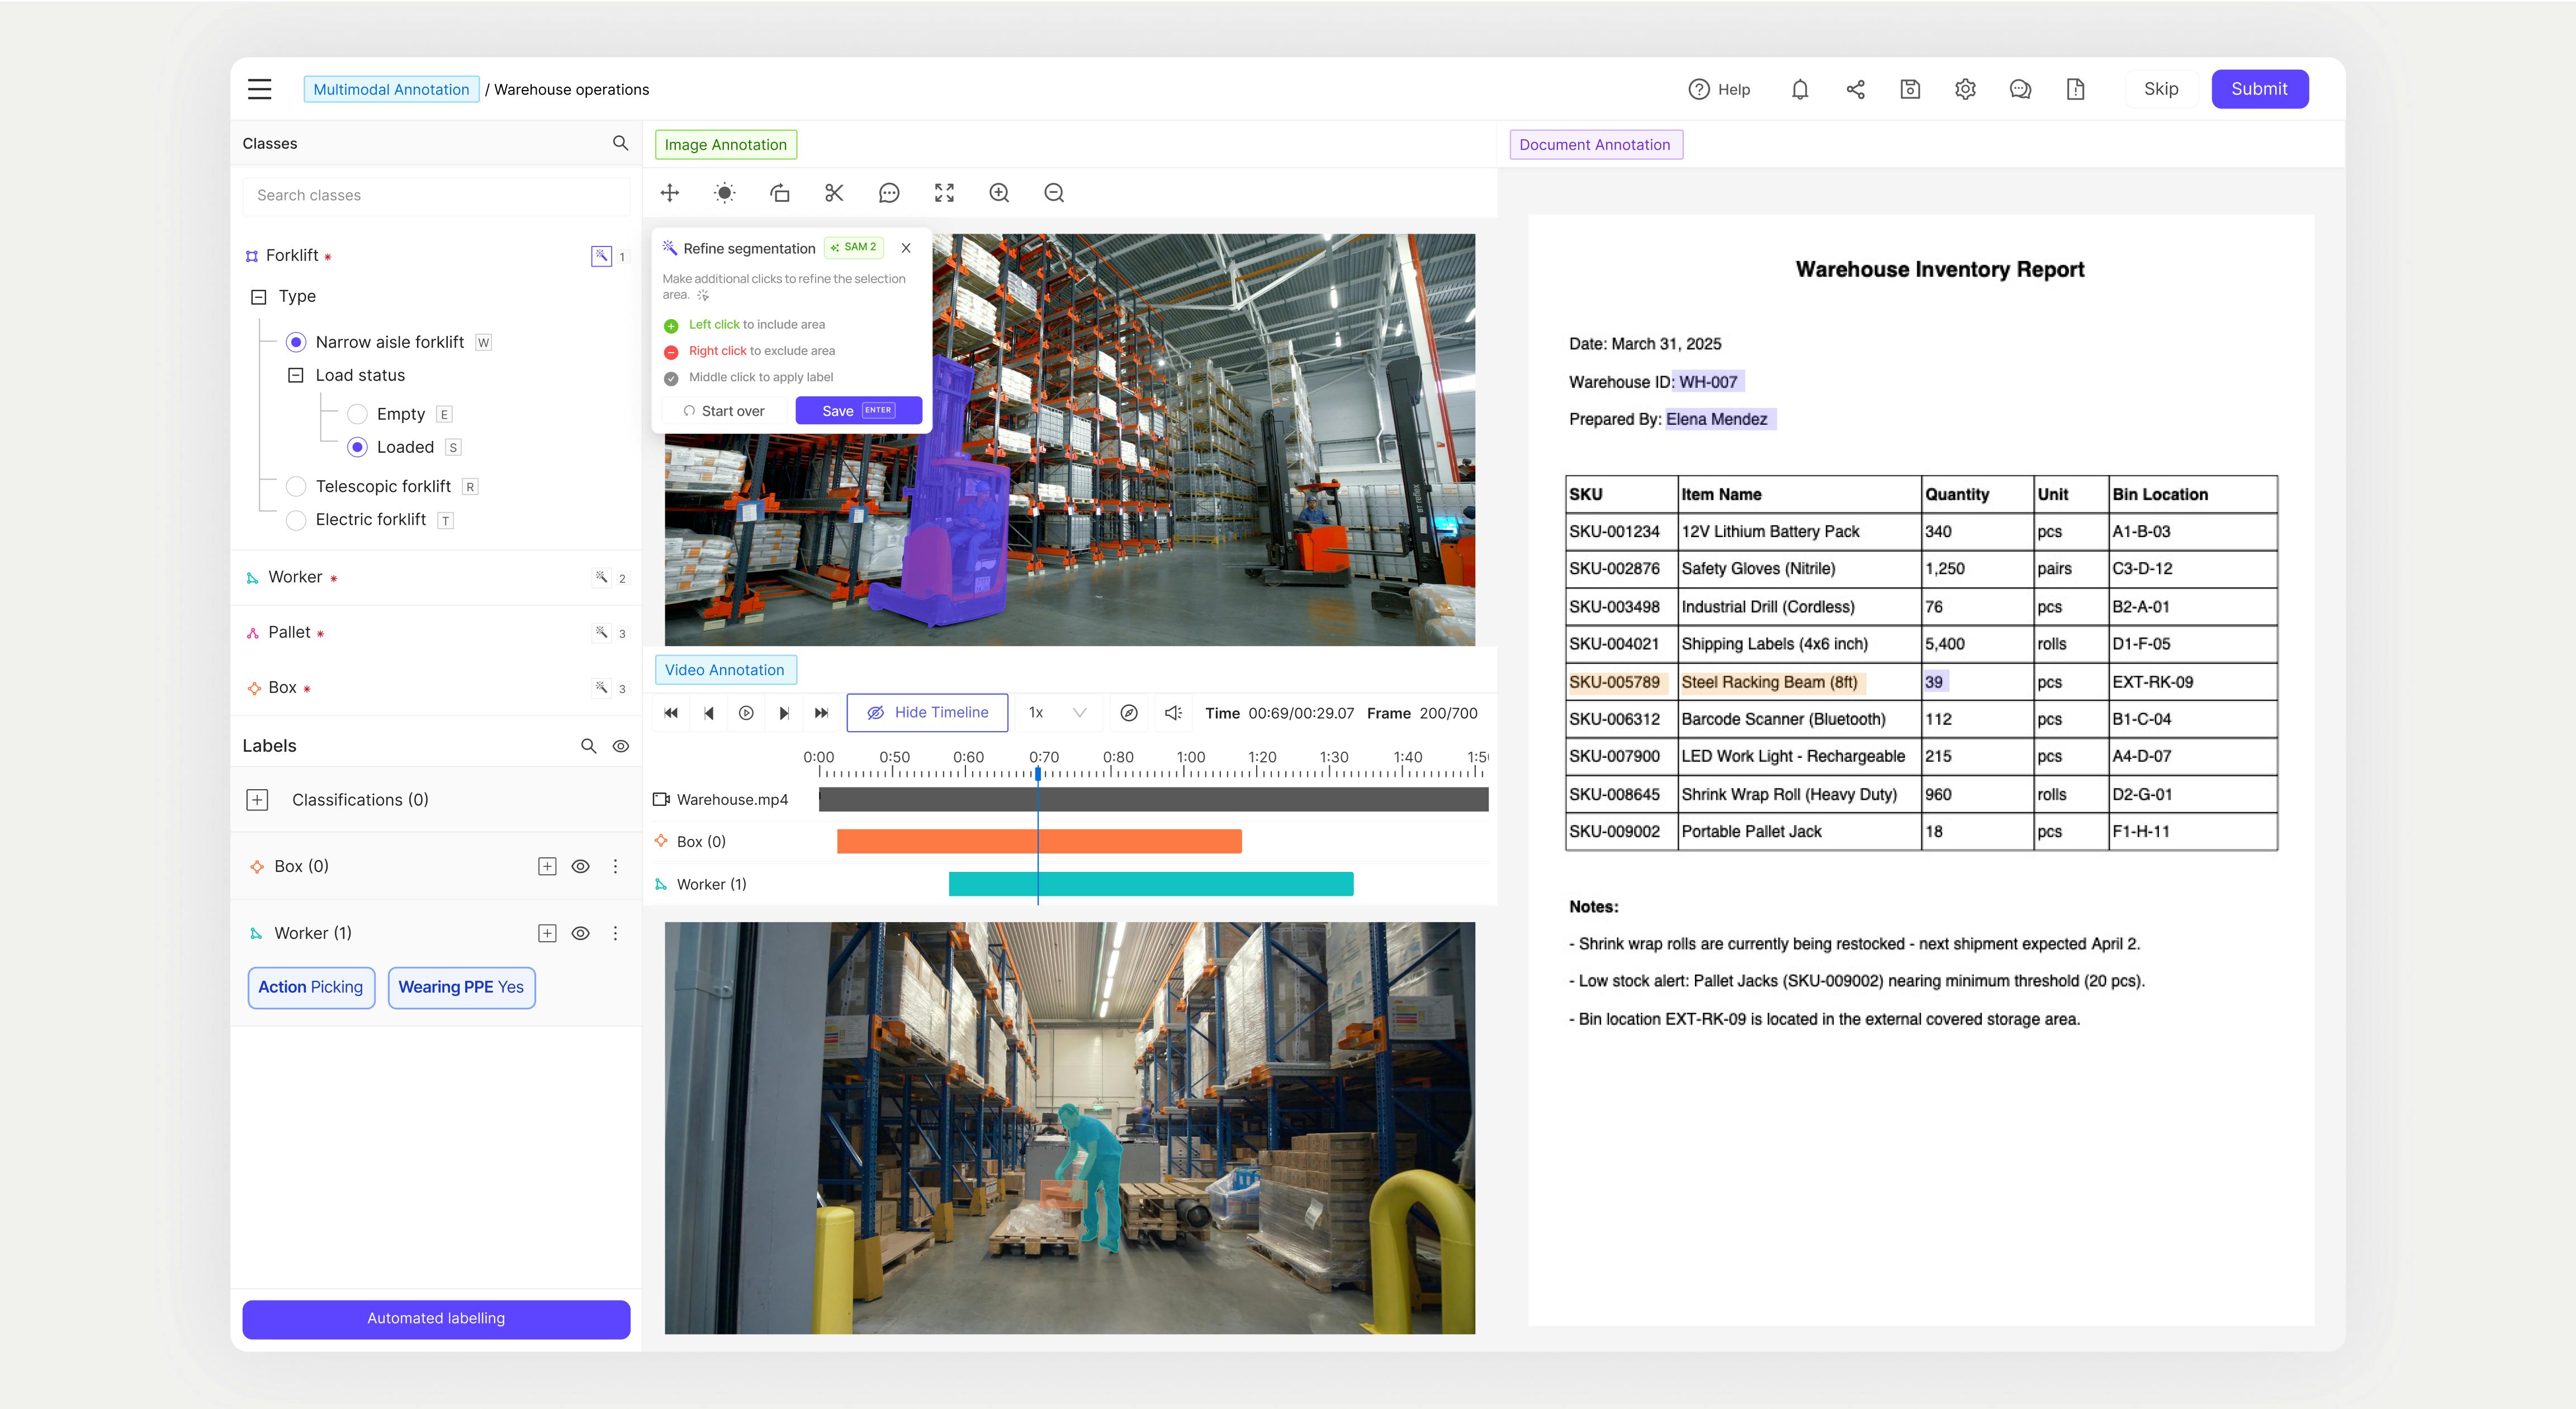
Encord is built for exactly this challenge. Our platform handles annotation across video, image, LiDAR, and multimodal data in a single workflow, with automated quality review, active learning loops that surface high-value examples for labeling, and data curation tools that give you visibility into what your dataset actually contains before you train on it.
Vialytics used Encord to scale their smart city data pipeline across hundreds of municipalities , consolidating data management, improving annotation consistency, and building the quality review workflows that their production models depend on.
If you're building computer vision for smart city infrastructure , whether that's AI traffic management, pedestrian safety, infrastructure monitoring, or anomaly detection , Encord gives you the data infrastructure to do it at scale.
Key takeaways
- Smart city computer vision is a data problem first. The models exist , the challenge is building training datasets that reflect the real variability of urban environments
- Different use cases require different data. AI traffic management, pedestrian detection, infrastructure monitoring, and anomaly detection each demand distinct annotation types, scale requirements, and coverage strategies
- Urban datasets are uniquely difficult to build because of lighting variation, camera angle diversity, geographic variance, occlusion complexity, and data governance constraints
- Synthetic data has matured significantly. Frameworks like ENDLESS (Neto et al., 2025) can generate hundreds of thousands of annotated urban frames automatically , most valuable for bootstrapping models and covering rare conditions
- Mixing real and synthetic data outperforms either in isolation. Pre-training on synthetic data and fine-tuning on real examples is now established practice
- Active learning and disagreement mining are not optional at scale. Finding where your model is uncertain and directing annotation effort there produces better models per dollar than random sampling
- Production deployments require continuous data pipelines. Smart city environments change , models must be updated, and data infrastructure must support ongoing learning
- Annotation consistency is a silent model killer. Platform-level quality review, explicit occlusion policies, and evolving annotation guidelines are operational necessities, not nice-to-haves