
Insights for AI Builders
Encord Blog
All articles
423 of 423 articles

Bounding Box vs. Polygon vs. Segmentation vs. Keypoint: Which Annotation Type Fits Your Task?
Image Annotation
Jul 23 2026
FDA's New Predetermined Change Control Plan Rule for Radiological AI Software, Explained
Healthcare
Jul 17 2026![The Eval Stack the Top AI Teams Are Building Right Now [Webinar Recap]](https://images.prismic.io/encord/Ofy3UdJLjLvH-X_S_AICircle_webinarbanner_speakers.jpg?auto=format%2Ccompress&fit=max)
The Eval Stack the Top AI Teams Are Building Right Now [Webinar Recap]
Model Evaluation
Jul 17 2026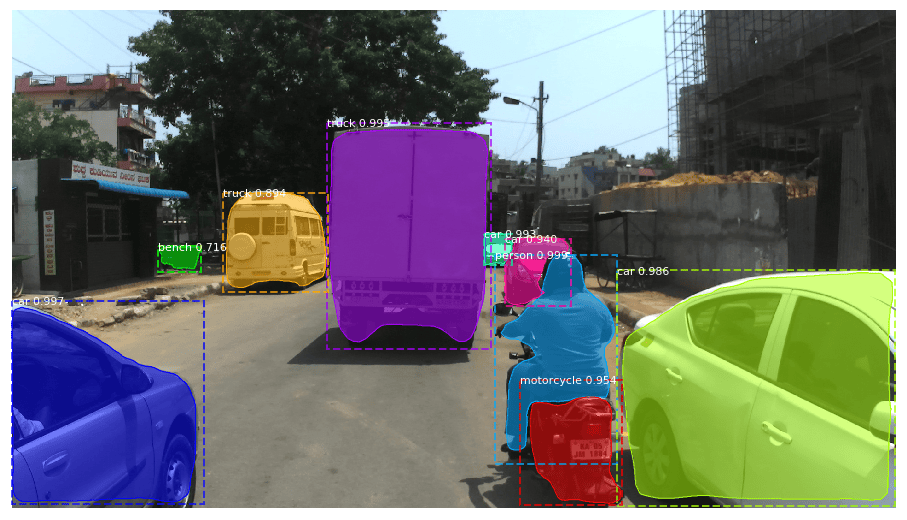
How to annotate video for ADAS and autonomous driving: A Technical Guide
Smart cities
Jul 15 2026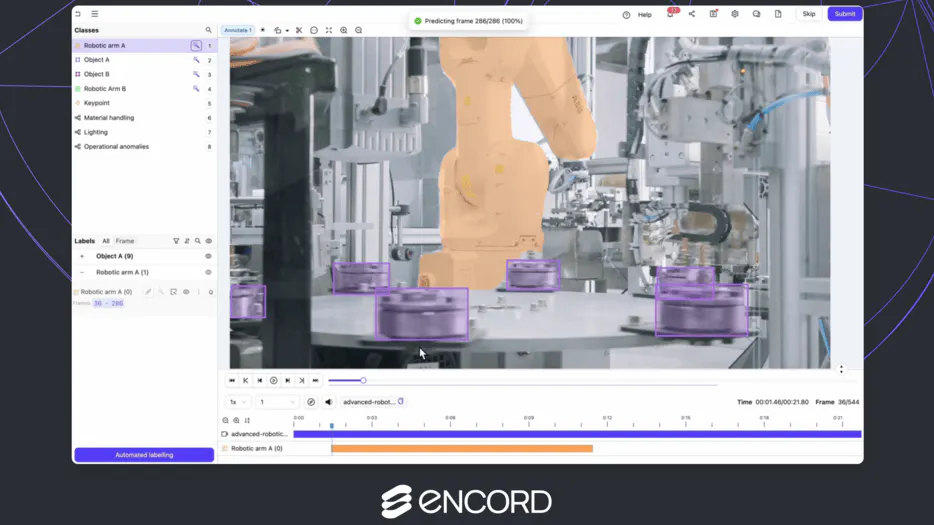
How to annotate video for machine learning: A Step-by-Step workflow
Video Annotation
Jul 13 2026
You Don't Have a Data Problem. You Have a Curation Problem
Data Curation
Jul 10 2026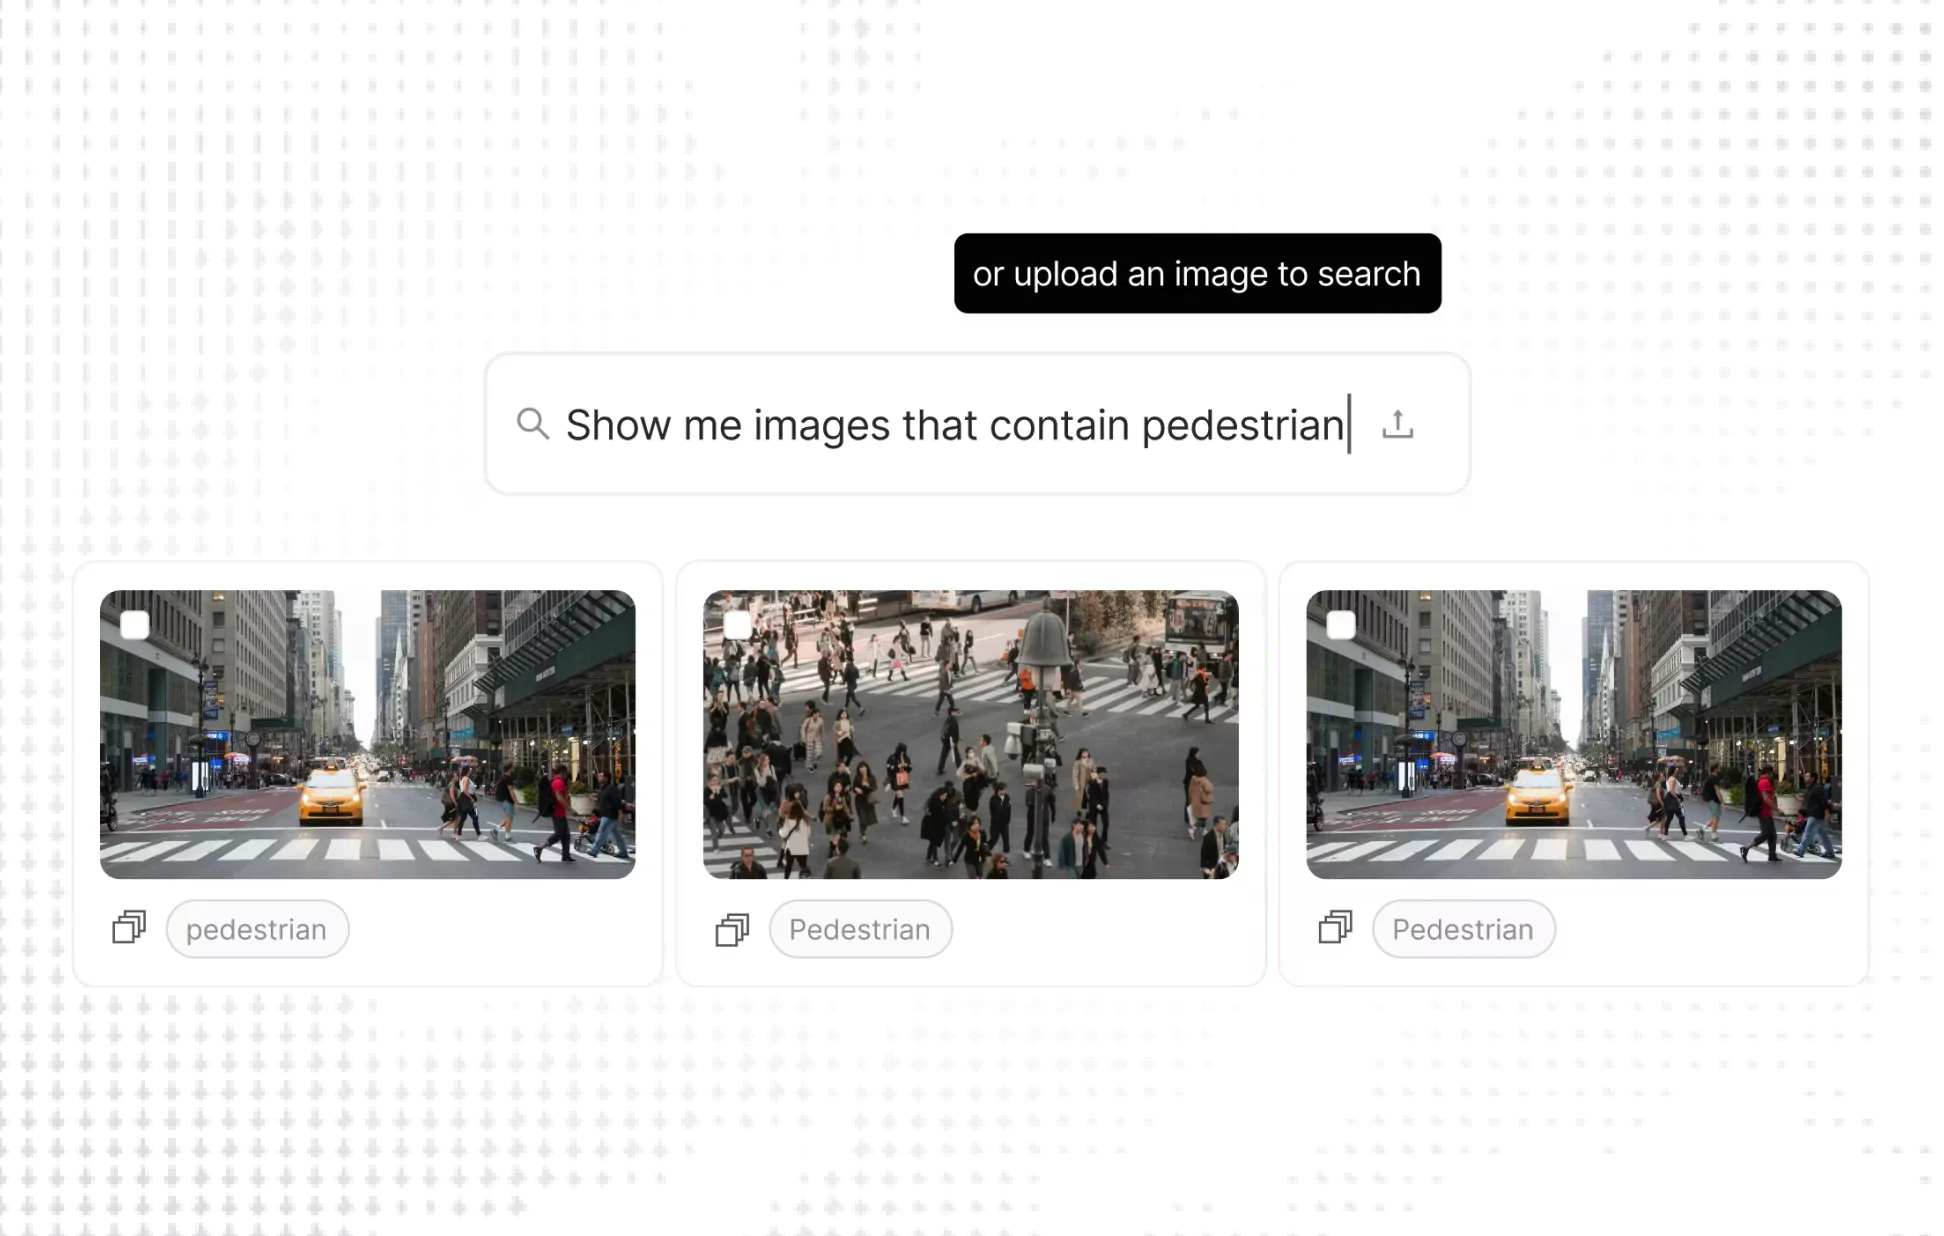
AI Data Curation for LLM and Multimodal Teams: A Practical Framework
Data Curation
Jul 09 2026
Data Curation Best Practices for AI: A Step-by-Step Framework
Data Curation
Jul 09 2026
Data Curation: What It Is and How It Works
Data Curation
Jul 08 2026![[Webinar Recap] How NVIDIA Cosmos 3 Is Changing the Way Physical AI Teams Build Training Data](https://images.prismic.io/encord/GV2SxWuhLGm0vpTQ_NVIDIAcosmoswebianrbanner-1-copy2.png?auto=format%2Ccompress&fit=max)
[Webinar Recap] How NVIDIA Cosmos 3 Is Changing the Way Physical AI Teams Build Training Data
Agents
Jul 07 2026
Multimodal Data Labeling: One Pipeline for Image, Video, Audio, Text and 3D
Data Annotation
Jul 07 2026
What Is AI Data Labeling? Definition, Types and the Process
Data Annotation
Jul 07 2026