F1 Score in Machine Learning

Product Manager at Encord
Machine learning (ML) has enabled companies to leverage large volumes of data to develop powerful models, generate insightful predictions, and make informed business decisions.
But to ensure the quality of the ML pipeline, it is important to be able to conduct an in-depth evaluation of model performance.
For this purpose, ML practitioners use evaluation metrics to determine the effectiveness of machine learning models. For instance, the F1 score is a fundamental metric for evaluating classification models and understanding how this metric works is crucial to ensure your classification model’s performance.
In this article, we will dive into:
- The significance of evaluation metrics in machine learning
- The fundamentals of classification metrics
- Understanding & interpreting the F1 score metric
- ML applications where the F1 score metric is critical
- Limitations & caveats of F1 score metric
- F-score variants
- Model evaluation with Encord Active

Evaluation Metrics in Machine Learning
Evaluation metrics play a critical role in improving the accuracy, efficiency, quality, and effectiveness of machine learning models by providing objective and quantitative performance measures.
For ML tasks, evaluation metrics:
- Provide model performance insights, i.e., data quality, correctness, error types, bias, and fairness.
- Assess the reliability and correctness of the model’s prediction
- Guide model selection by allowing a fair comparison of model variants
- Inform the hyperparameter tuning process
- Identify model limitations
- Aid stakeholders in decision-making
- A low F1 score often traces back to the training data, not the model. Data curation prevents the class imbalance and label noise that quietly tank evaluation metrics.
Poor F1 scores are frequently a labeling problem, not a modeling one. Read our Guide to Data Labeling for common quality pitfalls.
Using multiple metrics to evaluate model performance is a common practice in ML tasks since a model can give good outcomes on one metric and perform suboptimally for another. In such cases, practitioners try to find a balance between various metrics.

Different ML Tasks Have Different Evaluation Metrics
ML tasks have unique objectives, and their corresponding models have distinct parameters and properties. Hence, there’s no one-size-fits-all approach when it comes to evaluating ML models for different tasks. For instance:
- Classification tasks require metrics like accuracy, precision, recall, F1 score, and AUC-ROC.
- Regression tasks employ metrics like Mean Squared Error (MSE), Root Mean Squared Error (RMSE), Mean Absolute Error (MAE), and R-squared.
- Clustering tasks are evaluated using metrics like the Silhouette score, Dunn index, and Rand index.
- Ranking & recommendation tasks use metrics like MAP, NDCG, and precision at K.
 💡 Interested in learning about computer vision metrics? Here’s our Introductory Guide to Quality Metrics in Computer Vision.
 Before discussing the F1 score metric, let's understand the basics of classification metrics in more detail.
Fundamentals of Classification Metrics
Typically, classification tasks are categorized as binary classification (datasets with two classes or labels) and multi-class classification (datasets with more than two classes). Hence, classification models or classifiers try to predict labels or classes for the given data.
Classification Prediction Outcomes
Classifiers can have four possible outcomes:
- True Positives (TP): Events correctly predicted as positive.
- True Negatives (TN): Events accurately predicted as negative.
- False Positives (FP): Events wrongly predicted as positive when they were negative.
- False Negatives (FN): Events wrongly predicted as negative when they were positive.
Most classification metrics such as accuracy, precision, recall (also known as sensitivity or true positive rate), specificity (true negative rate), F1 score (harmonic mean of precision and recall), and area under the ROC curve (AUC-ROC) use the above four outcomes for calculating metric values.
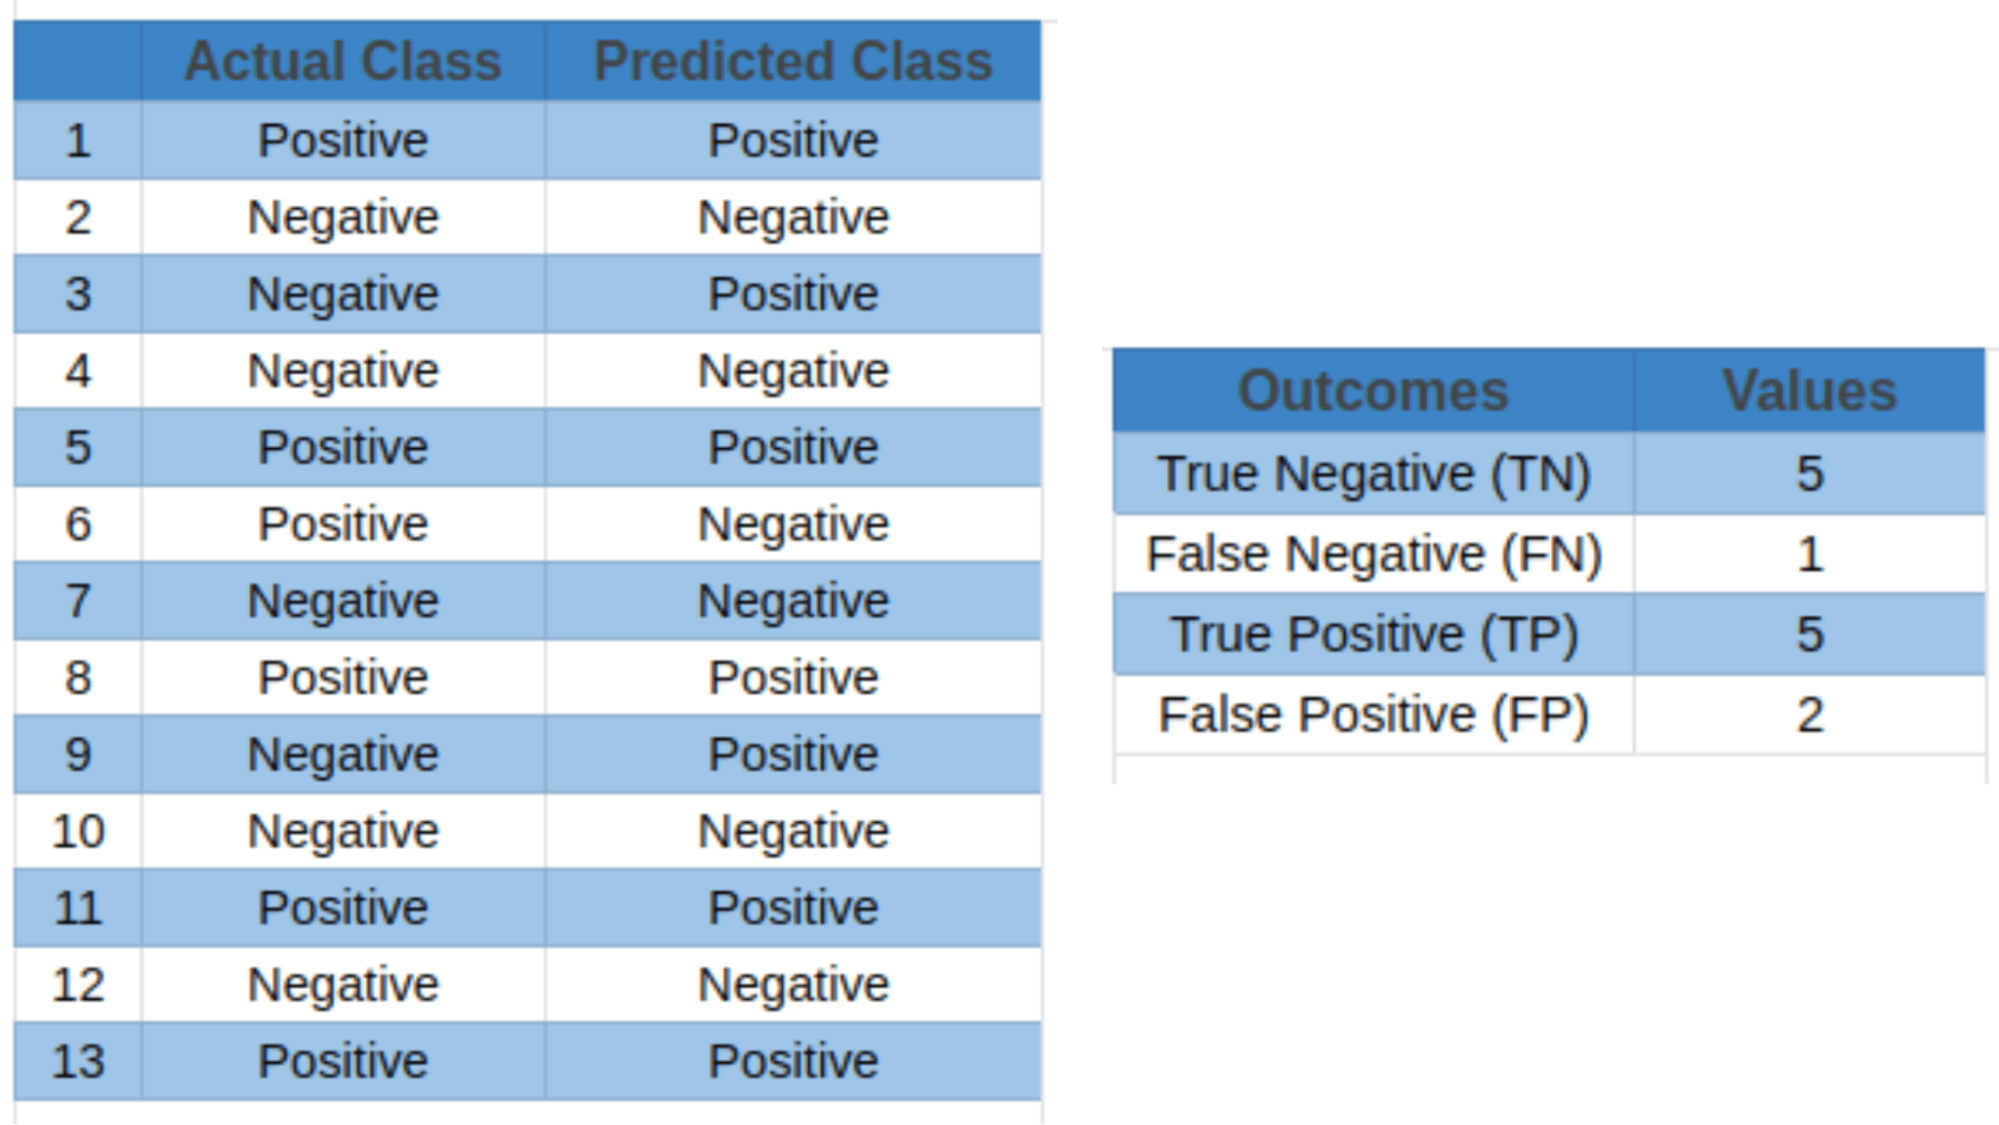
Table 1: Sample outcomes of a binary classification model
Confusion Matrix
A confusion matrix is a useful tool to evaluate the performance of a classification model by mapping its actual and predicted values. In binary classification tasks, it is a table that shows the four prediction outcomes discussed above: true positives, true negatives, false positives, and false negatives. This two-dimensional matrix allows ML practitioners to summarize prediction outcomes in order to seamlessly calculate the model's precision, recall, F1 score, and other metrics. Consider the following confusion matrix as an example:
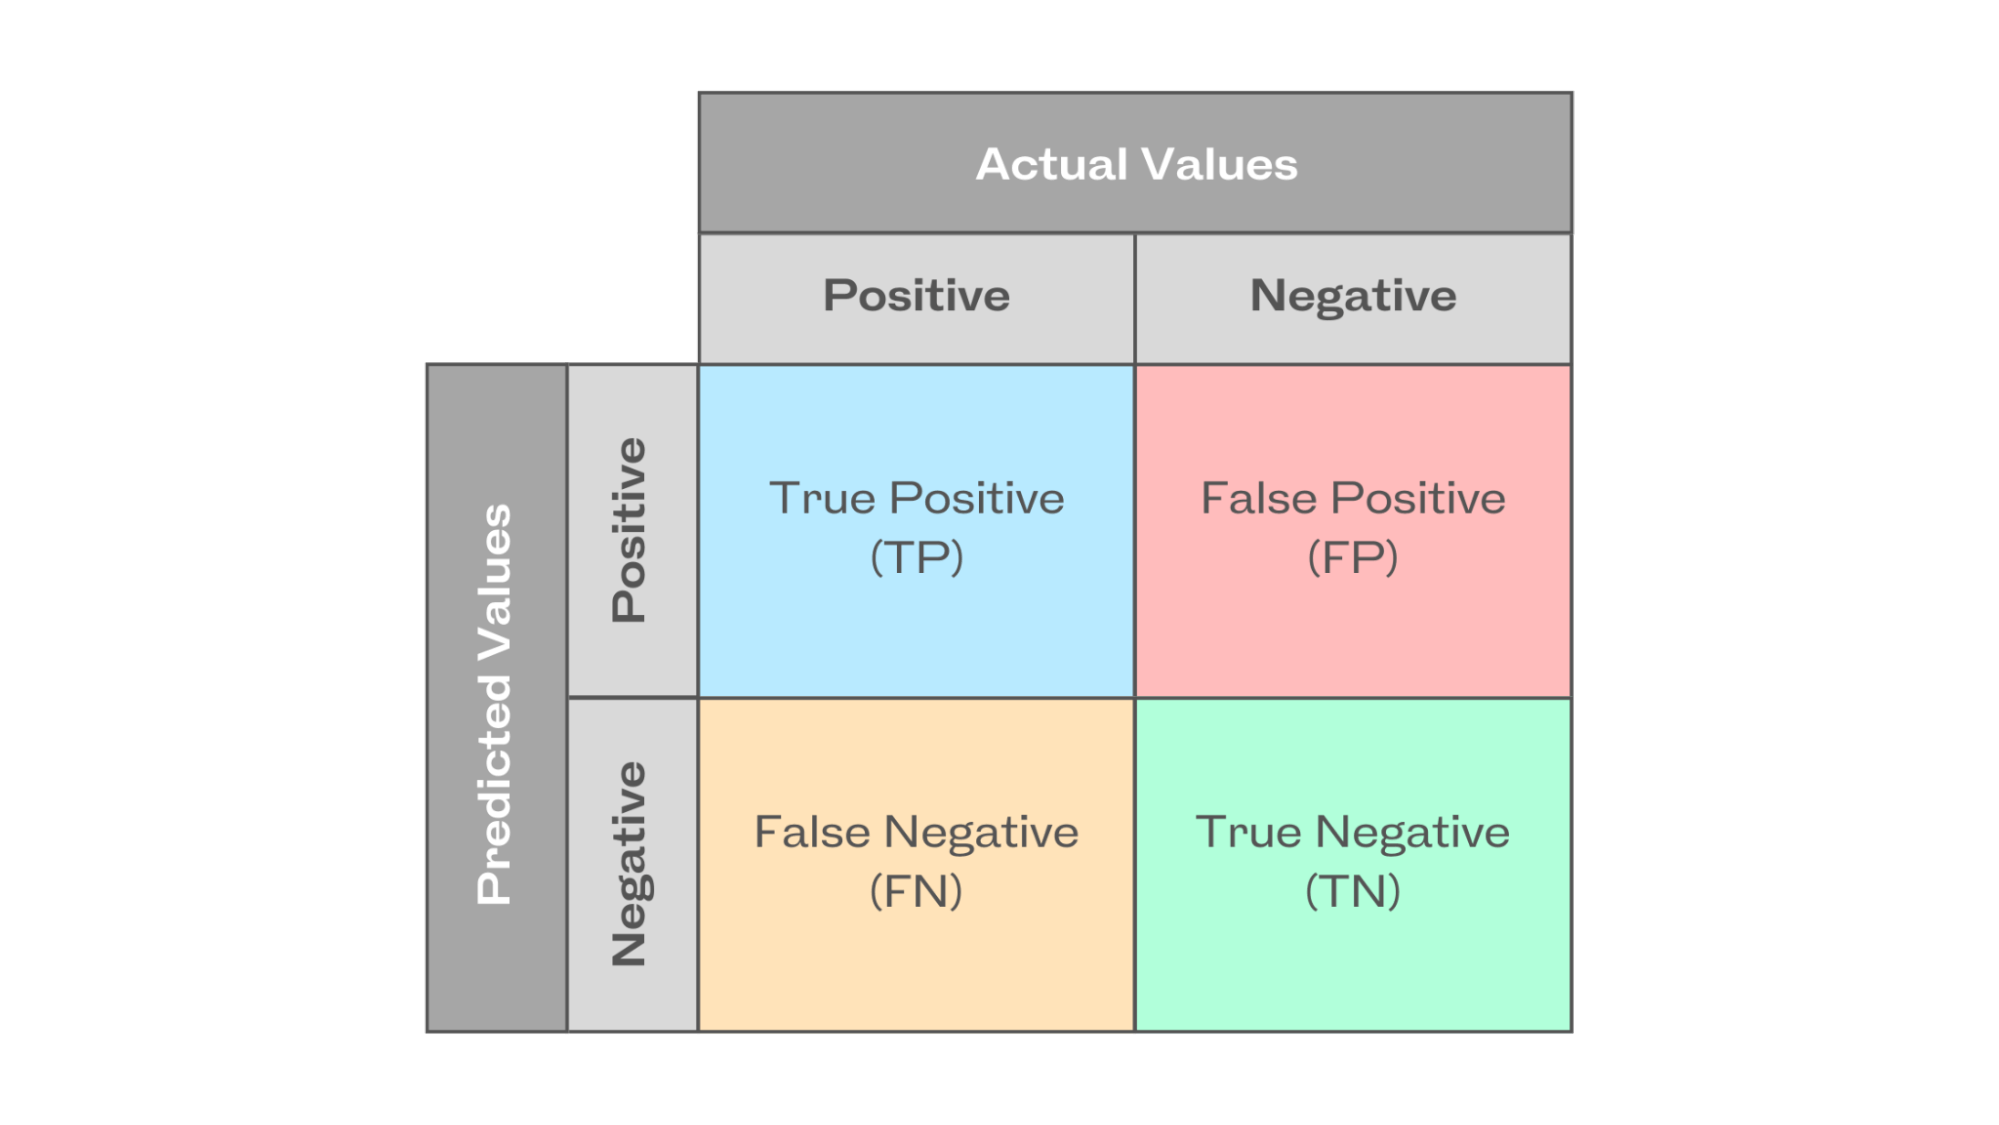
Illustration of confusion matrix
Understanding Accuracy, Precision & Recall
Accuracy
The accuracy metric calculates the overall prediction correctness by dividing the number of correctly predicted positive and negative events by the total number of events. The formula for calculating accuracy is

Let’s use the data of the model outcomes from Table 1 to calculate the accuracy of a simple classification model:

Typically, an accuracy score above 0.7 describes an average model performance, whereas a score above 0.9 indicates a good model. However, the relevance of the score is determined by the task. Accuracy alone may not provide a complete picture of model performance, especially In scenarios where class imbalance exists in the dataset. Therefore, to address the constraints of accuracy, precision, and recall metrics are used.
Precision
The precision metric determines the quality of positive predictions by measuring their correctness. It is the number of true positive outcomes divided by the sum of true positive and false positive predictions. The formula applied in calculating precision is:

Using the classification model outcomes from Table 1 above, precision is calculated as

Precision can be thought of as a quality metric; higher precision indicates that an algorithm provides more relevant results than irrelevant ones. It is solely focused on the correctness of positive predictions, with no attention to the correct detection of negative predictions.
Recall
Recall, also called sensitivity, measures the model's ability to detect positive events correctly. It is the percentage of accurately predicted positive events out of all actual positive events. To calculate the recall of a classification model, the formula is

Using the classification model outcomes from Table 1 above, recall is calculated as

A high recall score indicates that the classifier predicts the majority of the relevant results correctly. However, the recall metric does not take into account the potential repercussions of false positives, i.e., occurrences that are wrongly identified as positive – a false alarm. Typically, we would like to avoid such cases, especially in mission-critical applications such as intrusion detection, where a non-malicious false alarm increases the workload of overburdened security teams.
While precision and recall give useful information on their own, they also have limitations when viewed separately.
Ideally, we want to build classifiers with high precision and recall. But that’s not always possible. A classifier with high recall may have low precision, meaning it captures the majority of positive classes but produces a considerable number of false positives. Hence, we use the F1 score metric to balance this precision-recall trade-off.
F1 Score Metric
The F1 score or F-measure is described as the harmonic mean of the precision and recall of a classification model. The two metrics contribute equally to the score, ensuring that the F1 metric correctly indicates the reliability of a model.
It’s important to note that calculating the F1 score using arithmetic mean may not appropriately represent the model's overall performance, especially when precision and recall have considerably varied values. That’s because the arithmetic mean focuses on the sum of values and their average.
On the other hand, the harmonic mean emphasizes the reciprocal of values. It is computed by dividing the total number of values by the sum of their reciprocals. Hence, it enhances the effect of the smaller value on the overall calculation to achieve a balanced measurement. As a result, the F1 score takes into account both precision-recall while avoiding the overestimation that the arithmetic mean might cause.
The F1 score formula is

Using the classification model outcomes from Table 1, the F1 score is calculated as

Here, you can observe that the harmonic mean of precision and recall creates a balanced measurement, i.e., the model's precision is not optimized at the price of recall, or vice versa. Hence, the F1 score shows a strong performance in recognizing positive cases while minimizing false positives and false negatives. This makes it a suitable metric when recall and precision must be optimized simultaneously, especially in imbalanced datasets. As a result, the F1 score metric directs real-world decision-making more accurately.
Interpreting the F1 Score
The F1 score ranges between 0 and 1, with 0 denoting the lowest possible result and 1 denoting a flawless result, meaning that the model accurately predicted each label.
A high F1 score generally indicates a well-balanced performance, demonstrating that the model can concurrently attain high precision and high recall. A low F1 score often signifies a trade-off between recall and precision, implying that the model has trouble striking that balance. As a general rule of thumb, the F1 score value can be interpreted as follows:

What is a good F1 score and how do I interpret it?
However, depending on the task requirements, model use case, and the tolerance for mistakes, the precise threshold for what is considered “low” might also change. For instance, a simple decision tree classifier and a multi-layered deep learning neural network would have different ranges for high or low F1 scores.
Now, let's consider various ML applications where model evaluation requires a balance of precision and recall, deeming the F1 score as a more suitable evaluation metric.
ML Applications of F1 Score
Medical Diagnostics
In medical diagnostics, it is important to acquire a high recall while correctly detecting positive occurrences, even if doing so necessitates losing precision. For instance, the F1 score of a cancer detection classifier should minimize the possibility of false negatives, i.e., patients with malignant cancer, but the classifier wrongly predicts as benign.
Sentiment Analysis
For natural language processing (NLP) tasks like sentiment analysis, recognizing both positive and negative sentiments in textual data allow businesses to assess public opinion, consumer feedback, and brand sentiment. Hence, the F1 score allows for an efficient evaluation of sentiment analysis models by taking precision and recall into account when categorizing sentiments.
Fraud Detection
In fraud detection, by considering both precision (the accuracy with which fraudulent cases are discovered) and recall (the capacity to identify all instances of fraud), the F1 score enables practitioners to assess fraud detection models more accurately. For instance, the figure below shows the evaluation metrics for a credit card fraud detection model.
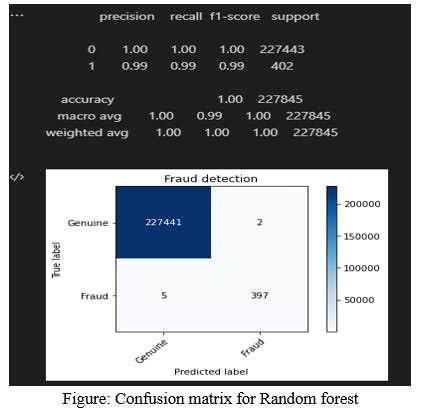
Implementation of Credit Card Fraud Detection Using Random Forest Algorithm
Limitations of F1 Score
ML practitioners must be aware of the following limits and caveats of the F1 score when interpreting its results.
Dataset Class Imbalance
For imbalanced data, when one class significantly outweighs the other, the regular F1 scoremetric might not give a true picture of the model's performance. This is because the regular F1 score gives precision and recall equal weight, but in datasets with imbalances, achieving high precision or recall for the minority class may result in a lower F1 score due to the majority class's strong influence.
💡 Interested in learning more about class imbalance in datasets? Read our Introductory Blog on Balanced and Imbalanced Datasets in Machine Learning. Cost Associated with False Prediction Outcomes
False positives and false negatives can have quite diverse outcomes depending on the application. In medical diagnostics, as discussed earlier, a false negative is more dangerous than a false positive. Hence, the F1 score must be interpreted carefully.
Contextual Dependence
The evaluation of the F1 score varies depending on the particular problem domain and task objectives. Various interpretations of what constitutes a high or low F1 score for different applications require various precision-recall criteria. Hence, a thorough understanding of the domain and the task at hand is needed to use and interpret the F1 score properly.
F-score Variants
To resolve severe class imbalance issues and achieve an appropriate balance between precision and recall, practitioners often use the following two variants of the F-score metric:
F2 Score
This variant places more emphasis on recall than precision. It is suitable for circumstances where detecting true positives is crucial. During the harmonic mean computation, recall is given more weightage.
The F2 score formula is as follows:

F-beta Score
This variant offers a dynamic blend of recall and precision by changing the beta parameter — weight coefficient which should be greater than 0. Based on the particular task requirements, practitioners can change the beta value, i.e., beta < 1 favors precision, and beta > 1 favors recall.
The F-beta score is calculated using the same formula as the F2 score, with beta dictating the importance of recall against precision.

Supplementing the F1 Score
Other performance metrics, such as the Area Under the Curve-Receiver Operating Characteristic Curve (AUC-ROC) can be used in addition to the F1 score to offer supplementary insights into an artificial intelligence model performance.
The AUC-ROC metric evaluates the model's capability to differentiate between positive and negative classes across various classification criteria or decision thresholds by plotting the true positive rate (TPR) versus the false positive rate (FPR), as illustrated below.
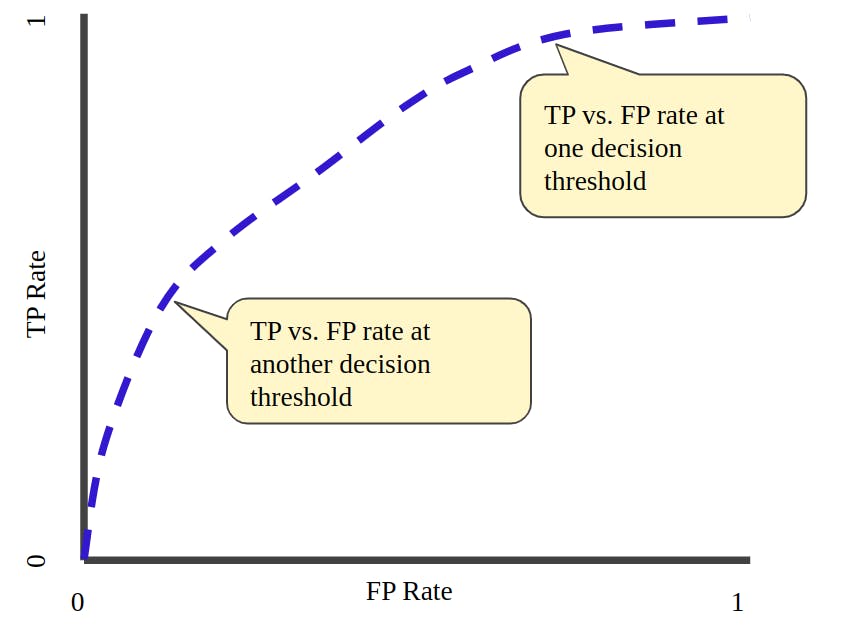
TP vs. FP rate at different classification thresholds
Future Research for F1 Score
As data science grows, researchers and practitioners continue to investigate the challenges posed by imbalanced datasets. Modified F1 scores that account for class imbalance are being developed to improve performance evaluation.
Another important area of focus for evaluation measures is fairness and ethics. The goal is to ensure that metrics take into account fairness towards specific subgroups or protected traits in addition to overall performance.
Moreover, another research proposes a new discriminant metric to gauge how well AI models perform in maximizing risk-adjusted return for financial tasks after arguing that metrics like the F1 score were unsatisfactory for evaluation.
Model Evaluation with Encord
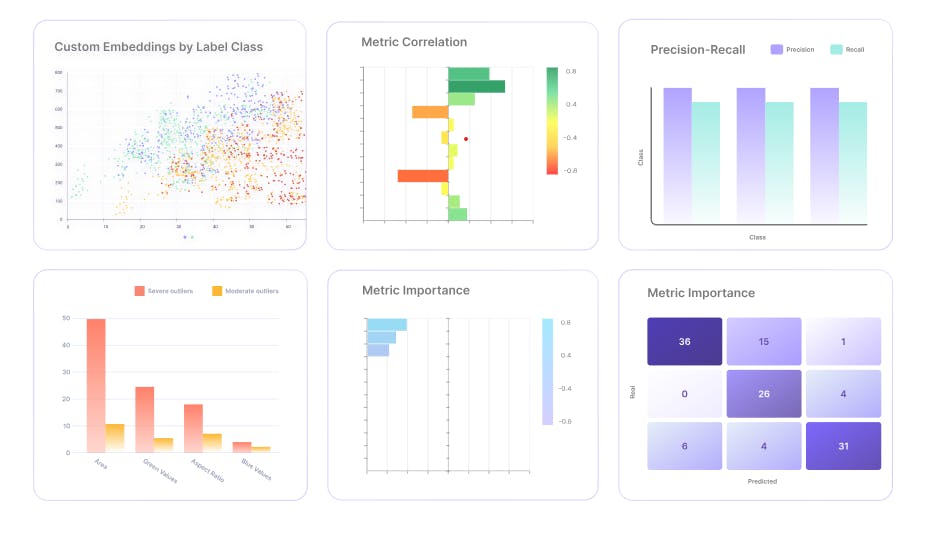
Encord Active is an ML platform that helps practitioners build better models. It offers the following features:
- Evaluation metrics visualization with intuitive charts and graphs
- Auto-identification of labeling errors
- Search and curate high-value visual data using natural language search
- Find and fix bias, drift, and dataset errors
- Find model failure modes with automated robustness tests
- Compare your datasets and models based on a detailed metrics evaluation
Hence, it provides practitioners with a variety of evaluation approaches and measures, including the well-known F1 score, accuracy, precision, and recall. With Encord Active, data scientists can evaluate machine learning models quickly because of its simple user interface and easy-to-understand evaluation process.
Frequently asked questions
The F1 score is a machine learning evaluation metric used to assess the performance of classification models.
F1 score lies in the range of 0 and 1. Typically, a good F1 score is greater than 0.9. However, the relevant machine learning task for which the F1 score is being measured determines the goodness criteria.
F1 score lies in the range of 0 and 1. Typically, a poor F1 score is less than 0.5.
Typically, an F1 score > 0.9 is considered excellent. A score between 0.8 and 0.9 is considered good, while a score between 0.5 to 0.8 is considered average. If the F1 score falls below 0.5, then the model is considered to have a poor performance.
Accuracy measures the number of accurately classified positive and negative predictions, while the F1 score balances the precision and recall values. If the dataset is imbalanced, then the accuracy metric gives poor results or leads to inaccurate interpretation of model performance. In this case, the F1 score metric gives a more stable model performance evaluation.
For binary classification, the F1 score determines the harmonic mean of precision and recall values between two class labels, i.e., positive and negative.
F1 score is the harmonic mean of precision and recall, while AUC measures the two-dimensional area under the ROC plot with FPR on the x-axis and TPR on the y-axis. It provides a measure of model performance at all classification thresholds.
The F1 score is considered a more stable evaluation metric for classification problems compared to accuracy, precision, and recall. This is because the F1 score metric tries to achieve a balance between the number and the quality of accurate model predictions.
The autonomous vehicle testing permit allows Encord to collect a substantial amount of data, which is crucial for developing and refining machine learning models. This increase in accessible data directly correlates with the growing needs for comprehensive annotation services to support ongoing research and development in the autonomous driving domain.
Encord allows users to analyze algorithm performance directly on existing annotations, providing insights into improvements or degradations across different algorithms. This capability enables teams to identify failure cases and optimize their models effectively.